
|
|
1.IntroductionHypoxia and angiogenesis are two intrinsically correlated characteristics of locally advanced solid tumors.1 Hypoxia is induced by an imbalance between oxygen delivery and oxygen consumption in tumor tissue.2 Tumor hypoxia can be classified into chronic and transient types. Chronic hypoxia is caused by limitations of oxygen diffusion, whereas transient hypoxia is caused by microvessel flow instabilities.3 Tumor angiogenesis is the formation of capillary sprouts and abnormal vascular structures in response to chemical stimuli during tumor progression.4 Uncontrolled angiogenesis in solid tumor yields a highly disorganized vasculature structure, as shown in Fig. 1. In comparison with normal vessels, tumor vessels are characterized by twists and turns, extremely winding, leaky, uneven diameter, excessive branching, and shunts.7–9 The complex interplay between hypoxia and angiogenesis in solid tumor contributes to its unique characteristics in microenvironment, metabolism, metastasis, selective induction of malignant phenotypes, and development of chemoresistance.10 The tortuous tumor vasculature also significantly affects the outcome of many anticancer therapies. On one hand, tumor vessels are commonly associated with increased transcapillary permeability, increased vascular permeability, interstitial hypertension, and increased flow resistance.11,12 Such an enhanced permeability and retention effect may facilitate selective delivery of molecules, proteins, and drug-loaded nanoparticles to the tumor site.13 On the other hand, only a very small fraction () of the administered therapeutics can be successfully delivered to the tumor site, leading to poor therapeutic outcome and dose-limiting toxicity.14 Recently, many efforts have been made to overcome the therapeutic limitation set by tumor hypoxia and angiogenesis, improve the drug uptake, and enhance the tumor response. These efforts include hyperoxic treatment before chemotherapy15–17 and ultrasound targeted microbubble destruction.18 In addition, tumor hypoxia, angiogenesis, and oxygen dynamics have been modeled mathematically for better understanding of the physiopathologic mechanisms and optimization of the therapeutic strategies.19,20 Furthermore, various optical imaging techniques, such as laser Doppler imaging, laser speckle contrast analysis (LASCA), and spectral reflectance imaging, have been developed for real time and noninvasive assessment of blood flow and oxygenation.21–23 These imaging tools may provide real-time feedback and quantitative guidance for improved drug delivery efficiency. Fig. 1Structural difference between normal and tumor vasculature, adopted from Carmeliet and Jain5 and Less et.al.6 with modification. (a) Healthy tissue forms a regularly patterned and functioning vasculature and (b) tumor vessels are typically leaky, heterogeneous, tortuous, and serpentine with irregular branching, leading to poor perfusion and hypoxia.  Despite the above research efforts, technical advances in drug delivery, numerical simulation, and optical imaging have not been widely implemented for clinical management of solid tumor. One of the major obstacles is the lack of controllable experimental models for quantitative validation and optimization of the emerging drug delivery techniques. This is our motivation to fabricate optical phantoms that can simulate tumor structural and functional anomalies for technical validation and optimization in anticancer drug delivery. As the field of biomedical optical imaging and spectroscopy moves from the benchtop to the bedside, optical phantoms become more and more important tools for training operators, for calibrating optical devices, and for performance evaluation.24,25 Various optical phantoms have been previously prepared to simulate optical properties (e.g., absorption, scattering, and anisotropy) and functional parameters (e.g., oxy- and deoxyhemoglobin) of biological tissue.26 However, many of the existing optical phantoms are made of homogeneous materials. Therefore, they do not simulate structural heterogeneity, microvasculature, and hemodynamic changes observed in the actual biological tissue. Consequently, optical measurements calibrated by these phantoms may involve significant bias. Microfluidics is an emerging technique with the potential to simulate tissue vascular network. It has versatile applications ranging from chemical engineering to biology and medicine.27–29 Long et al.30 used soft lithography to produce a silicone-based microfluidic system that circulated powder, black ink, blue food color, and uncured polydimethylsiloxane (PDMS) to match the optical properties of perfused liver. Luu et al.31 introduced a fast prototyping technique based on laser micromachining for the fabrication of dynamic flow phantoms. Parthasarathy et al.32 deployed laser speckle contrast imaging techniques to study the flow dynamics in microfluidic devices. Despite all these efforts, few researchers have fabricated optical phantoms that simulate vascular anomalies and hypoxia in solid tumor. In order to simulate tumor vascular network, we took three approaches. First, the topological differences between tumor and normal tissue vasculatures were studied and duplicated in PDMS phantoms. Second, tissue oxygen metabolism and vascular permeability were simulated by controlled mass transport using dialysis membrane. Finally, the oxygen saturation () levels and the blood flow patterns of simulated microvascular network were imaged by a dual-mode imaging system that combined multispectral imaging and laser speckle imaging. The performance of the proposed microvascular phantom was evaluated quantitatively in a benchtop setup. 2.Materials and Methods2.1.Design and Fabrication of Microchannel Network to Simulate Tumor VasculatureThe normal and tumor vasculature was adopted from Carmeliet and Jain5 and Less et al.6 with modification, as shown in Fig. 1. The main arteriole branches into a small arteriolar network to supply the capillaries. Then the capillaries drained into the small venules to incorporate into the main venules. The tumor vasculature incorporates trifurcations, true loops, and self-loops, which are specialized features of tumor vasculature. The diameter of vessel in our vasculature decreases as the branch increases. The mean values of main vessel widths of tumor vasculature we designed were 0.4 mm and the width of smallest branch was , which were designed according to Less et al.5 PDMS phantoms were fabricated using a SYLGARD® 184 silicone elastomer kit (Dow Corning, Midland, Michigan). The material was used because its refractive index () approximates that of soft mammalian tissue (1.33 to 1.50)33 and it is stable, elastic, and of adequate strength after curing.30 The master mold was produced using SU-8 negative epoxy (MicroChem Corp., Newton, Massachusetts), and silicon pellet. The fabrication process followed the standard procedure of soft lithography.34 Figure 2 illustrates the design of a sandwiched PDMS phantom that simulates oxygen metabolism and hypoxia in tumor vasculature. The phantom consists of an upper piece and a lower piece separated by a dialysis membrane. Fresh chicken blood is circulated through the microchannel in the upper piece to simulate tissue vasculature. Sodium sulfite solution is circulated through the microchannel in the lower piece to simulate oxygen consumption. The microchannels are 0.6-mm wide, 0.1-mm deep, and 20-mm long. The dialysis membrane enables selective transport of sodium sulfite to the upper microchannel and blockage of hemoglobin to the lower microchannel. Such a sandwiched phantom design will facilitate an effective control of blood oxygenation by adjusting the flow and the concentration of the sodium sulfite solution. Fig. 2Design of a sandwiched polydimethylsiloxane (PDMS) phantom with microfluidic assembly to simulate blood flow dynamics and metabolism in vascular network. The phantom consists of an upper piece and a lower piece separated by a dialysis membrane.  To prepare the above sandwiched PDMS phantom, the upper and the lower pieces were first fabricated by soft lithography. The two pieces were then sandwiched by a dialysis membrane and assembled by a modified plasma bonding process.35 Materials for the upper piece and the lower piece were prepared by mixing PDMS and the curing agent at ratios of and , respectively. Because the upper and the lower PDMS pieces had different material concentrations, reactive molecules remain at the interface between these two pieces according to Unger et al.36 The upper and the lower pieces were placed in an oven (DHG-9070A, Shanghai Sanfa Scientific Instrument Co., Ltd., China) at a constant temperature of 65°C for curing. Right before completion of curing, a dialysis membrane was soaked, unfolded, and placed between two PDMS pieces, with the membrane carefully positioned to fully cover the microchannels. The assembly was then treated by a plasma bonding machine (WH-1000Z, Wenhao Chip Technology Co., Ltd., China), followed by further curing at 80°C for 12 h. The results of an additional experiment demonstrated that the permeability of the dialysis membrane was not degraded when it was placed under 80°C for 12 h. The fabrication and assembling process for the sandwiched phantom is illustrated in Fig. 3. The PDMS phantoms that simulate normal and tumor vascular networks, as shown in Figs. 1(a) and 1(b), were produced by a soft lithographic process, as described earlier.35 First, the master mold of the vascular phantom was fabricated by soft lithography. Second, PDMS was cast onto the master mold and cured at 65°C for 1 h. Third, the PDMS replica of the master containing vascular network channels was peeled away from the silicon wafer. Finally, the PDMS replica and a flat slab of PDMS were treated by a plasma bonding machine, followed by further bonding at 80°C for 12 h as was done for the sandwiched PDMS phantom. 2.2.Numerical Simulation of Blood Flow Velocity in Vascular NetworkThe blood flow patterns of microvascular phantoms at different conditions were simulated using the commercial computational fluid dynamics (CFD) package FLUENT 6.3.26 (Ansys, Canonsburg, Pennsylvania). The simulation was based on the approximations of constant, uncompressible, and laminar flow and a rigid microfluidic device. The input flow rate was , the blood density was , and the dynamic viscosity was . 2.3.Experimental SystemThe simulated blood flow patterns were evaluated by our dual-mode imaging system in comparison with the actual experimental results. The dual-mode imaging system integrated LASCA and multispectral imaging for noninvasive assessment of blood perfusion and oxygenation.37 The scientific principle and the engineering design of the dual-mode imaging system have been discussed in detail by Ren et al.37 Figure 4 shows the dual-mode imaging system setup. The imaging component of the system was a 12-bit CCD camera (Microvision Digital Imaging Technology Co. Ltd., China) with a resolution of . An acousto-optic tunable filter (AOTF), tunable light source (500 to 900 nm, 10-nm bandwidth at 633 nm, Brimrose), and a laser device (, 150 mW, Changchun New Industries, China) were connected to a light ring via a bifurcated optical fiber. A syringe pump (Pump 33, Harvard Apparatus) was used to drive blood and sodium sulfite solution and to control their flow rate in the phantom. Such a dual-mode imaging system enabled noninvasive and simultaneous imaging of tissue oxygenation and perfusion. 2.4.Multimodal Imaging of Perfusion and Oxygenation2.4.1.Perfusion imaging of the phantom that simulates tissue vascular networkPDMS phantoms designed as in Fig. 1(a) were used to simulate the blood flow of the normal vascular network with LASCA. A syringe pump was used to drive fresh blood and control the input flow rates of fresh blood in the phantoms. During the experiment, seven levels of regular input blood rate ranging from 0 to were achieved by a syringe pump. At each flow rate plateau, 20 consecutive speckle images were acquired at a sampling rate of . Ten of these consecutive speckle images were used to calculate 10 perfusion maps of the simulated tissue vascular network by a spatial LASCA algorithm.37 The speckle on the raw image was produced because of the motion of red blood cells under the illumination of coherent light. The intensity and variance of the raw speckle image were obtained to calculate the contrast value in a region of interest. Then the perfusion value, which had a negative correlation with contrast, will be calculated by an equation in Ref. 37. 2.4.2.Oxygenation imaging of the phantom that simulates tumor hypoxiaA sandwiched phantom, as shown in Fig. 2, was fabricated to simulate blood oxygen metabolism, vascular permeability, and tumor hypoxia. Figure 5 illustrates a schematic drawing of an experiment setup. Fresh chicken blood was circulated through the microchannel in the upper piece of the sandwiched phantom to simulate the blood oxygen supply. Sodium sulfite solution () was circulated through the microchannel in the lower piece of sandwiched phantom to simulate cellular oxygen consumption. A dialysis membrane was sandwiched between two microchannels to simulate vascular permeability. Tumor vascular metabolism was simulated by varying blood flow rate () and sodium sulfite solution flow rate (), which might be equivalent to change the rates of oxygen supply and consumption. Dynamic control of oxygenation was demonstrated following three steps. First, sodium sulfite was continuously added and mixed with fresh blood until the oxygenation level approximated zero, as measured by a Moor oxygenation monitor (VMS-OXY, Moor Instruments Inc., Devon, United Kingdom). Then fresh chicken blood and oxygen-free blood were used to calibrate the oxygenation measurements in the microchannel. Second, the inlet blood flow rate was controlled at 10 levels from 1 to , and the inlet sodium sulfite flow rate was controlled at two levels of 1 and , respectively. Third, the inlet sodium sulfite flow blood flow rate, , was controlled at 10 levels from 1 to , and the inlet blood flow rate, , was controlled at two levels of 1 and , respectively. The designated flow rates were maintained for 2 minutes until the of the circulated blood was stabilized. Then the multispectral images were acquired at each plateau, the map was reconstructed by a wide gap second derivative reflectometry algorithm,38 and was calibrated to full scale. Fig. 5Schematic drawing of an experimental setup for simulating blood oxygen metabolism and tumor hypoxia. 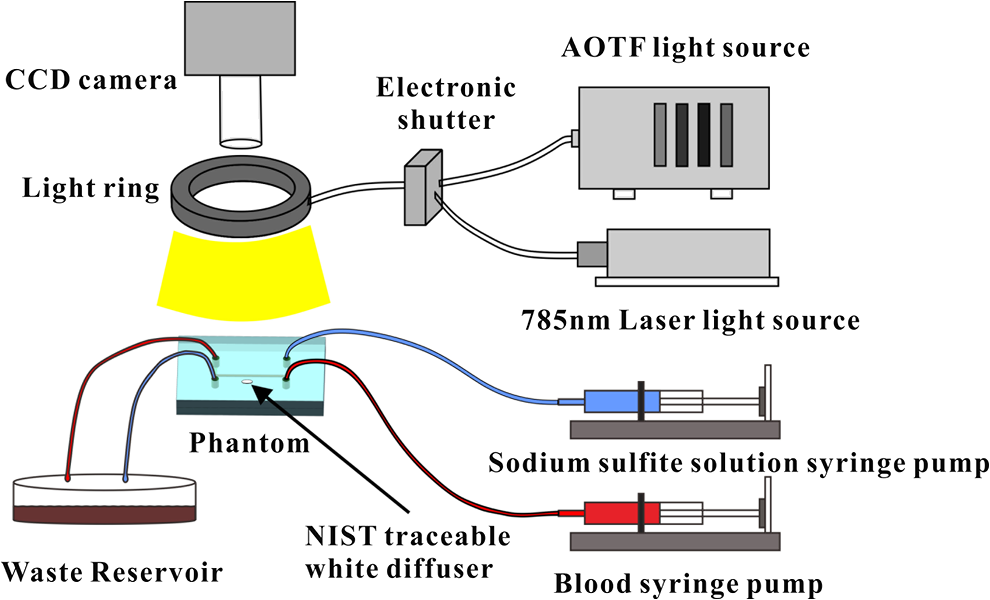 To obtain multispectral data set, a sample to be measured and a 99% reflected diffuser (National Institute of Standards and Technology, Gaithersburg, Maryland) were placed within the field of view of the CCD camera at an equal height. Then an image of the dark environment was captured to record the dark current noise of the CCD chip. An AOTF tunable light source was controlled to illuminate the phantom with the specific wavelength beam (544, 552, 568, 576, 592, and 600 nm) successively, while the autoexposure adjusting function was run to set up the optimal exposure time of each wavelength in case of improper intensity of the sample. After that, the monochromatic images of every wavelength were taken and stored at a corresponding exposure time for further processing. The imaging algorithm includes four consecutive steps of calculating absorption–scattering ratio, deriving wide-gap second derivative, obtaining analytical expression of the second derivative ratio, and curve fitting for calculation. More details about the algorithm were introduced by Huang et al.39 2.5.Simulation of Blood Perfusion in Tumor VasculaturePDMS phantoms designed as in Fig. 1(b) were used to simulate the blood perfusion of the tumor vasculature. The three-dimensional size of PDMS phantoms were . The microchannels of tumor vasculature were 0.1 mm deep. The maximum width of microchannels was 0.4 mm, and the minimum width was 0.02 mm. The blood perfusion was evaluated by LASCA at different flow rates and compared with that of a normal tissue vascular network. 3.Results and Discussion3.1.Multimodal Imaging of Blood Perfusion and Oxygenation3.1.1.Perfusion imaging of the phantom that simulates tissue vascular networkFigure 6(a) shows the photographic image of the microchannel network that simulated the regularly patterned and normally functioned tissue vascular network. The microchannel network was circulated with chicken blood to simulate tissue perfusion. Figure 6(b) shows the numerical simulation of the blood velocity distribution for the vascular network, as designed in Fig. 6(a). Figure 6(c) shows the blood perfusion map of the actual microchannel network measured by laser speckle contrast imaging. LASCA enabled real-time and dynamic imaging of relative blood flow within tissue vasculature. Since the technique is based on pixel operation of the laser speckle pattern, it has relatively low spatial resolution in comparison with other imaging methods.40,41 In Figs. 6(b) and 6(c), the data are normalized by the inlet flow velocity. According to Figs. 6(b) and 6(c), numerical simulation and the actual experiment yield similar blood flow patterns at the same inlet flow rate of . Furthermore, such a vascular topology that simulates normal tissue yields uniform blood flow distributions at the individual network levels, as denoted by numbers 1 to 6 in Fig. 6(b). Six regions of interest (ROIs) as marked in Figs. 6(b) and 6(c) were selected in order to explore the correlation between the simulated and the experimental flow patterns of the designed vascular network. The perfusion levels within the individual ROIs as marked in Fig. 6(c) were calculated by the LASCA algorithms and normalized by the inlet flow rate of for 10 consecutive perfusion maps. These 10 perfusion maps were then averaged and the normalized perfusion values were compared with the simulation results for each ROI. Figure 6(d) plots actual the blood velocity distribution normalized by the inlet velocity, which is linearly correlated with the simulation. Linear correlation is observed between the simulated and the measured blood velocities (), indicating the technical feasibility of using microchannel networks to simulate the designated microvascular networks and the resultant blood flow patterns. Correlation between the simulated and the measured blood velocities follows a regression equation of . Fig. 6Microfabricated vascular network is able to achieve the designated flow pattern in coincidence with that of the numerical simulation. (a) Photographic image of the microfabricated vascular network. The scale bar is 5 mm. (b) Blood velocity distribution in the vessel network simulated by a CFD software package. (c) Actual blood perfusion map of the vascular simulating phantom imaged by laser speckle technique. (d) Actual blood velocity distribution normalized by the inlet velocity is linearly correlated with the simulation. axis: simulated blood velocities at different levels in the vascular network. axis: actual blood velocities at the corresponding levels in the vascular network. The data are normalized by the inlet flow velocity.  3.1.2.Oxygen imaging of the phantom that simulates tumor hypoxiaFor the sandwiched phantom as shown in Fig. 2, microchannels in the upper layer and the lower layer were circulated with the chicken blood and the sodium sulfite solution, respectively. The blood in the upper layer was imaged by our multispectral imaging system as the flow rates of the blood and the sodium sulfite solution were changed at different levels. The blood levels of fresh blood and oxygen-free blood we measured with our systems were defined as 1 and 0, respectively. The blood level of the simulated blood vessel was normalized by the blood level of fresh blood and oxygen-free blood. Figures 7(a) and 7(b) plot the averaged level of the simulated blood vessel in response to the flow rate changes for the chicken blood and the sodium sulfite solution. According to Fig. 7(a), for a fixed sodium sulfite flow rate , the blood level increases as the blood flow rate increases and tend to reach the blood level of fresh blood. Meanwhile, Fig. 7(b) indicates that for a fixed blood flow rate , the blood level decreases as the sodium sulfite flow rate increases and approaches close to the blood level of oxygen-free blood. Considering that the oxygen consumption is by sodium sulfite through the dialysis membrane, this experimental result demonstrates the technical potential of simulating oxygen metabolism and vascular permeability by controlling and in the sandwiched phantom. A further increase of and reduction of (for example, and ) could simulate the hypoxic microenvironment and oxygen dynamics in solid tumor. Fig. 7Microfabricated vessel network is able to achieve the designated oxygenation levels by controlling the flow rates for blood and for sodium sulfite solution. (a) axis: the blood flow rates in the upper microchannel and axis: actual blood oxygen saturation () level of simulated blood vessel, normalized by the blood level of fresh and oxygen-free blood. (b) axis: the blood flow rates in the lower microchannel and axis: actual blood level of simulated blood vessel, normalized by the blood level of fresh and oxygen-free blood. 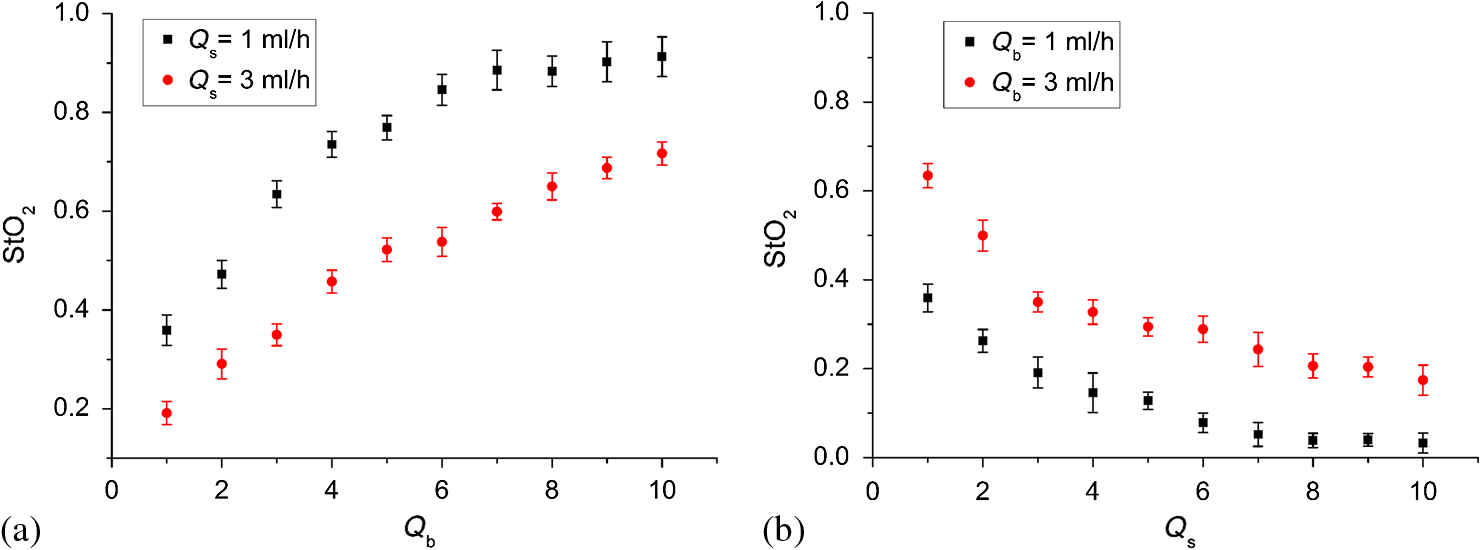 However, increasing the flow rate of the sodium sulfite solution may build up the internal pressure significantly and cause leakage of the dialysis membrane. The limiting flow rate of the existing experimental setup is . By improving the design of the sandwiched vascular phantom and optimizing the manufacturing process, it is better to simulate the extremely hypoxic tissue condition and facilitate the validation of various therapeutic strategies that overcome hypoxia-induced chemoresistance in cancer treatment. Despite the successful demonstration of the oxygenation control using the sandwiched tissue-simulating phantom, further improvement is necessary in order to realize the proposed tool, a clinically useful platform for understanding the mechanism of cancer metabolism, validating the performance of spectral imaging devices, and optimizing the techniques for anticancer drug delivery. First, the stimulated tumor hypoxia was based on a single microchannel instead of a microchannel network, owing to the difficulty to seal a large area of microchannels without leakage. It is necessary to develop a better packaging process to simulate the vascular permeability in a large tumor area. Second, the existing method of controlling the upper layer oxygenation by a lower layer flow of sodium sulfite is not the most efficient way to simulate tissue oxygen metabolism. It is technically possible to incorporate oxygen-consumption ingredients in the phantom or integrate blood vessels and oxygen-consumption vessels in one piece in order to improve the oxygenation control efficiency. Third, the blood level of the simulated blood vessel is not sufficiently accurate, which is the result of the experimental system error and oxygen calibration error. It is more accurate and efficient to measure the blood oxygenation of a simulated blood vessel with the mature commercial instrument. Finally, the current work of hypoxia simulation is still very preliminary. Quantitative analysis and numerical simulation are necessary in order to optimize the oxygen transport between the two layers for the best simulation outcome. 3.2.Simulated Blood Perfusion in Tumor VasculatureFigure 8(a) shows the microfabricated microchannel network that simulated the tortuous tumor vasculature and irregular branching. Such an irregular vascular topography leads to nonuniform and poor regional blood velocity, as simulated by the CFD software in Fig. 8(b). The actual blood perfusion pattern of the microchannel network was acquired by laser speckle contrast imaging and is shown in Fig. 8(c). An inlet flow rate of was used in both numerical simulation and experimental validation. According to the figures, the blood perfusion distribution acquired by the experiment is in agreement with that of numerical simulation. Comparison between the perfusion patterns for normal and tumor vessels at the same inlet flow rate [i.e., Fig. 6(c) versus Fig. 8(c)] indicates that the structural anomaly of tumor vasculature leads to less uniform blood perfusion, consistent with the previous observations by Dudar and Jain.42 Furthermore, the nonuniform perfusion pattern in Fig. 8(c) is able to simulate different heterogeneous regions as observed in a solid tumor.43 For example, ROI#3 has an extremely large blood perfusion that simulates the “well vascularized region” where tumor cells have a sufficient oxygen and nutrition supply for rapid proliferation.43 ROI#2 has a relatively small blood perfusion that simulates the “seminecrotic region” where the slow rates of oxygen and nutrition supply lead to hypoxic cells.43 ROI#1 has either no blood vessel or close to zero blood perfusion, simulating the “necrotic region” that leads to tissue death.43 Fig. 8Simulated and actual blood velocity distribution in the tumor vessel network. (a) Photographic image of the tumor vascular network. The scale bar is 5 mm. (b) Simulated blood velocity distribution in the tumor vessel network. (c) Actual blood perfusion map of the tumor vascular simulating phantom imaged by laser speckle technique.  Figures 9(a) and 9(b) compare the perfusion maps of the normal and the tumor vascular networks at the same inlet flow rate of . Sixteen ROIs at the lowest branch level, as marked in Fig. 9(a), are selected to calculate the averaged perfusion values of the normal vascular network. Similarly, 16 ROIs at the lowest branch level, as marked in Fig. 9(b), are selected to calculate the averaged perfusion values of the tumor vascular network. The ROIs are selected based on the designated distances to the inlets and are, therefore, reproducible for different experiments. For each ROI, the perfusion value is calculated by averaging five perfusion maps. Statistical analysis shows that the normal vascular network has a normalized perfusion of () while the normalized perfusion for the tumor vascular network is (). A significant difference exists between the normal and tumor vascular perfusion levels, with . Twelve ROIs, as marked with circles in the inlet and outlet regions of tumor vasculature, respectively, are selected for the calculation of the average perfusion values, as shown in Fig. 9(b). The criteria of selecting ROIs is the distance to the inlet and outlet. The perfusions of each the ROIs in five perfusion maps are calculated by LASCA algorithms and the average values are obtained. Twelve average perfusions of inlet and outlet ROIs in tumor vascular network are averaged and normalized. The normalized perfusion for the inlet region of tumor vascular network is (), whereas the outlet region has a normalized perfusion of (). This illustrates that perfusion is similar between the inlet region and the outlet region. Fig. 9Flow comparison between normal and tumor vasculature. (a) Actual blood perfusion map of the normal vascular simulating phantom imaged by laser speckle technique. Sixteen ROIs at the lowest branch level are selected to calculate the averaged perfusion values of a normal vascular network. (b) Actual blood perfusion map of the tumor vascular simulating phantom imaged by laser speckle technique. Seven ROIs are selected from the tumor vascular network for the calculation of the average perfusion values. All the data are normalized by the inlet blood perfusion.  Similar analysis will also enable us to validate and optimize the drug delivery strategies considering that the structural anomalies of tumor vasculature significantly affect the delivery efficacy of many anticancer therapies. 3.3.Simulated Hypoxia in Tumor VasculatureFresh chicken blood was mixed with sodium sulfite solution () at volume ratios of , , and , respectively. The mixture solution was injected to the simulated tumor vascular network by a syringe pump. At each oxygenation plateau, multispectral images were acquired. The levels of the simulated tumor vascular network were calculated by our imaging algorithm.23,39 The level of hypoxia in tumor vasculature was simulated by adjusting the volumetric ratio between blood and sodium sulfite solution. Figure 10 shows that the of the tumor vascular network decreases as the ratio of blood and sodium sulfite solution decreases. In this experiment, the oxygenation control was achieved by mixing blood with sodium hydrosulfite solution at different ratios rather than circulating sodium hydrosulfite and blood in different microchannels, as discussed earlier. One major obstacle is the difficulty of sealing the dialysis membrane between two layers of the tumor vascular network without leaking. It is our future work to integrate a dialysis membrane with tumor vascular network in order to produce microchannel networks that simulate the structural and metabolic anomalies of tumor tissue. 4.ConclusionsIn this paper, we introduced a microfluidic method to embed microchannel networks in PDMS phantoms in order to simulate tumor hypoxia and vascular anomaly. and blood flow of the simulated microvascular network were imaged by a dual-mode imaging system that integrates multispectral imaging and laser speckle imaging. The topologic differences between tumor and normal tissue vasculatures were studied and duplicated in the PDMS phantoms. Controlled mass transport and oxygen metabolism were simulated by sandwiching a dialysis membrane between two sets of microchannel networks in the upper and the lower PDMS layers. Continuous change of blood was achieved by adjusting flow rates of blood and sodium sulfite solution in the sandwiched phantom. The numerical model of a sandwiched phantom will be established to simulate oxygen metabolism to compare with experimental results measured by our system in the future. Our experiments demonstrated the technical feasibility of simulating tumor hypoxia and vascular anomalies using the proposed PDMS phantom. Such a phantom fabrication technique may be potentially used to calibrate optical imaging devices, to study the mechanisms for tumor hypoxia and angiogenesis, to optimize drug delivery strategies, and to provide a traceable standard for optical imaging applications in cancer research in the future. AcknowledgmentsThe project was partially supported by National Natural Science Foundation of China (Grant Nos. 81271527 and 81327803) and the Fundamental Research Funds for the Central Universities (Grant No. WK2090090013). ReferencesP. Vaupel, F. Kallinowski and P. Okunieff,
“Blood flow, oxygen and nutrient supply, and metabolic microenvironment of human tumors: a review,”
Cancer Res., 49
(23), 6449
–6465
(1989). Google Scholar
P. Vaupel, D. Kelleher and O. Thews,
“Modulation of tumor oxygenation,”
Int. J. Radiat. Oncol. Biol. Phys., 42
(4), 843
–848
(1998). http://dx.doi.org/10.1016/S0360-3016(98)00324-1 IOBPD3 0360-3016 Google Scholar
L. I. Cárdenas-Navia et al.,
“Tumor-dependent kinetics of partial pressure of oxygen fluctuations during air and oxygen breathing,”
Cancer Res., 64
(17), 6010
–6017
(2004). http://dx.doi.org/10.1158/0008-5472.CAN-03-0947 SCIEAS 0036-8075 Google Scholar
M. A. Chaplain,
“Mathematical modelling of angiogenesis,”
J. Neurooncol., 50
(1–2), 37
–51
(2000). http://dx.doi.org/10.1023/A:1006446020377 Google Scholar
P. Carmeliet and R. K. Jain,
“Principles and mechanisms of vessel normalization for cancer and other angiogenic diseases,”
Nat. Rev. Drug Discov., 10
(6), 417
–427
(2011). http://dx.doi.org/10.1038/nrd3455 NRDDAG 1474-1776 Google Scholar
J. R. Less et al.,
“Microvascular architecture in a mammary carcinoma: branching patterns and vessel dimensions,”
Cancer Res., 51
(1), 265
–273
(1991). Google Scholar
R. K. Jain,
“Normalization of tumor vasculature: an emerging concept in antiangiogenic therapy,”
Science, 307
(5706), 58
–62
(2005). http://dx.doi.org/10.1126/science.1104819 Google Scholar
P. Baluk, H. Hashizume and D. M. McDonald,
“Cellular abnormalities of blood vessels as targets in cancer,”
Curr. Opin. Genet. Dev., 15
(1), 102
–111
(2005). http://dx.doi.org/10.1016/j.gde.2004.12.005 COGDET 0959-437X Google Scholar
J. Nagy et al.,
“Heterogeneity of the tumor vasculature,”
Semin. Thromb. Hemost., 36
(03), 321
–331
(2010). http://dx.doi.org/10.1055/s-0030-1253454 STHMBV Google Scholar
J. A. Bertout, S. A. Patel and M. C. Simon,
“The impact of O2 availability on human cancer,”
Nat. Rev. Cancer, 8
(12), 967
–975
(2008). http://dx.doi.org/10.1038/nrc2540 NRCAC4 1474-175X Google Scholar
D. M. McDonald and P. Baluk,
“Significance of blood vessel leakiness in cancer,”
Cancer Res., 62
(18), 5381
–5385
(2002). Google Scholar
Y. Boucher, M. Leunig and R. K. Jain,
“Tumor angiogenesis and interstitial hypertension,”
Cancer Res., 56
(18), 4264
–4266
(1996). Google Scholar
D. F. Baban and L. W. Seymour,
“Control of tumour vascular permeability,”
Adv. Drug Deliv. Rev., 34
(1), 109
–119
(1998). http://dx.doi.org/10.1016/S0169-409X(98)00003-9 ADDREP 0169-409X Google Scholar
Y. H. Bae and K. Park,
“Targeted drug delivery to tumors: myths, reality and possibility,”
J. Controlled Release, 153
(3), 198
(2011). http://dx.doi.org/10.1016/j.jconrel.2011.06.001 JCREEC 0168-3659 Google Scholar
N. S. Al-Waili et al.,
“Hyperbaric oxygen and malignancies: a potential role in radiotherapy, chemotherapy, tumor surgery and phototherapy,”
Med. Sci. Monit. Basic Res., 11
(9), RA279
–RA289
(2005). Google Scholar
I. Moen et al.,
“Hyperoxia increases the uptake of 5-fluorouracil in mammary tumors independently of changes in interstitial fluid pressure and tumor stroma,”
BMC Cancer, 9
(1), 446
(2009). http://dx.doi.org/10.1186/1471-2407-9-446 BCMACL 1471-2407 Google Scholar
J. Daruwalla and C. Christophi,
“Hyperbaric oxygen therapy for malignancy: a review,”
World J. Surg., 30
(12), 2112
–2131
(2006). http://dx.doi.org/10.1007/s00268-006-0190-6 WJSUDI 0364-2313 Google Scholar
S. Chang et al.,
“Ultrasound mediated destruction of multifunctional microbubbles for image guided delivery of oxygen and drugs,”
Ultrason. Sonochem., 28 31
–38
(2016). http://dx.doi.org/10.1016/j.ultsonch.2015.06.024 Google Scholar
T. W. Secomb, R. Hsu and M. W. Dewhirst,
“Synergistic effects of hyperoxic gas breathing and reduced oxygen consumption on tumor oxygenation: a theoretical model,”
Int. J. Radiat. Oncol. Biol. Phys., 59
(2), 572
–578
(2004). http://dx.doi.org/10.1016/j.ijrobp.2004.01.039 IOBPD3 0360-3016 Google Scholar
S. R. McDougall et al.,
“Mathematical modelling of flow through vascular networks: implications for tumour-induced angiogenesis and chemotherapy strategies,”
Bull. Math. Biol., 64
(4), 673
–702
(2002). http://dx.doi.org/10.1006/bulm.2002.0293 BMTBAP 0092-8240 Google Scholar
D. A. Boas and A. K. Dunn,
“Laser speckle contrast imaging in biomedical optics,”
J. Biomed. Opt., 15
(1), 011109
(2010). http://dx.doi.org/10.1117/1.3285504 JBOPFO 1083-3668 Google Scholar
C. Stewart et al.,
“A comparison of two laser-based methods for determination of burn scar perfusion: laser Doppler versus laser speckle imaging,”
Burns, 31
(6), 744
–752
(2005). http://dx.doi.org/10.1016/j.burns.2005.04.004 BURND8 0305-4179 Google Scholar
S. Zhang et al.,
“Multimodal imaging of cutaneous wound tissue,”
J. Biomed. Opt., 20
(1), 016016
(2015). http://dx.doi.org/10.1117/1.JBO.20.1.016016 JBOPFO 1083-3668 Google Scholar
A. M. De Grand et al.,
“Tissue-like phantoms for near-infrared fluorescence imaging system assessment and the training of surgeons,”
J. Biomed. Opt., 11
(1), 014007
(2006). http://dx.doi.org/10.1117/1.2170579 JBOPFO 1083-3668 Google Scholar
A. Pifferi et al.,
“Performance assessment of photon migration instruments: the MEDPHOT protocol,”
Appl. Opt., 44
(11), 2104
–2114
(2005). http://dx.doi.org/10.1364/AO.44.002104 APOPAI 0003-6935 Google Scholar
B. W. Pogue and M. S. Patterson,
“Review of tissue simulating phantoms for optical spectroscopy, imaging and dosimetry,”
J. Biomed. Opt., 11
(4), 041102
(2006). http://dx.doi.org/10.1117/1.2335429 JBOPFO 1083-3668 Google Scholar
J. de Jong, R. G. H. Lammertink and M. Wessling,
“Membranes and microfluidics: a review,”
Lab. Chip, 6
(9), 1125
(2006). http://dx.doi.org/10.1039/b603275c LCAHAM 1473-0197 Google Scholar
D. J. Beebe, G. A. Mensing and G. M. Walker,
“Physics and applications of microfluidics in biology,”
Annu. Rev. Biomed. Eng., 4
(1), 261
–286
(2002). http://dx.doi.org/10.1146/annurev.bioeng.4.112601.125916 ARBEF7 1523-9829 Google Scholar
D. Weibel and G. Whitesides,
“Applications of microfluidics in chemical biology,”
Curr. Opin. Chem. Biol., 10
(6), 584
–591
(2006). http://dx.doi.org/10.1016/j.cbpa.2006.10.016 COCBF4 1367-5931 Google Scholar
R. Long et al.,
“Optofluidic phantom mimicking optical properties of porcine livers,”
Biomed. Opt. Express, 2
(7), 1877
–1892
(2011). http://dx.doi.org/10.1364/BOE.2.001877 BOEICL 2156-7085 Google Scholar
L. Luu et al.,
“Microfluidics based phantoms of superficial vascular network,”
Biomed. Opt. Express, 3
(6), 1350
–1364
(2012). http://dx.doi.org/10.1364/BOE.3.001350 BOEICL 2156-7085 Google Scholar
A. B. Parthasarathy et al.,
“Laser speckle contrast imaging of flow in a microfluidic device,”
Proc. SPIE, 6446 644604
(2007). http://dx.doi.org/10.1117/12.700572 PSISDG 0277-786X Google Scholar
F. P. Bolin et al.,
“Refractive index of some mammalian tissues using a fiber optic cladding method,”
Appl. Opt., 28
(12), 2297
–2303
(1989). http://dx.doi.org/10.1364/AO.28.002297 APOPAI 0003-6935 Google Scholar
G. S. Fiorini and D. T. Chiu,
“Disposable microfluidic devices: fabrication, function, and application,”
BioTechniques, 38
(3), 429
–446
(2005). http://dx.doi.org/10.2144/05383RV02 BTNQDO 0736-6205 Google Scholar
D. C. Duffy et al.,
“Rapid prototyping of microfluidic systems in poly(dimethylsiloxane),”
Anal. Chem., 70
(23), 4974
–4984
(1998). http://dx.doi.org/10.1021/ac980656z ANCHAM 0003-2700 Google Scholar
M. A. Unger et al.,
“Monolithic microfabricated valves and pumps by multilayer soft lithography,”
Science, 288
(5463), 113
–116
(2000). http://dx.doi.org/10.1126/science.288.5463.113 SCIEAS 0036-8075 Google Scholar
W. Ren et al.,
“A simultaneous multimodal imaging system for tissue functional parameters,”
Proc. SPIE, 8937 893706
(2014). http://dx.doi.org/10.1117/12.2041008 PSISDG 0277-786X Google Scholar
D. E. Myers et al.,
“Noninvasive method for measuring local hemoglobin oxygen saturation in tissue using wide gap second derivative near-infrared spectroscopy,”
J. Biomed. Opt., 10
(3), 034017
(2005). http://dx.doi.org/10.1117/1.1925250 JBOPFO 1083-3668 Google Scholar
J. Huang et al.,
“Second derivative multispectral algorithm for quantitative assessment of cutaneous tissue oxygenation,”
J. Biomed. Opt., 20
(3), 036001
(2015). http://dx.doi.org/10.1117/1.JBO.20.3.036001 JBOPFO 1083-3668 Google Scholar
K. Basak, M. Manjunatha and P. K. Dutta,
“Review of laser speckle-based analysis in medical imaging,”
Med. Biol. Eng. Comput., 50
(6), 547
–558
(2012). http://dx.doi.org/10.1007/s11517-012-0902-z MBECDY 0140-0118 Google Scholar
M. Draijer et al.,
“Review of laser speckle contrast techniques for visualizing tissue perfusion,”
Lasers Med. Sci., 24
(4), 639
–651
(2009). http://dx.doi.org/10.1007/s10103-008-0626-3 Google Scholar
T. E. Dudar and R. K. Jain,
“Differential response of normal and tumor microcirculation to hyperthermia,”
Cancer Res., 44
(2), 605
–612
(1984). Google Scholar
R. K. Jain,
“Physiological barriers to delivery of monoclonal antibodies and other macromolecules in tumors,”
Cancer Res., 50
(3 Suppl), 814s
–819s
(1990). CNREA8 0008-5472 Google Scholar
BiographyQiang Wu is PhD student at the University of Science and Technology of China. His current research interests include phantoms, microfluidics, and microbubble. He is a student member of SPIE. Wenqi Ren is a PhD student at the University of Science and Technology of China and a visiting scholar at The Ohio State University. His research interests include multimodal imaging and spectroscopy. He is a student member of SPIE. Zelin Yu is a MS student at the University of Science and Technology of China. His research interests include wound imaging and plasma therapy. Erbao Dong is an associate professor at the Department of Precision Machinery and Precision Instrumentation, University of Science and Technology of China. He has authored or coauthored more than 50 technical peer-reviewed papers. His current research interests include robotics, smart materials and structures, biological phantoms. Shiwu Zhang is an associate professor at the Department of Precision Machinery and Precision Instrumentation, University of Science and Technology of China. He has also been a visiting scholar at Department of Biomedical Engineering, The Ohio State University, USA. He has led a number of research programs sponsored by the National Science Foundation of China, Chinese Academy of Sciences, Chinese High-Tech Development Plan, and others. His research interests include biomedical optics and intelligent robot. Ronald X. Xu is an associate professor of biomedical engineering at The Ohio State University and professor of precision machinery and instrumentation at the University of Science and Technology of China. His lab developed novel micro-/nano-encapsulation techniques for controlled drug delivery and handheld imaging tools for image-guided surgery. In 2010, he was honored as one of the 10 brightest Central Ohioans by Columbus CEO Magazine. In 2011, he was awarded the TechColumbus “Inventor of the Year” Award. |


