|
|
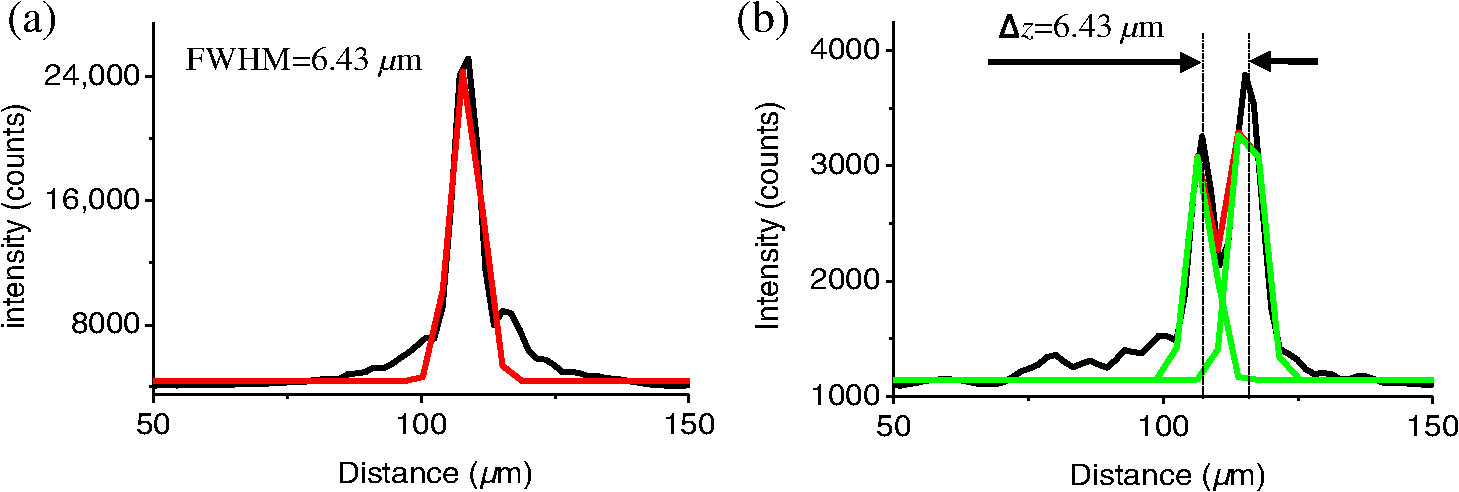
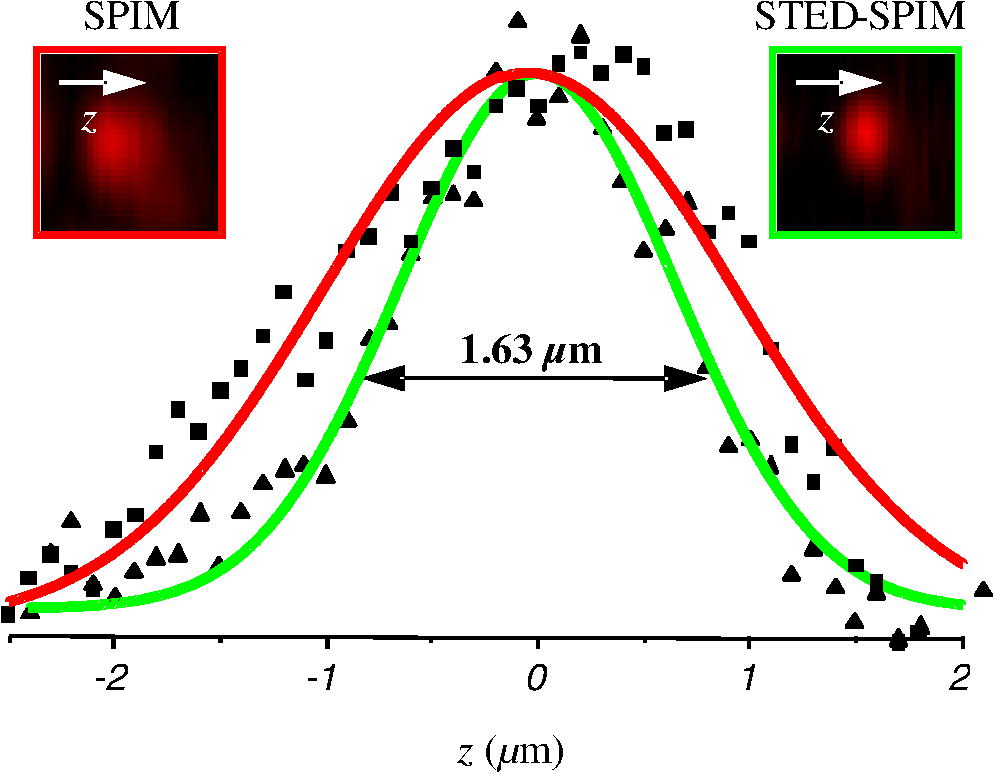
1.IntroductionFor the imaging of whole model organisms and tissues, planar (or sheet) illumination microscopy remains a top choice for subcellular resolution of complete, large specimen three-dimensional (3-D) reconstructions.1–3 Light sheet based fluorescence microscopy (LSFM) uses a separate optical excitation path orthogonal to the detection objective that limits the excitation to the focal imaging plane.1 The advantages of LSFM are high optical sectioning, imaging rates, and penetration depths with low photobleaching and scattering.1,2,4 Imaging with LSFM continuously reveals novel scientific findings in immunology, neurology, pathology, cardiology, and development.5–9 Recently, as the wealth of information increases from LSFM, advancements to LSFM, such as multiple beam and multiple view imaging, introduce improvements to distortions and artifacts inherent in LSFM.10–12 However, with the recent exception of structured illumination and line scanning sheet illumination microscopy, resolution enhancements have been limited to postprocessing of multiview imaging, which is a technique that requires much more time and effort for both acquisition and analysis and reduces the benefits of the high-speed imaging. A disadvantage of LSFM is the low image resolution despite the deep tissue penetration offered.4 This is due at least in part to the excitation field, which limits both the lateral and axial resolutions. To obtain the necessary penetration depth and field of view for the specimen, the resulting excitation field compromises the Gaussian light sheet width. In practice, a numerical aperture of 0.8 is the highest usable where the beam waist is equivalent to the depth of focus of the objective to achieve penetration of 1 mm and more.13 Our initiative is the incorporation of stimulated emission depletion (STED) light sheets to reduce the effective excitation sheet waist in an LSFM configuration.14 The successful incorporation of STED with light sheet excitation could, in principle, be added to any type of planar or light sheet microscopy to further enhance resolution. Additionally, the incorporation of STED into a light sheet microscope could also be advantageous over other types of STED microscopy. STED is a photophysical process by which the excited state electrons are induced and forced to emit a de-exciting photon by a separate incident photon. STED microscopy in its present form takes advantage of STED with the implementation of it in scanning confocal fluorescence microscopy. The implementation consists of creating the STED beam around the confocal scanning beam to make the effective fluorescence excitation area smaller, and thus, improve the resolution from the confocal microscope beyond the predicted diffraction limit of light. Configurations of STED microscopy implemented into confocal microscopes have achieved imaging resolutions of .15 Many configurations of STED microscopes exist, which allow for the implementation of fluorophore multiplexing, high-resolution imaging of live samples and even with multiphoton excitation.16–18 Incorporation of STED into a light sheet microscope does not use the excitation objective as the imaging objective. Thus, the possible resolution enhancements due to STED might be transferred to higher imaging penetration depths and also multitude higher imaging fields of view. 2.Materials and MethodsOur single sheet illumination was implemented on a commercial microscope platform via a special optical configuration and consisted of a vertical light sheet with diffraction limited beam waist of to with 640 nm excitation created by a cylindrical lens, focused in a vertical sample chamber (Fig. 1).14 Fig. 1Drawing of optical stimulated emission depletion (STED) light sheet based fluorescence microscopy (LSFM) setup (see Sec. 2 for details). Inset: configuration diagrams for the beam profile measurements. 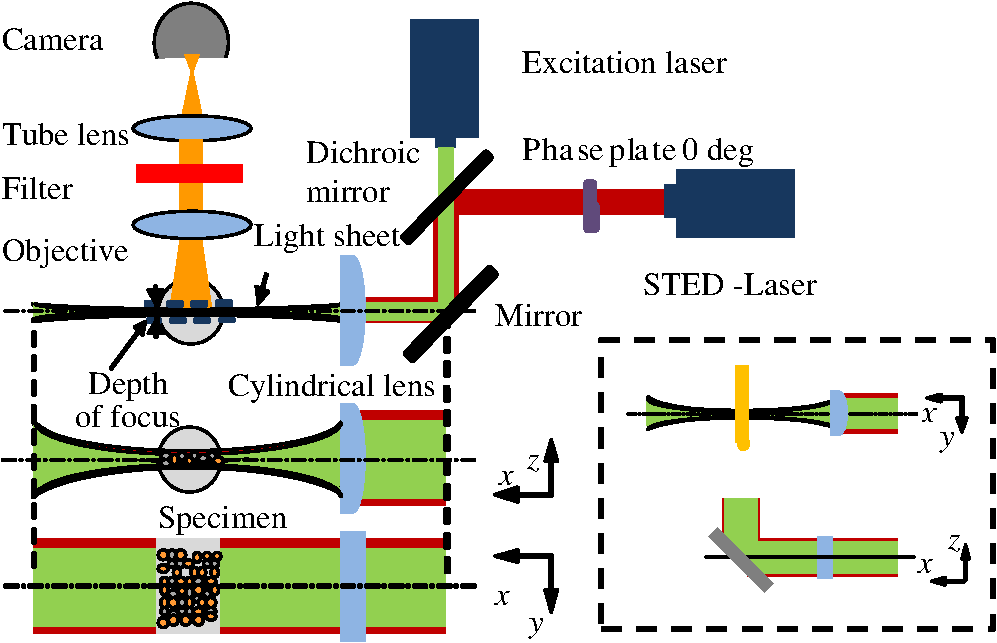 The detection pathway started orthogonally to the excitation with the excitation perfectly aligned with the focal plane of the objective, was filtered for scattered laser light, and was refocused by the tube lens in the microscope onto an electron multiplying charged-coupled device (EMCCD) camera for a total absolute detection efficiency of up to 10% (Fig. 1). With our configuration, we have detected single molecules in living organisms at penetration depths beyond 19 and have viewed whole, cleared brain tissues with penetration depths beyond 4 mm with submicrometer resolution.20 2.1.Microscope SetupThe LSFM setup maintained the essential components from the first modern reports. However, our LSFM detection is directly implemented into an inverted microscope (Axiovert 200, Zeiss, Goettingen, Germany) with the microscope objective remaining horizontal via an objective inverter (LSM Tech, Etters, Pennsylvania). The fluorescence excitation laser was a 40 mW, 640 nm cw diode pumped laser (Cube 640-40, Coherent, Santa Clara, California). The experiments were conducted on a sample stage platform next to the inverted microscope. The excitation laser beam was expanded by a telescope and into a cylindrical lens to create the laser light sheet into a home-built, water-filled sample chamber that was kept orthogonal to the imaging objective ( W Plan Apochromat 0.8 NA and a LD Achroplan 0.3 NA Zeiss, Goettingen, Germany) and directly overlapping the focus region of the microscope objective. The collected fluorescence was led over the objective inverter into the microscope. The filters, an HQ and SP 680 (Chroma, Rockingham, Vermont), were placed in the filter turret to reduce disturbing scattered light and unwanted autofluorescence. HQ is a band pass filter that effectively blocks the 640 nm excitation light, but does not entirely block the 760 nm STED beam. The SP 680 short pass filter allows a large proportion of the fluorescence light to pass, but eliminates the 760 nm STED beam completely. The image of fluorescence was visualized over the ocular and/or could be acquired with an attached EMCCD camera (Cascade II, Photometrics, Tucson, Arizona). For STED, a 532 nm 10 W laser (Verdi V-10 Coherent) was used to pump a pulsed Ti:Sa laser (Mira 900, Coherent) at a wavelength of 760 nm to deplete ATTO 647N. The laser beam was collimated with telescopic 10 cm lenses and overlapped with the aforementioned dichroic mirror with the illumination beam. The STED images would normally be much less intense due to the depletion. This might also affect image quality as the darkcount noise will also be present. To overcome this, we increased the fluorescence excitation intensity to a level of to obtain the images while still using the same exposure time as used with the non-STED images. The non-STED excitation intensity was normally . 2.2.Half-Lambda Retardation Plate (Phase Plate)Pulverized polyvinyl alcohol (PVA) (Carl Roth GmbH, Karlsruhe, Germany) and MilliQ water were mixed to make 5% (w/v) solution. The PVA solution was filtered with a syringe filter ( pore); of PVA solution was spin-coated (Spin Coater KW-4A, Chemt Technology Inc., Northridge, Canada) on rectangular cover glasses of (Hartenstein, Würzburg, Germany) at 5000 and/or 7000 rpm for 30 s, dried 1 min, and fixated under vacuum (1000 rpm). The cover glasses were afterward halved and cleaned only on the noncoated side with methanol. Both cover glass halves were again united and fixed on another cover glass with the same dimensions with quickly drying glue (Pattex, Henkel, Duesseldorf, Germany). The implementation of a stimulated emission beam on either side of the excitation beam was created by overlapping the STED laser beams with the excitation laser beam via a dichroic mirror prior to the cylindrical lens that creates the light sheet (Fig. 1). As well, the double STED beam on either side of the excitation beam was created by the insertion of a phase plate in the STED beam path creating a transverse electric and magnetic (TEM) 10 mode before the beam-combining dichroic mirror (Fig. 1). The characteristics of the excitation beam profile were tested by inserting a closed 1 mm diameter capillary glass tube (Blaubrand intraMARK, Brand, Wertheim, Germany) closed at the bottom and filled with ATTO 647N dye solution. The dye was imaged from the excitation beam with and without the STED beam, but the light sheet and the STED were assembled to invert the beam to obtain the focus beam profile from the cylindrical lens (Fig. 1 inset upper illustration). The beam was inverted by turning the cylindrical lens and phase plate by 90 deg with respect to their normal configurations (Fig. 1 inset upper illustration). The excitation profile from this test was fitted to a Gaussian function to reveal an FWHM value of [Fig. 2(a)]. Upon addition of a 0.5 W single-sided STED beam—creating a single-side depletion without the phase plate—the FWHM width of the fluorescence excitation was reduced to . With a 1.0 W TEM 10 dual-sided STED beam, the excitation beam with an original FWHM width of was reduced to [Fig. 2(d)]. The STED beam profile was also tested directly by reflecting the attenuated STED beam into the detection path. This direct beam profiling was achieved by placing a mirror at a 45 deg angle, but still with the phase plate and cylindrical lens rotated by 90 deg to the excitation path in the sample position19 (Fig. 1 inset lower illustration). Additionally, the emission filters were removed from the detection path of the microscope. In this case, the STED beam had an FWHM value of [Fig. 3(a)]. The separation of the dual STED beams [Fig. 3(b)] with TEM 10 was also and indicated that the depletion effect occurred in a distance-dependent profile, much like the profile of that observed from the S. Hell group.21,22 Fig. 2Line profile measurements of single and double side STED-LSFM. Graphs depicting the fluorescence distribution of ATTO 647N dye in solution at different conditions: (a) and (c) 90 deg rotated light sheet without STED beam, (b) with single partionally overlapping STED beam, and (d) with two enclosing STED beams. 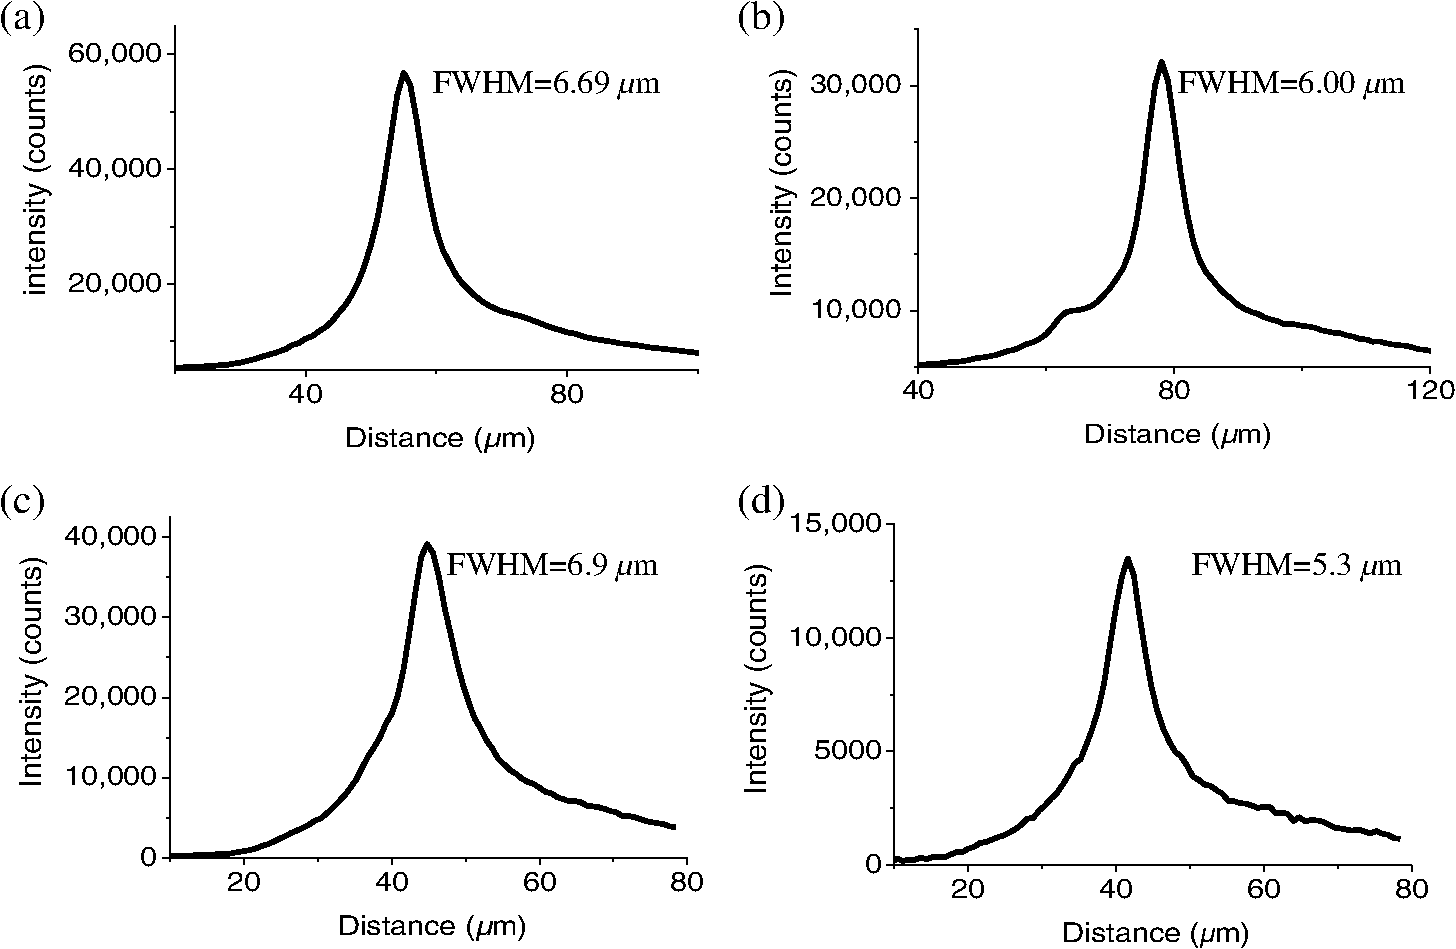 2.3.Beam Profile and Adjustment SampleFor the investigations, micro pipettes (Blaubrand intraMARK, Brand, Wertheim, Germany) were divided into 65 mm length closed-end pipettes by melting them with a Bunsen burner and merging them at one end to create a cuvette. Streptavidin conjugated ATTO 647 N (Sigma-Aldrich, Steinheim, Germany) was diluted 100-fold in sterile MilliQ (18 MOhm) water, and of this solution was transferred per cuvette. The cuvettes were finally sealed with a plug of Parafilm at the top. The storage took place at 4°C. 2.4.Labeled 40 nm BeadsA volume of of 1% agarose in phosphate buffered saline solution (PBS) was heated up to 85°C and cooled down to 45°C. 40 nm ATTO 647N labeled polystyrene nanospheres (PolySperes, Invitrogen GmbH, Karlsruhe, Germany) were diluted in PBS to a final volume of and added to the agarose followed by transferring the mixture to a 4 cm long micro pipette (Blaubrand intraMARK, Brand, Wertheim, Germany) for polymerization. 2.5.Phalloidin ATTO 647N Cell StainingHuman Embryo Kidney (HEK) 293 cells were cultured in phenol red-free dulbecco's modified eagle medium (DMEM)/10% fetal calf serum (FCS) and harvested to mix them with 2% melted agarose (45°C). The solution was transferred to a 4 cm long micro pipette (Blaubrand intraMARK, Brand, Wertheim, Germany) for polymerization followed by a 1 h incubation at 37°C. The sample was then fixed in 4% paraformaldehyde (PFA) for 1 h and washed three times for 5 min. For permeabilization, the fixed cells were incubated in 0.5% Triton-X100 in PBS for 1 h, followed by three wash steps for 5 min. Permeabilized cells were transferred to a blocking solution containing 10% bovine serum albumin (Sigma-Aldrich) in PBS with 0.1% Triton-X100 for 1 h. Phalloidin ATTO 647N was diluted in PBS with 10% bovine serum albumin for staining. Cells were incubated overnight at 4°C in this staining solution and washed three times. 2.6.Analyses of Beam ProfileThe analysis of the beam profiles took place with the WCIF ImageJ software collection (WRIGHT Cell Imaging Facility, Toronto, Canada). After loading the images, a straight line selection perpendicular to the beam line was created and a plot profile was computed, which was exported afterward as a data table. This file was read in Origin and plotted out. Subsequently, a fit to a Gauss-shaped curve took place to determine the curve parameters. 2.7.Analyses of Resolution along the AxesThe image stacks of 16 bit data were read in and scaled in WCIF ImageJ. After conversion into 8 bits, a 3-D reconstruction was performed while turning the stack around the axis in steps of 10 deg (36 images). The reconstructed image at the rotation angle of 90 deg (image number 10) was selected and a straight line region of interest (ROI) specified. Along this ROI, a plot profile of the image structure was created, stored, and exported as a data table. These data tables were read in Origin and plotted out. Subsequently, a fit to a Gauss-shaped curve took place to determinate the curve parameters. 3.ResultsAs previously stated, our initiative was for the creation, implementation, and description of the addition of STED to enhance the resolution to the planar illumination microscope.14 Even though the configuration of the STED implementation is different than the originally reported versions,15–18 the essential performance of this implementation should still mimic the original reports. Thus, the effective axial fluorescence sheet width should also be dependent on the intensity, and only through an intensity-dependent study will we be able to determine the effective minimum axial resolution and effective fluorescence excitation sheet width. Previously, we reported a tested minimum resolution value of with of total STED beam power from the dual-sheet STED configuration with 40 nm fluorescent beads and from imaging with a 0.8 NA objective.14 With this same control experiment, we further tested two concepts: first, what is the STED beam intensity dependence of depletion and resolution and second, what resolution improvement is acquired with lower numerical aperture and magnification objectives. To determine the STED beam intensity dependence, the same regions of well-separated 40 nm beads were successively imaged first without an STED beam and then with increasing STED beam power from 150 up to 1800 mW (Fig. 4). We note that the STED power is ostensibly very high, but will also note that the STED beam used here is in the infrared region, which causes lower possible photodamage, and that the overall intensity () used in the STED beams is still less than STED reports (peak intensity of 0.4 to )15–18,23 and is less than multiphoton fluorescence reports (peak intensity of ),24 which indicate little to no short-term or long-term damage to biological specimens. As the STED beam power increased, the individual 40 nm beads responded with a reduction in imaged fluorescence width with axial scanned images, but with a slight variation in widths. The STED images would normally be much less intense due to the depletion. To overcome this, we increased the fluorescence excitation intensity to obtain the images while still using the same exposure time as used with the non-STED images. The effect of depletion was then determined for the same 40 nm fluorescent beads for each STED power by width analysis of one-dimensional Gaussian fittings of line analysis through a fluorescent bead or by two-dimensional Gaussian fitting directly on a fluorescent bead, resulting in nearly the same widths (Fig. 5 and Sec. 2). The depletion was then determined for each bead by subtracting the width under STED conditions at an intensity from the width without STED and divided or normalized again from the width determined without STED. The mean and standard error were then determined for the depletion and resolution of all points and graphed depicting the intensity dependence (Fig. 6). Please note here that Fig. 5 depicts individual measurements and that Fig. 6 depicts the mean and standard error of an ensemble of bead measurements. The theory behind such an intensity-dependent effect has been well laid out by the S. Hell group and results in a saturation dependence from the STED beam power.23 As observed by our graphs in Fig. 2, the depletion was evident with a saturation value of and with a maximum depletion of and an average resolution of . Thus, under the given conditions, in comparison to conventional fluorescence microscopy, which has, under the given conditions (0.8 NA and ), an axial resolution of , our STED-LSFM setup allows for a factor of two resolution enhancement but with only a maximum of 80% depletion. As well, the saturation value allows comparison of depletion saturation power to excitation power ratio of in comparison to previously reported values with confocal STED microscopy of .25Fig. 4(lateral) images (left) and analysis (right) of the depletion of ATTO 647N labeled polystyrene nanospheres with different STED power levels. (a) Images without STED (left) and with 1551 mW STED (middle) with one-dimensional (1-D) Gaussian fit of selected nanospheres without STED (solid lines) and with STED (dashed lines). (b) Images without STED (left) and with 1034 mW STED (middle) with 1-D Gaussian fit of selected nanospheres without STED (solid lines) and with STED (dashed lines). (c) Images without STED (left) and with 259 mW STED (middle) with 1-D Gaussian fit of selected nanospheres without STED (solid lines) and with STED (dashed lines). 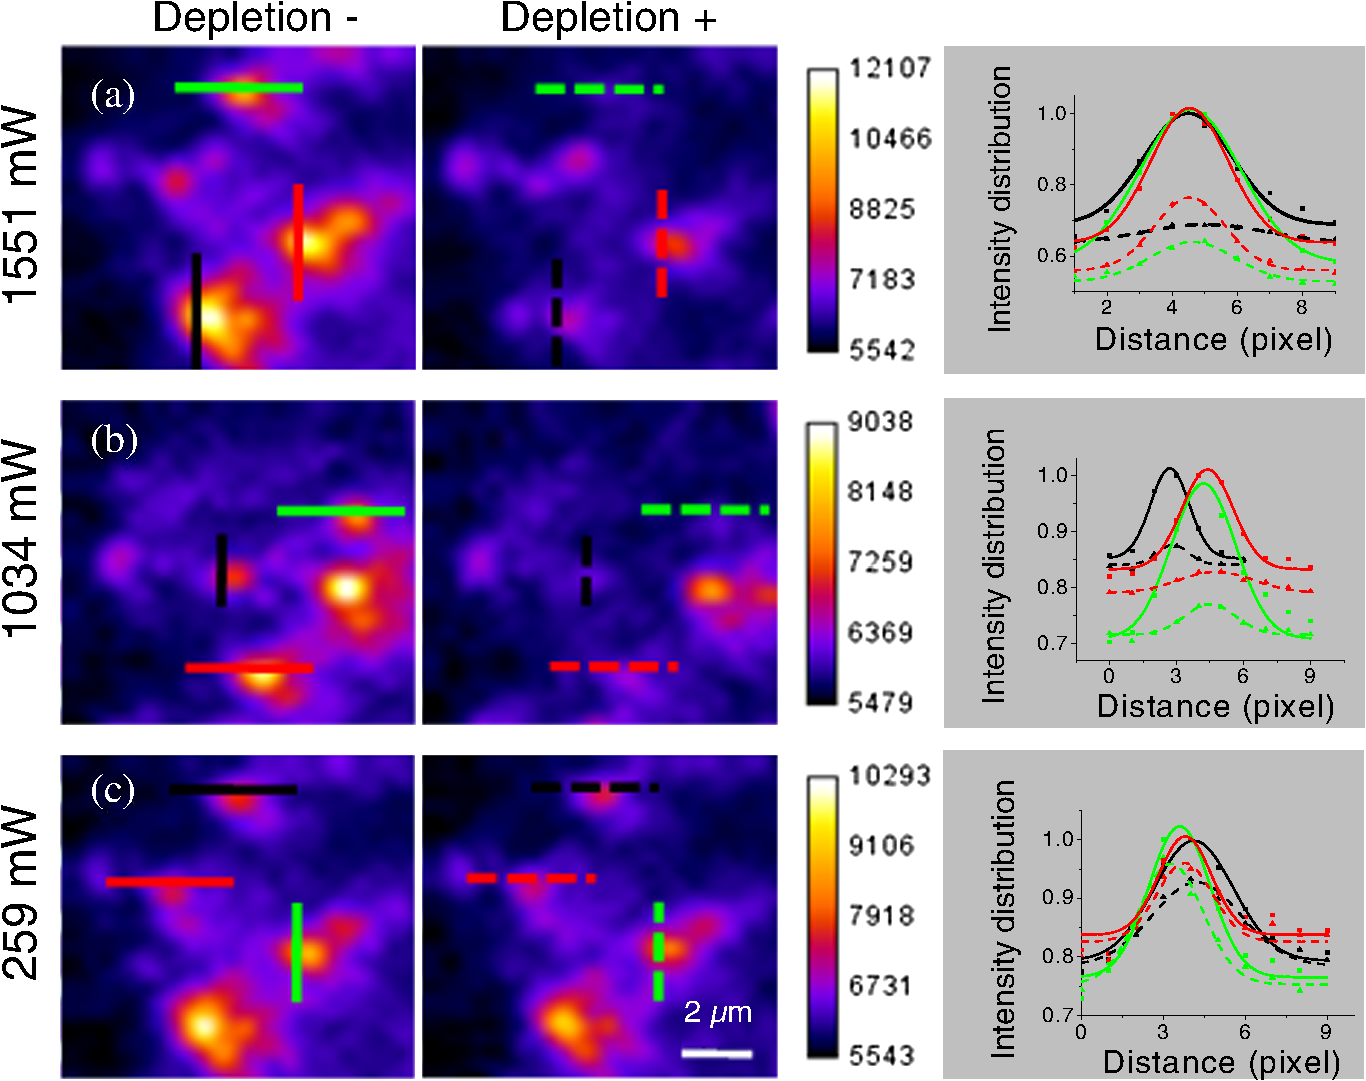 Fig. 5Line profile measurements of imaged ATTO 647N labeled polystyrene nanospheres with LSFM and STED-LSFM with , 0.3 NA objective. Lateral images of the 40 nm ATTO 647N spheres (a) without and (b) with STED revealed a improved resolution from (f) 1-D Gaussian fitting. (e) The average of the lateral resolution of all of the beads from without STED and with STED. Axial images of the same spheres (c) without and (d) with STED revealed a (or ) resolution enhancement in (g) 1-D Gaussian fitting. 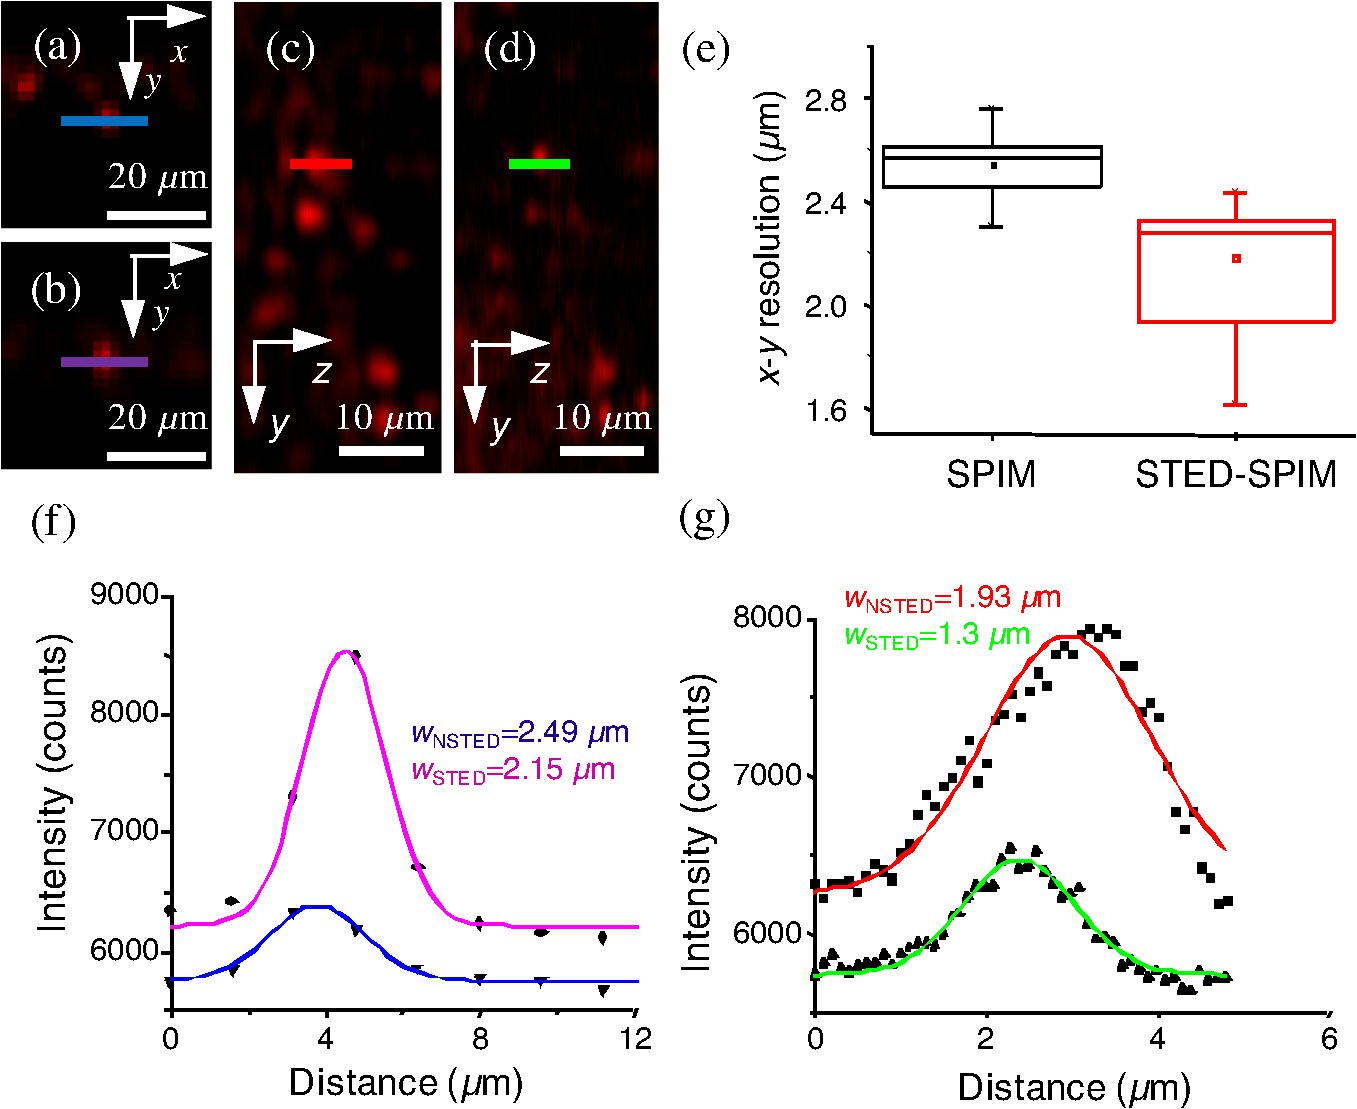 Fig. 6Depletion behavior of 40 nm ATTO 647N labeled polystyrene nanospheres. (a) Depletion level at different STED intensities. A fit to a saturation curve reveals a saturation intensity of 600 mW. (b) Axial resolution versus depletion intensity with a fitted saturation intensity of 700 mW. 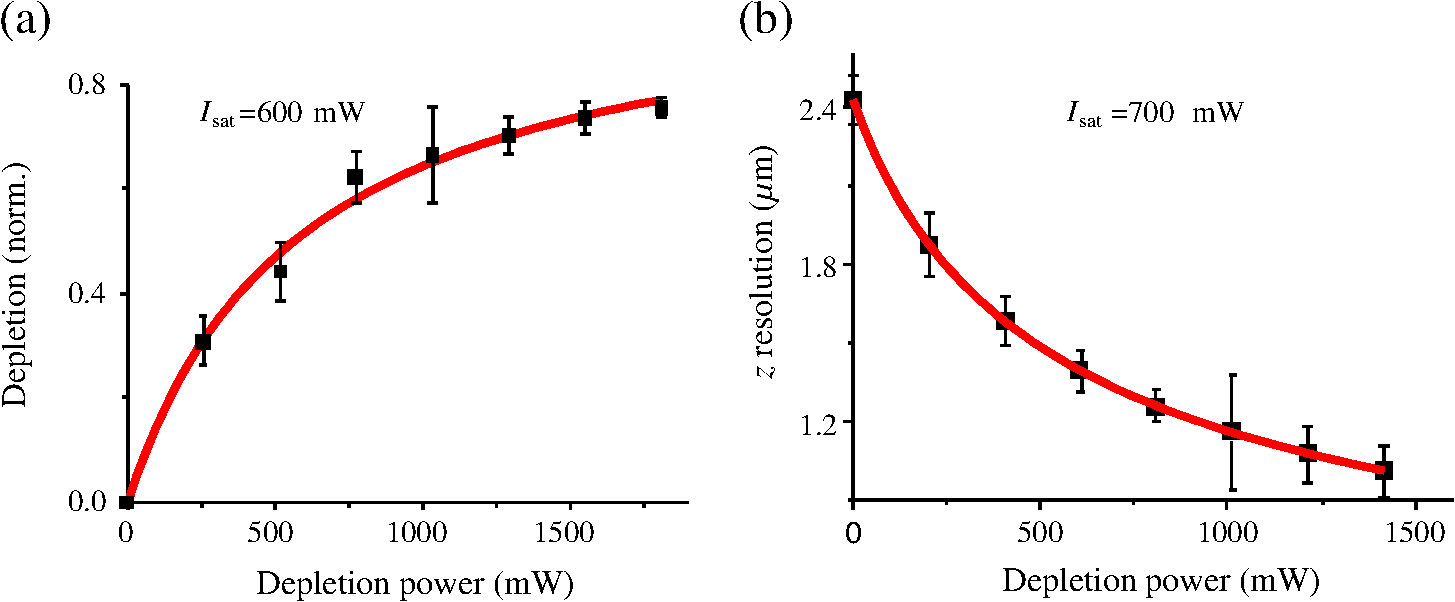 As previously stated, a distinct advantage of LSFM is the fast and relative high resolution acquisition of a wide field of view and with deep sample penetration. With our STED-LSFM setup (see Materials and Methods), the widest possible field (using a 0.8 NA objective) of view is limited to (0.5 mm), and the maximum depth is limited to 3 mm. Thus, we wanted to test this application to observe if resolution enhancements could be observed with a lower numerical aperture and magnification objective, but with a larger field of view and penetration depth or working distance. Prior to application of the STED beam, an LSFM image of well-dispersed 40 nm fluorescent beads was acquired with a 0.3 NA objective (Fig. 6). LSFM comparatively has been shown to already possess a factor of two improved axial resolution in comparison to the calculated axial resolution limit of conventional fluorescence microscopy of . Our analysis is in agreement with the calculated value (Fig. 5). However, upon application of the STED beam to the same sample region, a further axial resolution improvement could be observed (Fig. 7), up to or to as low values as between 1.3 and , meaning 2.4- to 3.5-fold better theoretical limit. We also note that there were lateral resolution enhancements () [Figs. 5(a), 5(b), 5(e), and 5(f)], which, on average, improved from without STED to with STED, but these enhancements never surpassed the diffraction limit of the emission wavelength of . We interpret this as we did previously14 to be just a contrast improvement due to the thinner excitation sheet. The fact that the lateral resolution was not improved beyond the diffraction limit from techniques to reduce the axial focal depth can be shown by understanding that the lateral resolution, , has a dependence on the axial position, , from the focal plane approximately following the equation where (with NA being the numerical aperture) and is the fluorescence emission maximum wavelength.26,27 For the depth of focus, the value of is determined in the equation where .26,27 However, as in our case, as gets smaller, .4.Discussion and ConclusionThe resolution improvements which were obtained here as a result of our investigational goal of implementing, characterizing, and switching imaging objectives in planar illumination microscopy with STED incorporated into it, could have far-reaching consequences for improved resolution for imaging of a whole live developing embryo in the early stages or for whole, fixed and cleared organs or tissues from larger specimens.20 Although the technique of using Bessel beams has been shown to dramatically improve resolution with sheet illumination,28,29 it has not been shown to be effective either with fluorescence at penetration depths much beyond or only with scattering but lower resolution at more significant penetration depths. Previously, we have shown our STED-LSFM to be successful for penetration depths beyond and with a axial resolution improvement. Furthermore, this could also be used for the imaging of cells30 where cultured cells in agarose can still be shown to exhibit a resolution improvement (Fig. 8). Previous reports for the confocal versions with STED exhibit resolution improvements that exceed our measurements by multiple-fold. Three reasons for this are as follows: (1) The previous reports of confocal STED were built for penetration depths of up to , whereas our instrument has penetration depths that go beyond . Such penetration depths can cause larger distortions in the control of the mode of the depletion beam, which in turn make it more difficult to obtain ideal results as previously published.15–18 (2) The previous reports of confocal STED15–18also use improved means of light modulation via improved phase plates and spatial light modulators. (3) The previous reports15–18 are also able to implement higher STED beam intensities as their methods used excitation powers on the order as used in this manuscript, but multiple-fold smaller excitation beams due to the confocal nature of their experiments. Fig. 8Immunofluorescence imaging with phalloidin-ATTO 647N stained HEK cells. (a) Comparison of LSFM image and (b) 1-D Gaussian fit analyses from indicated regions (blue, green, and orange) in (a), and (c) STED-LSFM images with STED and (d) 1-D Gaussian line analysis from indicated regions (blue, green, and orange) in (c). The analysis reveals an axial resolution improvement of with STED.  We have demonstrated two important features of our incorporation of STED into a planar illumination microscope: the initial limits and that one can use various imaging objectives to still obtain axial resolution beyond the diffraction limit. The introduction of STED into LSFM remains an interesting alternative for high-resolution imaging of large tissues by either live cell methods with fluorescent proteins31 and STED with the red fluorescent protein (RFP) 32 or with fixed and cleared tissues20,33 and avoids histological sectioning, which causes significant artifacts. We hope to make further improvements by incorporating a scanning STED-LSFM beam and with better phase modulation optics, which together will possibly allow for greater depletion and higher resolution, and also by incorporating a smaller-pixel large-area CCD camera. At this time, STED-LSFM remains to be a successful method for the fast, high-resolution imaging of large tissues and specimen. AcknowledgmentsWe thank Revaz Nozadze for assistance with the optical assembly and Ernst Stelzer and Francesco Pampaloni for critical comments regarding the original planar illumination setup. This work was supported by the German Research Foundation (DFG), Grant FZ-82, GK1048, and GK1342; by the Bavarian Ministry of Education and Research for the Bio-Imaging Center, by grants from the Northeastern Pennsylvania Technology Institute, and by a grant from the Howard Hughes Medical Institute. ReferencesJ. Huisken et al.,
“Optical sectioning deep inside live embryos by selective plane illumination microscopy,”
Science, 305
(5686), 1007
–1009
(2004). http://dx.doi.org/10.1126/science.1100035 SCIEAS 0036-8075 Google Scholar
P. J. Keller, F. Pampaloni and E. H. Stelzer,
“Life sciences require the third dimension,”
Curr. Opin. Cell Biol., 18
(1), 117
–124
(2006). http://dx.doi.org/10.1016/j.ceb.2005.12.012 Google Scholar
A. H. Voie, D. H. Burns and F. A. Spelman,
“Orthogonal-plane fluorescence optical sectioning: three-dimensional imaging of macroscopic biological specimens,”
J. Microsc., 170
(Pt 3), 229
–236
(1993). http://dx.doi.org/10.1111/j.1365-2818.1993.tb03346.x Google Scholar
V. Ntziachristos,
“Going deeper than microscopy: the optical imaging frontier in biology,”
Nat. Methods, 7
(8), 603
–614
(2010). http://dx.doi.org/10.1038/nmeth.1483 Google Scholar
A. B. Arrenberg et al.,
“Optogenetic control of cardiac function,”
Science, 330
(6006), 971
–974
(2010). http://dx.doi.org/10.1126/science.1195929 SCIEAS 0036-8075 Google Scholar
C. Brede et al.,
“Mapping immune processes in intact tissues at cellular resolution,”
J. Clin. Invest., 122
(12), 4439
–4446
(2012). http://dx.doi.org/10.1172/JCI65100 Google Scholar
A. Erturk et al.,
“Three-dimensional imaging of the unsectioned adult spinal cord to assess axon regeneration and glial responses after injury,”
Nat. Med., 18
(1), 166
–171
(2011). http://dx.doi.org/10.1038/nm.2600 Google Scholar
P. J. Keller et al.,
“Reconstruction of zebrafish early embryonic development by scanned light sheet microscopy,”
Science, 322
(5904), 1065
–1069
(2008). http://dx.doi.org/10.1126/science.1162493 SCIEAS 0036-8075 Google Scholar
P. A. Santi,
“Light sheet fluorescence microscopy: a review,”
J. Histochem. Cytochem., 59
(2), 129
–138
(2011). http://dx.doi.org/10.1369/0022155410394857 Google Scholar
U. Krzic et al.,
“Multiview light-sheet microscope for rapid in toto imaging,”
Nat. Methods, 9
(7), 730
–733
(2012). http://dx.doi.org/10.1038/nmeth.2064 Google Scholar
R. Tomer et al.,
“Quantitative high-speed imaging of entire developing embryos with simultaneous multiview light-sheet microscopy,”
Nat. Methods, 9
(7), 755
–763
(2012). http://dx.doi.org/10.1038/nmeth.2062 Google Scholar
M. Weber and J. Huisken,
“Light sheet microscopy for real-time developmental biology,”
Curr. Opin. Genet. Dev., 21
(5), 566
–572
(2011). http://dx.doi.org/10.1016/j.gde.2011.09.009 Google Scholar
C. J. Engelbrecht and E. H. Stelzer,
“Resolution enhancement in a light-sheet-based microscope (SPIM),”
Opt. Lett., 31
(10), 1477
–1479
(2006). http://dx.doi.org/10.1364/OL.31.001477 Google Scholar
M. Friedrich et al.,
“STED-SPIM: stimulated emission depletion improves sheet illumination microscopy resolution,”
Biophys. J., 100
(8), L43
–45
(2011). http://dx.doi.org/10.1016/j.bpj.2010.12.3748 Google Scholar
E. Rittweger et al.,
“STED microscopy reveals crystal colour centres with nanometric resolution,”
Nat. Photonics, 3
(3), 144
–147
(2009). http://dx.doi.org/10.1038/nphoton.2009.2 Google Scholar
G. Donnert et al.,
“Two-color far-field fluorescence nanoscopy,”
Biophys. J., 92
(8), L67
–69
(2007). http://dx.doi.org/10.1529/biophysj.107.104497 Google Scholar
T. A. Klar et al.,
“Fluorescence microscopy with diffraction resolution barrier broken by stimulated emission,”
Proc. Natl. Acad. Sci., 97
(15), 8206
–8210
(2000). http://dx.doi.org/10.1073/pnas.97.15.8206 Google Scholar
G. Moneron and S. W. Hell,
“Two-photon excitation STED microscopy,”
Opt. Express, 17
(17), 14567
–14573
(2009). http://dx.doi.org/10.1364/OE.17.014567 Google Scholar
M. Friedrich et al.,
“Detection of single quantum dots in model organisms with sheet illumination microscopy,”
Biochem. Biophys. Res. Commun., 390
(3), 722
–727
(2009). http://dx.doi.org/10.1016/j.bbrc.2009.10.036 Google Scholar
V. Ermolayev et al.,
“Ultramicroscopy reveals axonal transport impairments in cortical motor neurons at prion disease,”
Biophys. J., 96
(8), 3390
–3398
(2009). http://dx.doi.org/10.1016/j.bpj.2009.01.032 Google Scholar
S. W. Hell, M. Dyba and S. Jakobs,
“Concepts for nanoscale resolution in fluorescence microscopy,”
Curr. Opin. Neurobiol., 14
(5), 599
–609
(2004). http://dx.doi.org/10.1016/j.conb.2004.08.015 Google Scholar
B. Harke et al.,
“Resolution scaling in STED microscopy,”
Opt. Express, 16
(6), 4154
–4162
(2008). http://dx.doi.org/10.1364/OE.16.004154 OPEXFF 1094-4087 Google Scholar
V. Westphal and S. W. Hell,
“Nanoscale resolution in the focal plane of an optical microscope,”
Phys. Rev. Lett., 94
(14), 143903
(2005). http://dx.doi.org/10.1103/PhysRevLett.94.143903 Google Scholar
K. Konig,
“Multiphoton microscopy in life sciences,”
J. Microsc., 200
(Pt 2), 83
–104
(2000). http://dx.doi.org/10.1046/j.1365-2818.2000.00738.x Google Scholar
K. I. Willig et al.,
“STED microscopy with continuous wave beams,”
Nat. Methods, 4
(11), 915
–918
(2007). http://dx.doi.org/10.1038/nmeth1108 Google Scholar
M. Born, E. Wolf and A. B. Bhatia, Principles of Optics: Electromagnetic Theory of Propagation, Interference and Diffraction of Light, Pergamon Press, Oxford
(1970). Google Scholar
E. Hecht, Optics, Addison-Wesley, San Francisco
(2002). Google Scholar
F. O. Fahrbach and A. Rohrbach,
“A line scanned light-sheet microscope with phase shaped self-reconstructing beams,”
Opt. Express, 18
(23), 24229
–24244
(2010). http://dx.doi.org/10.1364/OE.18.024229 Google Scholar
T. A. Planchon et al.,
“Rapid three-dimensional isotropic imaging of living cells using Bessel beam plane illumination,”
Nat. Methods, 8
(5), 417
–423
(2011). http://dx.doi.org/10.1038/nmeth.1586 Google Scholar
P. J. Verveer et al.,
“High-resolution three-dimensional imaging of large specimens with light sheet-based microscopy,”
Nat. Methods, 4
(4), 311
–313
(2007). http://dx.doi.org/10.1038/nmeth1017 Google Scholar
K. I. Willig et al.,
“Nanoscale resolution in GFP-based microscopy,”
Nat. Methods, 3
(9), 721
–723
(2006). http://dx.doi.org/10.1038/nmeth922 Google Scholar
K. S. Morozova et al.,
“Far-red fluorescent protein excitable with red lasers for flow cytometry and superresolution STED nanoscopy,”
Biophys. J., 99
(2), L13
–15
(2010). http://dx.doi.org/10.1016/j.bpj.2010.04.025 Google Scholar
H. U. Dodt et al.,
“Ultramicroscopy: three-dimensional visualization of neuronal networks in the whole mouse brain,”
Nat. Methods, 4
(4), 331
–336
(2007). http://dx.doi.org/10.1038/nmeth1036 Google Scholar
BiographyMike Friedrich is both a doctoral candidate in physics and also on the staff of the Bio-Imaging Center at the Rudolf Virchow Center at the University of Würzburg, Germany. He received his BS and MS degrees in electrical engineering at the Technical University of Ilmenau, Germany, in 2008. He is the author of 10 journal papers. His current research interests include sheet illumination microscopy and fluorescence microscopy. Gregory S. Harms is an associate professor of biology, bioengineering, engineering, and physics at Wilkes University and, prior to this, at the University of Würzburg, Germany. He received his PhD at the University of Kansas in 1998. He is the author of more than 60 journal papers and book chapters. His current research interests include fluorescence microscopy, sheet illumination microscopy, single-molecule biophysics, polarization optics as well as scientific topics in biology and biomedicine. |