
|
|
1.IntroductionIn the development of biomedical imaging and diffuse optical spectroscopy, a test medium for the verification of measurement modalities is crucial. The test medium is often an attempt to mimic human tissue. In this study, we call all media with controlled optical properties a phantom. In the literature, very different phantoms can be found. Except for paraffin wax,1 most of them have one thing in common: scatterers and absorbers are added to an almost transparent matrix. The matrix material defines properties such as durability, stability, elasticity, and hardness as well as simplicity and price in the manufacturing process. Furthermore, the refractive index (RI) is also mainly defined by the matrix material. In biomedical optics, Intralipid is the most commonly used phantom. However, our group has very recently shown that the formation of a strongly scattering surface layer impairs the phantoms’ homogeneity.2 Even though Intralipid is a very important and easy to use phantom, as a liquid it is not suitable for all applications. Another phantom material is agarose dissolved in water. It can be used to fix water-based phantoms and is reported to be easy to handle.3,4 Phantoms based on PVA gel5,6 or silicone7–12 can also mimic mechanical properties of tissue and are useful for hybrid methods (such as optomechanical techniques). Phantoms based on epoxy, polyester, or polyurethane resin consist of two components that cure to a solid and machinable body.13–20 Silicone and polymer phantoms are very durable and allow more difficult forms and heterogeneous structures by casting in successive steps. The review of Pogue and Patterson21 stated the importance of hybrid phantoms. An example was fabricated by Cooper et al.,19 who included copper wires to simulate the electrical conductivity in a phantom for simultaneous recording of an electroencephalogram and near-infrared (NIR) imaging. Sukovski et al. measured the dispersion of the RI of polyester phantoms16 and Moffitt et al. examined the phantoms with small absorption bands.18 For optical coherence tomography (OCT), the important optical properties are the attenuation coefficient and the backscattering intensity. The latter depends on the numerical aperture of the imaging system and the scattering phase function of the scattering particles.22 However, the scattering phase function is often not thoroughly investigated. For multiple scattering, it can be described in low order by the anisotropy value and the parameter . The latter has recently gained much attention23,24 since it allows to obtain structural information in vivo such as the typical size of the scatterers from multiple scattering experiments.25 All the above-mentioned groups studied and sought to optimize particular phantom properties. Our goal is to present all said optical properties for a single epoxy-resin-based optical phantom system. At first, we describe a detailed recipe for casting optical phantoms in Sec. 2. In Sec. 3, we briefly present our measurement methodologies. In Sec. 4, we show the spectra of optical properties of the transparent epoxy resin matrix material. The dispersion of the RI is presented alongside that of ethyl cinnamate used in this study as the index matching fluid. Furthermore, we show in Sec. 5 how to combine titanium dioxide () and aluminium oxide () to control the anisotropy value and the phase function related parameter over a wide range. Additionally, we present the absorption spectra of seven pigments to control the phantom’s absorption properties (Sec. 6). 2.Materials and RecipeBoth components of the chosen epoxy system, resin (“Crystal Resin Giessharz glasklar”) and hardener (“Epohard klar”), are produced by SuK Hock GmbH (Regen, Germany). The dispersion (“LARIT reinweiss”) is distributed by Lange+Ritter GmbH (Gerlingen, Germany). The powder (“CT530SG”, Almatix, Frankfurt, Germany) is provided by Bassermann minerals GmbH & Co.KG (Mannheim, Germany) and all of the other described pigments can be bought at Kremer Pigmente GmbH (Aichstetten, Germany). In the following section, we provide detailed instructions for the manufacturing of epoxy phantoms which are summarized in Fig. 1. In the following, we will refer to the dispersion as white pigment paste (WPP), which we add to achieve the contribution to the reduced scattering coefficient (see Sec. 5). An arbitrary pigment (ABS) with absorption spectrum is added to the matrix material to adjust its absorption characteristics (see Sec. 6). Casting phantoms with other or more than one absorption and scattering agent is carried out in the same way. All concentrations are given as weight concentrations. Please note that this is an approximation valid only for small amounts of additives. Fig. 1Flow chart for the fabrication of the presented optical phantoms. Variables are described in the text, white pigment paste (WPP) denotes the white titanium dioxide () pigment paste.  First, the desired optical properties and have to be chosen at a single wavelength . The absorber is often used to affect a whole part of the spectrum, but the consideration of one wavelength is still sufficient. The concentrations and of the scattering and absorption additives can be calculated based on the desired optical properties: where and denote the reduced scattering and absorption coefficients, divided by the weight concentration of the scattering and absorbing agents, respectively. If light propagation similar to that of biological tissue is aimed for (, ), the amount of WPP and ABS is typically in the order of 100 mg per 400 g phantom mass. Single droplets of WPP have , so it is hardly possible to achieve the desired amount in the weighing process. This problem is solved by preparation of stock dispersions of WPP and ABS in hardener. Furthermore, due to the hardener’s low viscosity, strong ultrasound treatment for about 10 min helps to prevent the agglomeration of scattering particles. When using resin instead of hardener for the stock dispersions, we could not achieve the same dispersion quality. We use the following equations to calculate the masses of the different ingredients.In these equations, denotes the expected total mass of the phantom and the index “dis” corresponds to stock dispersions. The instructed mass fractions of hardener and resin are and , respectively. The amount of hardener is corrected by the part already added with the stock dispersions. When holds true, a total mass is sufficient to cast a phantom for which boundary effects may be neglected for measurements in the phantom’s central region. This is even valid for time-resolved experiments with times up to about three nanoseconds. After these calculation steps, the mixing procedure starts. A 500-ml propylene beaker serves as the mixing container. At first, we add of the stock dispersion of WPP to of the epoxy resin. For higher precision, we use a pharmaceutical scale with accuracy to weigh the stock dispersion’s residual mass after taking out the part for the phantom. This procedure is repeated with of the stock dispersion of ABS. At the end, we add of hardener. When working with hardener, mixing under the fume hood is recommended. The homogenization is the next step. For this purpose, we use a commercial hand mixer (MFQ3530, Bosch, Germany) for at least 10 min and if the mixing beaker has edges, additional stirring in these edges using a spattle is necessary. Afterward, the suspension is filled into another container for the curing process. At this point, the phantom should have a completely homogeneous appearance to the naked eye. We then leave the phantom under the fume hood for hardening. After 3 days, the phantom is solid but has not yet reached its final hardness. It is taken out of the container and a lathe is used to remove a top layer and a bottom layer and some of the boundary to enhance the flatness and to remove potential inhomogeneities or impurities. The phantom is now flat and sandpaper is used to enhance the surface quality. We use sandpaper with ISO Grit designations P180, P400, P600, P1200, and P2500. If required, grinding with sandpaper with P4000 can be applied afterward for the surface to have optical quality; however, due to the low hardness, it is hardly possible to obtain it free of scratches. At the end, the phantom is labeled with a unique identifier. The described epoxy resin phantom has robust mechanical properties. It has a Mohs hardness of 3 and is highly impact resistant. Since the hardener has a low viscosity, particles can be well dispersed using ultrasound and stirring. Neither the used resin nor hardener contain solvents. The long hardening time has various advantages. First, it allows air bubbles created through the mixing process to rise without the need for vacuum treatment. Second, no additional precautions for phantom cooling are necessary to compensate for the exothermic reaction even for large phantom volumes. The disadvantage is the longer time available for large and highly dense particles to sink down as well as an agglomeration as observed for the WPP at higher concentrations. When implementing large and high density particles, it is recommended to mix resin and hardener several hours before including them. A further discussion can be found in Sec. 6.1. 3.Measurement ModalitiesThis section describes the measurement modalities used for analysis of the different optical parameters. To keep this section brief, references to the literature are given where possible. The results of the optical properties and obtained by several independent techniques are given. In particular, we make use of the time-resolved reflectance,26 spatial frequency domain reflectance,2 spatially resolved reflectance (SRR), and diffuse total reflectance27 (ToR). In the latter, we added an NIR spectrometer (B&W Tek BTC261E, Newark, Delaware) to extend the spectral range from 450–1000 nm to 450–1700 nm.28 The setup for measuring the intrinsic absorption of epoxy is described below. For the determination of , we measure the collimated transmission of samples with low concentrations of the dispersion or the powder or without any added agents. These samples are cylinders made of epoxy resin with different lengths between 5 mm and 75 mm. At each end, a cover glass is attached using a droplet of the same epoxy as adhesive to ensure equal optical surfaces on all cylinders ends. Two reference cylinders are made of a drop of resin squeezed by two pieces of cover glass. For the determination of the extinction coefficient , data analysis is carried out using Beer–Lambert law , where denotes the detection intensity of the sample divided by that of the reference. We then subtract the matrix material’s absorption value (see below) to find . Note that a small acceptance angle of 3 arcmin is necessary to avoid detection of the strongly forward-oriented scattering of the epoxy resin. The scattering phase function was determined as follows. An optimized goniometer described by Foschum and Kienle29 was modified to measure the angularly resolved scattering intensity in a plane from 10 deg to 170 deg of liquid emulsions or suspensions in the wavelength region from 400 to 900 nm (to be published). For verification, monodisperse polystyrene spheres suspensions were measured and found to be in agreement with Mie theory (not shown). Because of the random orientation of the scatterers and the unpolarized incident beam, the phase function only depends on the angle to the incident beam. For calculating the Legendre moments , the complete phase function is needed. Therefore, the first and last 10 deg which could not be measured were extrapolated using a fit based on a Reynolds-McCormick phase function and a second-order polynomial model, respectively. It is then and . Because of the residual intrinsic scattering of epoxy resin, it is not possible to directly measure the scattering phase function of the two scattering agents in the resin. Therefore, the particles are suspended in ethyl cinnamate that has a similar RI. Additional Mie calculations are shown to estimate the deviation in and caused by the RI difference. Since the epoxy resin shows weak but forward-oriented scattering, a measurement of collimated transmission cannot reveal its precise absorption. To compensate for this, a transmission setup is used to also collect the main part of the scattered light with an integrating sphere where two spectrometers are successively attached for analysis of a broad wavelength range. Note that back-scattered light is not detected and thus is interpreted as being absorbed. The samples are cylinders of lengths made of pure epoxy resin without any added agents. Cover glasses were attached on both sides to form reproducible surfaces. A reference sample is made of a drop of resin squeezed by two pieces of cover glass. The absorption is then calculated using Beer–Lambert law , where denotes the detected intensity of the sample divided by that of the reference. For the determination of the RI, we measure the deflection angle of the transmitted beam in a prism of equilateral triangular base made of epoxy resin as depicted in Fig. 2. We used a supercontinuum light source (SuperK Blue, NKFT Photonics A/S, Birkerød, Denmark) with a monochromator (AOTF-PCAOM Vis, Crystal Technology, Palo Alto, California) to filter single wavelengths between and 700 nm. Two parallel measuring tapes are aligned perpendicular to the prism triangle’s base with a displacement of 80 cm. We measure the intersection points of the beam and those tapes both with and without prism and calculate the RI using the incident angle , the emergent angle (both measured to the normal), and the angle of the tip of the prism Fig. 2Refractive index (RI) determination: setup to measure the deflection angle of light transmitted by a prism. The angle can be determined from the positions of intersection of the incident and deflected beams with both measure tapes. 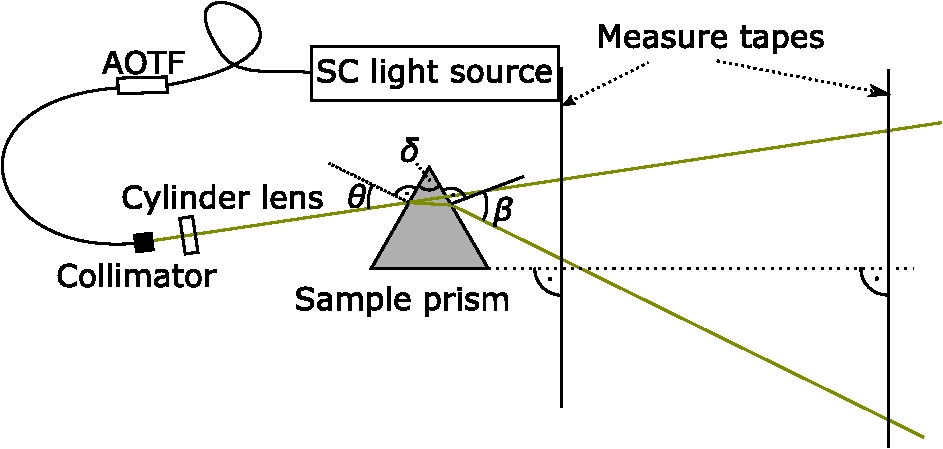 This equation can be derived from trigonometric calculations and Snell’s law at both prism interfaces. The RI of ethyl cinnamate is measured in the same way using a self-built hollow prism with glass walls of thickness. Fluorescence emission measurements are carried out by a commercial spectrophotometer system (Cary 5000, Varian Deutschland GmbH, Germany). 4.Results: Matrix MaterialAt first, we present results of the matrix material. In particular, data of the matrix material’s intrinsic scattering and absorption coefficient are presented as well as the RI in the visible range. We show that intrinsic fluorescence can be neglected for wavelengths . Since the RI of the matrix is expected not to change over time and the scattering and all of the used absorbing pigments are fadeless, the absorption of the epoxy resin remains the only nondurable property. The absorption of a newly cured phantom, a 1-year-old phantom, and a phantom stored in an oven at 60°C for several weeks are compared. 4.1.AbsorptionIn this section, the absorption of the matrix material is discussed. It is a very important measure since it defines the lowest absorption value possible with this phantom material. The absorption spectrum measured from a pure phantom without scatterers as described in Sec. 3 is shown including standard deviations as a faint green area in Fig. 3. The epoxy resin that is presented can be used as phantom material for biological media, since its intrinsic absorption is much lower than that of most biological tissue consisting mainly of water (black-dashed line) and fat. Furthermore, the low absorption allows for good control and adjustment using absorbing agents. Additional spectra concerning the aging process are shown that are described in the next subsection. All spectra exhibit characteristic peaks ranging from 0.0002 to in the considered wavelength range of 450 to 1650 nm. We found 10 of the peaks to be harmonics of and OH bonds.32 For the peaks at 710, 1190, and 1430 nm, no match could be found. The relatively large errorbars for small absorption values () are due to intrinsic scattering, which could not be completely compensated for. Around , both spectrometers have a poor signal-to-noise ratio and cause a residual noise spectrum. For high absorptions, only the short cylinder phantoms could be used and the related uncertainty in length is propagated to that of . The absorption values determined with the transmission setup for wavelengths below 650 nm are too high due to undetected back-scattered light. Fig. 3Absorption value of the matrix material as measured by different techniques: transmission measurement for samples without scattering agents (faint green area). Combined SRR and ToR measurements of phantom “Ref” (solid gray lines), phantom “Test” during aging process in a 60°C oven (long-dashed green lines, increases with longer times in the oven) and a 1-year-old phantom with similar configuration (solid blue line). For comparison, the absorption value of water (black-dashed line, measured by Pope and Fry30 and Kou et al.31) is presented. 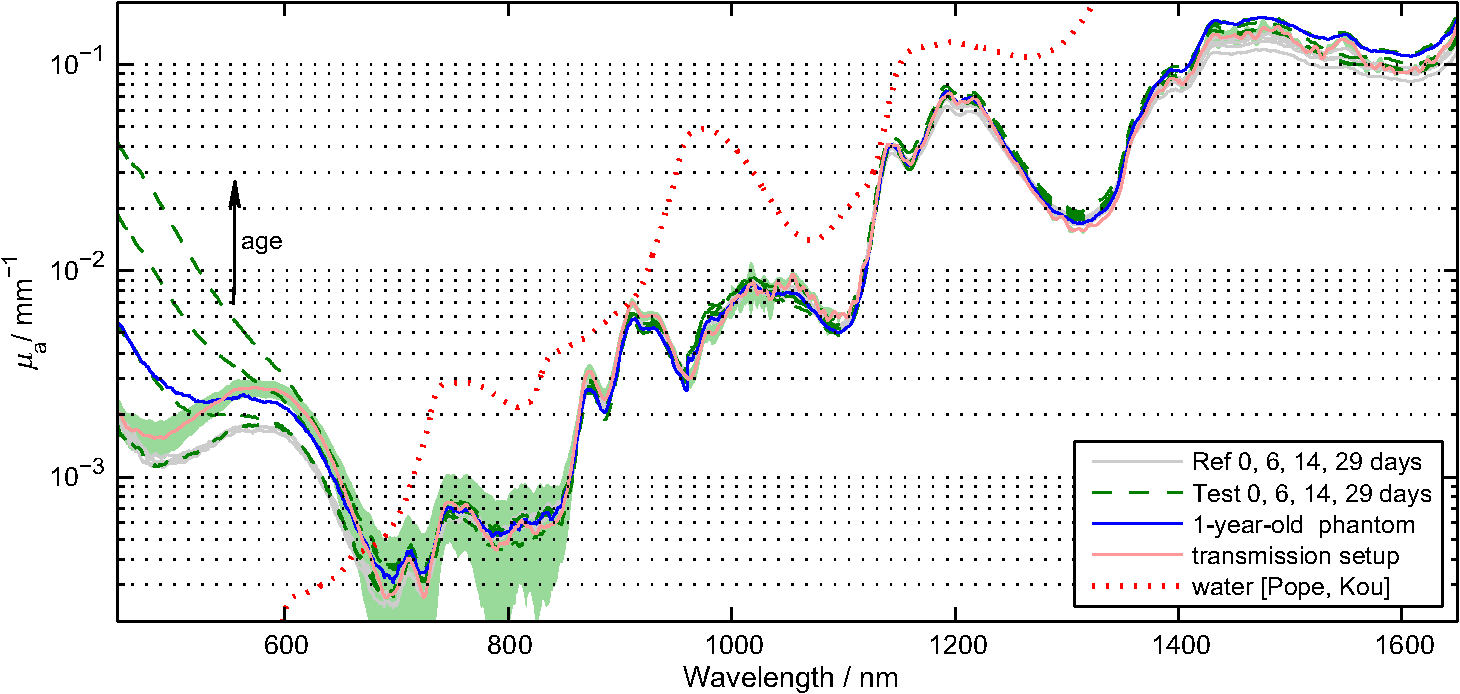 4.2.Stability in TimeThe aging-related alteration of optical properties of the phantoms is discussed in this section. We assume that scattering is not affected by aging as both the mineral-based scatterers and the epoxy matrix material are not expected to change their RI with age. Most pigments are lightfast, so no change of their absorption is expected. However, the yellowing of many plastics suggests an alteration of the epoxy resin absorption with time. Therefore, we cast two phantoms using identical ingredients. The concentration of WPP was chosen such that and no absorber was added. After curing for 5 days, both phantoms (“Ref” and “Test”) were measured with the ToR setup using the reduced scattering value from the SRR experiment. Afterwards “Test” was put into an oven with a constant temperature of 60°C for 4 weeks. It was removed only for several intermediate measurements. The high temperature in the oven accelerates the aging of the phantom “Test.” The rate of this aging cannot be precisely predicted; however, assuming a 10% increase in reaction speed for every Kelvin temperature rise, the corresponding ages of “Test” at the measurement dates are 0.75, 1.75, and 3.6 years. As expected, no drift in could be observed (not shown). The results for are presented in Fig. 3, where the absorption spectra for “Ref” (solid gray lines) and “Test” (long-dashed green lines) are shown as well as the spectrum of a 1-year-old phantom (solid blue line) stored in a cabinet and taken out regularly for performing measurements. The results clearly show a change of the absorption spectrum of the epoxy resin with age. Both “Test” with increasing time in the oven and the 1-year old phantom show a clear rise of for wavelengths shorter than 600 nm. Between 600 and 700 nm, the increase of is much smaller, so it can hardly be detected when an absorber is added. At longer wavelengths, no drift can be found. The spectra of “Test” and the 1-year-old phantom qualitatively differ: since multiple chemical reactions are expected to be involved in the aging process, they most likely also differ in their acceleration rate. Thus, no phantom in the oven corresponds to a real-aged phantom for all spectral changes. Please note additionally that exposure to ultraviolet radiation, i.e., sunlight, is also expected to yellow phantoms. This absorption change is probably in the same spectral range as the reported aging. Nevertheless, exposure of an optical phantom to sunlight for longer periods should be avoided. Interestingly, Moffitt et al.18 showed in a profound examination a drop in for their PU material with increasing age. Please note that in order to compensate the error due to a slightly imprecise measurement distance in the ToR setup for determination of , we modified the reflectance data by a factor of 0.99 to 1.01 over the whole spectrum such that the absorption spectra match for . 4.3.ScatteringThe scattering of most turbid media is much higher than that of the almost transparent matrix material, therefore, scatterers have to be added. The determination of the scattering coefficient of the matrix material allows to estimate its influence and shows that it can normally be neglected. Figure 4(a) gives the result of the measurements described in Sec. 2. The contribution to the scattering coefficient of the matrix material is which is very low. Since that contribution is likely to result from spatial variations in the RI or crystallized areas, there is no point in comparing the result to a spherical model such as Mie theory. Please note that insufficient stirring will give rise to flowmarks and scattering will increase in this case. Fig. 4(a) Intrinsic scattering coefficient of the matrix material measured using a short-pass and no filter. Error bars represent the standard deviation of the measurements of samples of different lengths. (b) Experimental (exp.) data of the refractive index. Crosses (solid line) and diamonds (dashed line) correspond to the epoxy resin system and ethyl cinnamate, respectively. The lower values (blue crosses, right axis) demonstrate the precision of our measurement system by comparing measured and reported RI values of water. The circles represent values published by Daimon and Masumura.33 The curves represent the best fit of parameters of the Cauchy model function [see Eq. (8)] to the experimental data, the values are given in the text.  4.4.Refractive IndexIn Fig. 4(b), the RI of the epoxy resin is shown (black crosses) as well as the dispersion relation of ethyl cinnamate (black diamonds). The latter one is well suited as an immersion fluid for optical coupling of epoxy resin phantoms, even though it has a stronger dispersion relation. The errorbars represent the standard deviation of measurements on all three sides of the prism. The Cauchy model equation fits the experimental data of epoxy resin for the parameters , , and . For ethyl cinnamate, the best fitting parameters are , , and . The latter was measured in a hollow prism with glass walls. Since the walls are thin, they do not deflect the beam, but give rise to a lateral shift. For verification of the setup, distilled water was also measured (blue crosses, right axis) in the same way. The standard deviations are smaller than 0.001 for all measured wavelengths and the values are in good agreement with those given by Daimon and Masumura33 (blue circles). For water, the Cauchy fit yields the parameters , , and .In the literature, RI data can be found for ethyl cinnamate in the range .14,34 The fit curve yields . No dispersion relation of ethyl cinnamate is yet reported and no RI data can be found for the given epoxy resin. The RI of our optical epoxy resin strongly differs from that of biological tissue. However, this is of no relevance if the actual RI is properly considered in a method’s evaluation model. Preliminary attempts showed that by adding 10% of ethanol into the epoxy, it is possible to greatly reduce the RI value, however, this also leads to changes in absorption and scattering. 4.5.FluorescenceThe presence of intrinsic fluorescence can render the inverse derivation of optical properties nearly impossible. It can especially falsify time-domain measurements because of the influence of the fluorescence lifetime. This underlines the necessity for measurement of the phantom’s fluorescence characteristics. Our measurements of the intrinsic fluorescence emission spectra show that weak fluorescence occurs below 500 nm. At longer wavelengths, the noise was larger than the residual fluorescence signal. This underlines the suitability of the chosen epoxy system for optical measurements, as we could detect fluorescence at much higher wavelengths for other epoxy resins. Note the difference of intrinsic and intended fluorescence. As shown in Sec. 6.2, it is possible to add rhodamine 6G to achieve a controlled fluorescence. 5.ScatterersSince the intrinsic optical properties of the epoxy resin are known, scattering agents can be added to control the scattering-related optical properties. In this section, results for the reduced scattering coefficient , the scattering coefficient , the anisotropy value , as well as the phase function related parameter are shown and discussed for both kinds of scattering agents namely the dispersion and the powder. Introducing a second scattering agent is motivated by the anisotropy value of being much lower than that in most biological tissues due to the very high RI of (35). The anisotropy value is limited to a maximum value of 0.65 for particles with diameters in the order of the wavelength.18 According to Mie theory (birefringence was neglected), a value of 0.8 can be achieved for larger particles; however, this is still insufficient to mimic biological tissue where the anisotropy can be up to 0.99.36 Aluminium oxide has an RI of , therefore, can be achieved using spheres with diameters of . By combining both scatterers, all anisotropy values in between can be produced. The same idea holds for , where denotes the second Legendre moment of the phase function. We emphasize that is strongly linked to the structural information and size distribution of the scatterers.25 Very recently, Kanick et al.24 presented the first mapping of on a hand with scars. Since no simple physical model for understanding has been reported despite its definition, the interested reader can find further information in the literature.23,37 In the following, we present results for both scattering agents in epoxy resin and show how they can be combined to achieve certain values of or . 5.1.Titanium Dioxide and Aluminium OxideThe optical properties of the epoxy resin phantoms with suspended or scatterers are presented in the left and right columns of Fig. 5, respectively. In the first row, the most important optical property for diffusive light propagation, i.e., the reduced scattering coefficient , is depicted and has been scaled by the weight concentration . For , measurements of the spatially resolved (circles), time-resolved (stars), and spatial frequency (squares) reflectance are used for determination of for various phantoms with weight concentrations of the dispersion between 0.14% and 1.1%. Each curve represents one phantom and for clarity the error bars are not shown. A widely used empirical power law was fit (black solid curve) to the experimental data yielding , where . This fit curve is used when casting new phantoms. We estimate the uncertainty to be 10%, then all measurements that have been performed lie in this uncertainty range. This uncertainty includes both systematic errors of the used measurement setups and analyses as well as errors in the phantoms’ manufacturing process. The main error of the latter is insufficient homogenization. First, this applies for the WPP. If the pigment paste is not stirred properly, scattering particles have sunk down and the concentration of scatterers at the surface is lower than expected. Second, the homogenization of the ingredients is very important since it prevents flowmarks and local variations in the optical coefficients and third, during curing particles sink down and agglomerate at high concentrations . Errors due to the weighing process and mixing stock solutions are negligible. Using pharmaceutical scales, an evaluation of the error propagation reveals less than 0.2% relative error of the final concentration. In comparison, results for of measurements of the top and bottom sides of one phantom are shown using the spatially resolved (circles) and the spatial frequency (squares) reflectance. The fit to the experimental data yields . Here, we assume an uncertainty of 15% due to the measurement of only one phantom. Fig. 5Optical properties (a,b), (c,d), (e,f) and (g,h) of the dispersion (a,c,e,g) and the powder (b,d,f,h). The methods used for obtaining these results are described in the text. Note that for the goniometer measurement of and , the scattering agents were dispersed in ethyl cinnamate instead of epoxy resin.  By comparison of the results for both scatterers, we draw two conclusions: first and expectedly, for is much higher than for . This is due to the enormous RI mismatch of 35 and epoxy resin () clearly exceeding that of 38 and epoxy resin (). Second, the scattering power, i.e., the exponent of the assumed power law, is higher for . Zonios and Dimou39 correlated the scattering power with the scatterer’s average size for a fixed RI mismatch. Their empirical fit would give an average diameter of for and for . The first value agrees surprisingly well with the size distribution derived from multiple electron microscope images , even though a part of the scattering power is caused by the very strong RI dispersion of . A representative image can be found below in Fig. 6(a). In Rayleigh scattering, the scattering power is normally assumed to be 4, which also represents its maximum without regarding a wavelength dependence of the RI. Due to the strong dispersion relation, for small particles, it can even exceed 4.8. The mean diameter of particles is a surprisingly low result, since the manufacturer’s data stated a typical -value of . Here, a discussion of the estimated sizes can be found below. For OCT and most microscopy techniques, the scattering coefficient is a key parameter as it usually dominates the attenuation of a beam inside tissue. Experimental results for of both scattering agents can be found in the second row of Fig. 5. The mean value of multiple phantom measurements is shown and the standard deviation is given as a shaded area. Similar to our results, the scattering coefficient of is much higher than that of at the same weight concentration. Additionally, the wavelength dependence is similar to that of . Below 500 nm, a systematic drift of of can be observed, which is most likely caused by stray light in the spectrometer. The anisotropy value is shown in the third row of Fig. 5. It can be derived by calculation of the mean cosine of the phase function which was measured by our goniometer setup (blue solid line with error bars) and also by comparing the graphs of the first and second rows in Fig. 5 using The results from that calculation are shown in green solid lines with a shaded area representing the error propagation. There is a large difference in between the scattering agents. For , the anisotropy value is around in the considered wavelength range, while for , is nearly constant around . This difference is the basis of the very idea of using two scattering agents and will be discussed below. Note the large error bars for the goniometer measurement of the powder. The error bars correspond to the standard deviation of three independent measurements with an added systematic error estimate. As stated above, the measured phase function has to be extrapolated for the first 10 deg. In a medium with a high anisotropy value , this extrapolation becomes very important which leads to the large errorbars for the powder. In the dispersion, the forward scattering is weak, thus the extrapolation does not have a strong influence on the analysis of . The Mie model (black lines) is described below. Results for the phase function related parameter are shown in the fourth row of Fig. 5. Assuming the often used Henyey–Greenstein phase equation, it is . With this in mind, we can see that this is only supported in the NIR, so for the presented scatterers, the Reynolds-McCormick phase function model might be suited better. As shown by Bevilacqua and Depeursinge,37 is in the range from 0.9 to 2.7 for Mie scatterers. With the presented scattering agents, it is possible to cover a range from 1.4 to 2.2 for wavelengths around 500 nm which almost covers the “physiological” range from 1.3 to 2.4.23 In contrast to the analysis of , the extrapolation of the phase function hardly influences the analysis of because of the weak contribution of the forward-scattered light. As already stated, the scattering agents were dispersed in ethyl cinnamate instead of epoxy resin for the goniometer measurements. The influence of the small change of the matrix material’s RI is depicted by calculations using Mie theory. When we assume a Gaussian size distribution for the particles of , a good agreement of the calculated value of and the experimental values is achieved. As depicted in the figure, the change due to the RI difference in the matrix material is much smaller than the measurement uncertainty. The calculated anisotropy values of in ethyl cinnamate (black solid line) differ less than 0.01 from those in epoxy resin (black dashed line). For , a Gaussian size distribution does not agree well with both and , while the sum of two Gaussians does. We show calculations for 35% of the particles (with respect to volume concentration) having a diameter and 65% with . Subsequently, we took scanning electron microscope (SEM) images [see Fig. 6(b)] that qualitatively confirmed the existence of particles with sizes around 300 nm. It can be found that a slight change of the matrix material’s RI has a significant influence on and below due to the smaller RI mismatch of and the matrix material compared to . Calculations for other particle sizes show a similar influence of the matrix material for both scattering agents. The assumed particle size of is larger but in the same order as the result from SEM images [see Fig. 6(a)]. However, the application of Mie theory neglects two facts. First, the Mie model’s assumption of spherical particles contradicts the elongate and polygonal shape revealed in SEM images. Second, shows strong birefringence, while Mie theory requires a scalar RI. We assumed the RI to be that of the ordinary ray.35 When assuming the RI of the extraordinary ray, calculations lead to smaller anisotropy values. The assumed size distribution of is not in accordance with the value provided by the distributor. Again, this deviation could be caused by the inapplicability of Mie theory for the elongated particles with rough surfaces. As they are expected to be larger than the wavelength, the particles’ shapes can strongly influence their scattering behavior. Please note that the given Mie calculations are not for comparison of experiment and theory, but for estimating the influence of the matrix material’s RI. 5.2.Adjusting the - or -ValueWhen the optical properties of both scattering agents are known, it is possible to mix them in order to adjust not only or , which is usually done, but also or . When mixing two scatterers (subscripts 1 and 2), the scattering events are weighted with . The higher order Legendre moments can thus be calculated as where refers to the ’th order Legendre polynomial. Applying this to the definition of , it can be shown that scales with , whereas scales with [see Eq. (10)]. We summarize that using these phantoms, a measurement setup can be calibrated or validated for the absolute determination of and or at least for measuring a change in these subdiffusive parameters. Instead of or adjustment, it is also possible to control the scattering power by using the same procedure.6.AbsorbersFor biomedical spectroscopy, phantoms with absorption spectra similar to that of melanin, hemoglobin, oxygenated hemoglobin, water, and other chromophores are usually aimed for. However, none of these chromophores have been reported to be successfully added to a durable phantom. Even though these natural absorbers have not yet been incorporated, a variety of absorption spectra can be achieved by combining several absorbers. For this purpose, we show absorption spectra of a useful set of pigment absorbers. Since they are pigments, their absorption spectra are less dependent on the environment than it is the case for molecular dyes. However, as predicted, e.g., by Mie theory, the absorption efficiency changes to some extent with the RI of the surrounding medium. To obtain a better insight on how the pigments will absorb in different matrix materials, we compared the absorption coefficient of the bulk , where denotes the imaginary part of the RI, with the absorption coefficient of spherical absorbers with particle size and a volume concentration dispersed in a matrix material. If scattering can be neglected and , then and are equal. In general, for spheres it is . Figure 7 shows the ratio for six different absorbers with , 2.3 and 3.0 for and (solid and dashed, respectively) in media with varied RI. It can be seen that the Sieve effect,40 i.e., the shadowing of regions of the particle by itself, lowers the fraction when comparing the two levels of absorption. We conclude that changing the RI of the surrounding medium from 1.56 (epoxy resin) to 1.40 (silicone) or 1.33 (water), a rise in the absorption of up to 40% is expected, depending on the size and complex RI of the absorbing particles. This rise is also confirmed by Mie calculations for particle size distributions of and (not shown). Note that the absolute value of the absorption changes, however, the general absorption features remain. That means the pigments can be used in other matrix materials as well. Fig. 6(a) The scanning electron microscope (SEM) image reveals the nonspherical structure of the scattering particles. (b) The SEM image indicates a broad distribution of scatterers’ sizes for the particles. 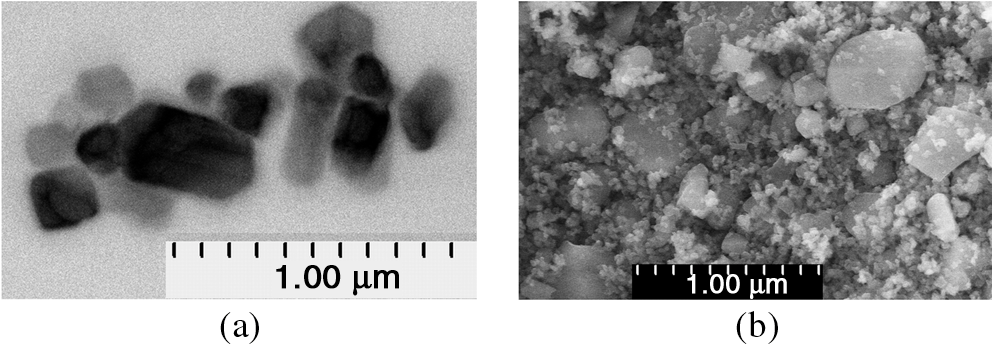 Fig. 7Comparison of the bulk absorption and the absorption of spheres of the same material dispersed in a matrix material. The -axis represents the refractive index of the matrix material. All curves were calculated using Mie theory. The refractive indices of the spheres are , , and (blue, orange, and green respectively), the imaginary part is chosen so that the absorption of the bulk is (solid lines) and (dashed lines). For this calculation, the spheres have a Gaussian size distribution of . Averaging over 3000 different sizes in this distribution was necessary to reduce the influence of intensive whispering gallery modes. 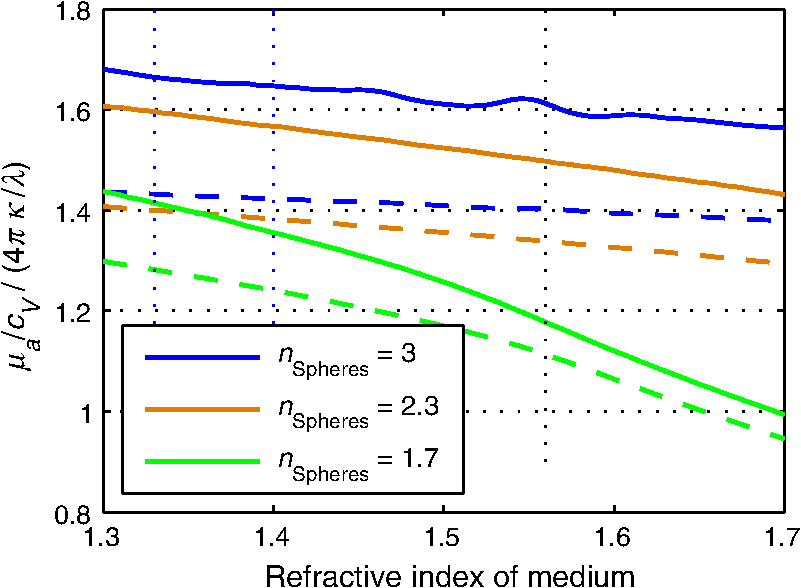 6.1.Absorbing PigmentsAbsorption spectra of seven pigments dispersed in epoxy resin are given in Fig. 8. The scattering of the absorbing pigments is too high to be neglected in the collimated transmission but too low to observe diffuse light propagation, so we control the scattering value by addition of a scattering agent. To obtain the given absorption spectra, we studied various scattering phantoms with and without absorbing pigments using the SRR and the ToR setups and divided the obtained difference in absorption value by the weight concentration of the pigments. Three of the shown absorbing pigments are even useful for wavelengths beyond 1000 nm. We estimate the error to be . A statistical analysis is not possible, since we only produced one phantom per pigment. It can be seen that all seven pigments have quite different spectral characteristics. We use the pigments for finding the dynamic range in terms of of our spectroscopic setups and for mimicking optical properties of muscle tissue. Haematite (also called “bloodstone”) has a similar characteristic to deoxyhemoglobin; however, the absorption edge at is much steeper for blood. The cobalt colors shown in Fig. 8(b) have interesting spectra in the visible range and feature high absorption values even for wavelengths above . As already explained, all pigments can be incorporated into other matrix materials without changing the qualitative characteristics of their spectra. By a linear combination of pigments, custom absorption spectra may be obtained akin to the absorption properties of skin, fat, or other tissue. There are three main problems associated with pigments: first, higher density particles sink in viscous fluids. With Stokes’ law, the sinking velocity of spheres can be estimated. Second, for high concentrations of pigments, the particles tend to agglomerate during the curing process, even though we observed this only for the WPP. Third, since particles are fluctuations in the RI, absorbing pigments scatter light, too. This scattering can be approximated using Mie theory. We found that particles with diameters give a good trade-off between weak scattering (larger pigments are preferable), sinking, and the Sieve effect (smaller pigments are preferable). When mixing the particles into the phantom, it is important to reach a high level of dispersion. To prevent the agglomeration of particles during the cure process, one can increase the phantoms’ viscosity by mixing resin and hardener some hours before the addition of the pigments. Fig. 8Absorption coefficient of (a) Phthalo Green, Phthalo Blue Royal, Cinnabar, and Haematite shown up to 1000 nm and (b) Cobalt Blue, Cobalt Blue Turquoise, and Cobalt Violet shown up to 1650 nm divided by their weight concentration. The numbers in the legend denote the product numbers of the distributor Kremer GmbH to uniquely identify the pigments. Uncertainties are estimated to be . The absorption of Cobalt Blue Turquoise for is too small to be properly determined and thus is not shown. 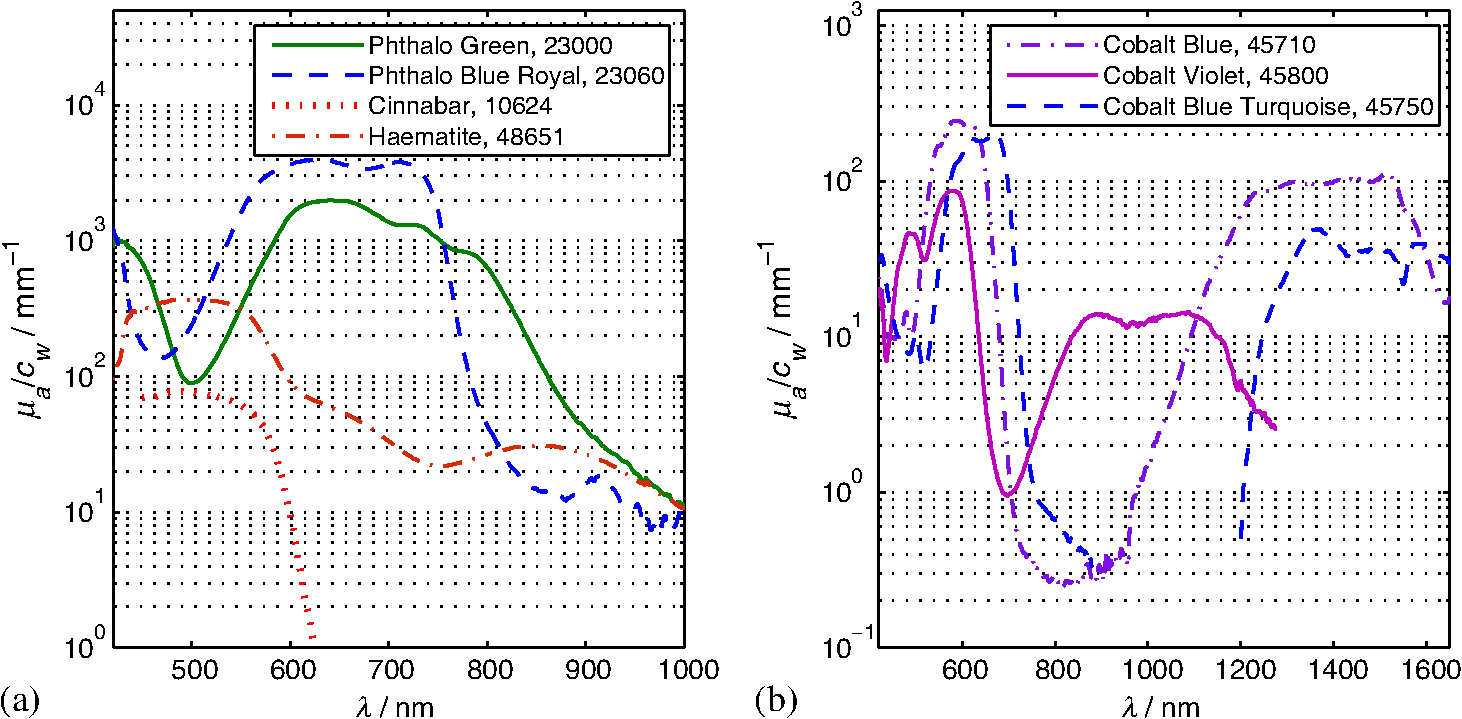 6.2.FluorophoresWe successfully added rhodamine 6G into scattering phantoms. It can either be dissolved in the resin directly or in ethanol which is then mixed into the resin. Using the Cary5000, we performed measurements of the emission spectrum at different excitation wavelengths. The results show a peak at an excitation wavelength of and emission wavelength of . For our fluorescent phantoms, no bleaching could be detected within 3 months. 7.ConclusionIn this study, we have presented a solid optical phantom system with control over many optical properties. We have determined basic properties of the matrix material as well as diffusive and subdiffusive parameters of two different scattering agents. Those agents can be combined in a single phantom to achieve a distinct anisotropy value or value. We have shown that except for the absorption below 700 nm, all properties are stable over years. A set of absorbing pigments was presented that are suitable for use in the chosen epoxy resin and that are completely lightfast. Some of them even are useful as absorbers in the NIR range. Future work can include applying a Mie model for birefringent spheres.41 With regard to biomedical optics, the next step should be the search for a set of absorbing pigments that can mimic the absorption spectra of human tissue, in particular that of oxygenated and deoxygenated human blood. AcknowledgmentsP. Krauter acknowledges the support by Evangelisches Studi-enwerk Villigst e.V. We thank David Saal and Thomas Schmid for machining a large number of phantoms and Fabian Enderle for providing SEM images. ReferencesR. Srinivasan, D. Kumar and M. Singh,
“Optical tissue-equivalent phantoms for medical imaging,”
Trends Biomater. Artif. Organs, 15
(2), 42
–47
(2002). Google Scholar
N. Bodenschatz et al.,
“Surface layering properties of Intralipid phantoms,”
Phys. Med. Biol., 60
(3), 1171
–1183
(2015). http://dx.doi.org/10.1088/0031-9155/60/3/1171 PHMBA7 0031-9155 Google Scholar
G. Wagnières et al.,
“An optical phantom with tissue-like properties in the visible for use in PDT and fluorescence spectroscopy,”
Phys. Med. Biol., 42
(7), 1415
–1426
(1997). http://dx.doi.org/10.1088/0031-9155/42/7/014 PHMBA7 0031-9155 Google Scholar
R. Cubeddu et al.,
“A solid tissue phantom for photon migration studies,”
Phys. Med. Biol., 42
(10), 1971
–1979
(1997). http://dx.doi.org/10.1088/0031-9155/42/10/011 PHMBA7 0031-9155 Google Scholar
A. Kharine et al.,
“Poly(vinyl alcohol) gels for use as tissue phantoms in photoacoustic mammography,”
Phys. Med. Biol., 48
(3), 357
–370
(2003). http://dx.doi.org/10.1088/0031-9155/48/3/306 PHMBA7 0031-9155 Google Scholar
J. C. Hebden et al.,
“A soft deformable tissue-equivalent phantom for diffuse optical tomography,”
Phys. Med. Biol., 51
(21), 5581
–5590
(2006). http://dx.doi.org/10.1088/0031-9155/51/21/013 PHMBA7 0031-9155 Google Scholar
G. Beck et al.,
“Design and characterisation of a tissue phantom system for optical diagnostics,”
Laser Med. Sci., 13
(3), 160
–171
(1998). http://dx.doi.org/10.1007/s101030050070 Google Scholar
M. Lualdi et al.,
“A phantom with tissue-like optical properties in the visible and near infrared for use in photomedicine,”
Lasers Surg. Med., 28
(3), 237
–243
(2001). http://dx.doi.org/10.1002/lsm.1044 LSMEDI 0196-8092 Google Scholar
C. E. Bisaillon et al.,
“Deformable and durable phantoms with controlled density of scatterers,”
Phys. Med. Biol., 53
(13), N237
(2008). http://dx.doi.org/10.1088/0031-9155/53/13/N01 PHMBA7 0031-9155 Google Scholar
F. Ayers et al.,
“Fabrication and characterization of silicone-based tissue phantoms with tunable optical properties in the visible and near infrared domain,”
Proc. SPIE, 6870 687007
(2008). http://dx.doi.org/10.1117/12.764969 PSISDG 0277-786X Google Scholar
D. M. de Bruin et al.,
“Optical phantoms of varying geometry based on thin building blocks with controlled optical properties,”
J. Biomed. Opt., 15
(2), 025001
(2010). http://dx.doi.org/10.1117/1.3369003 JBOPFO 1083-3668 Google Scholar
A. Curatolo, B. F. Kennedy and D. D. Sampson,
“Structured three-dimensional optical phantom for optical coherence tomography,”
Opt. Express, 19
(20), 19480
–19485
(2011). http://dx.doi.org/10.1364/OE.19.019480 OPEXFF 1094-4087 Google Scholar
M. Firbank and D. Delpy,
“A design for a stable and reproducible phantom for use in near infra-red imaging and spectroscopy,”
Phys. Med. Biol., 38
(6), 847
–853
(1993). http://dx.doi.org/10.1088/0031-9155/38/6/015 PHMBA7 0031-9155 Google Scholar
M. Firbank, M. Oda and D. T. Delpy,
“An improved design for a stable and reproducible phantom material for use in near-infrared spectroscopy and imaging,”
Phys. Med. Biol., 40
(5), 955
–961
(1995). http://dx.doi.org/10.1088/0031-9155/40/5/016 PHMBA7 0031-9155 Google Scholar
J. C. Hebden et al.,
“Time-resolved optical imaging of a solid tissue-equivalent phantom,”
Appl. Opt., 34
(34), 8038
–8047
(1995). http://dx.doi.org/10.1364/AO.34.008038 APOPAI 0003-6935 Google Scholar
U. Sukowski et al.,
“Preparation of solid phantoms with defined scattering and absorption properties for optical tomography,”
Phys. Med. Biol., 41
(9), 1823
–1844
(1996). http://dx.doi.org/10.1088/0031-9155/41/9/017 PHMBA7 0031-9155 Google Scholar
A. Pifferi et al.,
“Performance assessment of photon migration instruments: the MEDPHOT protocol,”
Appl. Opt., 44
(11), 2104
–2114
(2005). http://dx.doi.org/10.1364/AO.44.002104 APOPAI 0003-6935 Google Scholar
T. Moffitt, Y. C. Chen and S. A. Prahl,
“Preparation and characterization of polyurethane optical phantoms,”
J. Biomed. Opt., 11
(4), 041103
(2006). http://dx.doi.org/10.1117/1.2240972 JBOPFO 1083-3668 Google Scholar
R. Cooper et al.,
“A tissue equivalent phantom for simultaneous near-infrared optical tomography and EEG,”
Biomed. Opt. Express, 1
(2), 425
–430
(2010). http://dx.doi.org/10.1364/BOE.1.000425 BOEICL 2156-7085 Google Scholar
A. E. Cerussi et al.,
“Tissue phantoms in multicenter clinical trials for diffuse optical technologies,”
Biomed. Opt. Express, 3
(5), 966
–971
(2012). http://dx.doi.org/10.1364/BOE.3.000966 BOEICL 2156-7085 Google Scholar
B. W. Pogue and M. S. Patterson,
“Review of tissue simulating phantoms for optical spectroscopy, imaging and dosimetry,”
J. Biomed. Opt., 11
(4), 041102
(2006). http://dx.doi.org/10.1117/1.2335429 JBOPFO 1083-3668 Google Scholar
G. Lamouche et al.,
“Review of tissue simulating phantoms with controllable optical, mechanical and structural properties for use in optical coherence tomography,”
Biomed. Opt. Express, 3
(6), 1381
–1398
(2012). http://dx.doi.org/10.1364/BOE.3.001381 BOEICL 2156-7085 Google Scholar
S. Chamot et al.,
“Physical interpretation of the phase function related parameter γ studied with a fractal distribution of spherical scatterers,”
Opt. Express, 18
(23), 23664
–23675
(2010). http://dx.doi.org/10.1364/OE.18.023664 OPEXFF 1094-4087 Google Scholar
S. C. Kanick et al.,
“Sub-diffusive scattering parameter maps recovered using wide-field high-frequency structured light imaging,”
Biomed. Opt. Express, 5
(10), 3376
–3390
(2014). http://dx.doi.org/10.1364/BOE.5.003376 BOEICL 2156-7085 Google Scholar
N. Bodenschatz et al.,
“Model based analysis on the influence of spatial frequency selection in spatial frequency domain imaging,”
Appl. Opt., 54
(22), 6725
–6731
(2015). http://dx.doi.org/10.1364/AO.54.006725 APOPAI 0003-6935 Google Scholar
E. Simon, P. Krauter and A. Kienle,
“Time-resolved measurements of the optical properties of fibrous media using the anisotropic diffusion equation,”
J. Biomed. Opt., 19
(7), 075006
(2014). http://dx.doi.org/10.1117/1.JBO.19.7.075006 JBOPFO 1083-3668 Google Scholar
F. Foschum and A. Kienle,
“Broadband absorption spectroscopy of turbid media using a dual step steady-state method,”
J. Biomed. Opt., 17
(3), 037009
(2012). http://dx.doi.org/10.1117/1.JBO.17.3.037009 JBOPFO 1083-3668 Google Scholar
P. Krauter,
“Bestimmung optischer Eigenschaften streuender Medien mittels NIR-Remissionsspektroskopie,”
(2012). Google Scholar
F. Foschum and A. Kienle,
“Optimized goniometer for determination of the scattering phase function of suspended particles: simulations and measurements,”
J. Biomed. Opt., 18
(8), 085002
(2013). http://dx.doi.org/10.1117/1.JBO.18.8.085002 JBOPFO 1083-3668 Google Scholar
R. M. Pope and E. S. Fry,
“Absorption spectrum (380–700 nm) of pure water. ii. integrating cavity measurements,”
Appl. Opt., 36
(33), 8710
–8723
(1997). http://dx.doi.org/10.1364/AO.36.008710 APOPAI 0003-6935 Google Scholar
L. Kou, D. Labrie and P. Chylek,
“Refractive indices of water and ice in the 0.65-to spectral range,”
Appl. Opt., 32
(19), 3531
–3540
(1993). http://dx.doi.org/10.1364/AO.32.003531 APOPAI 0003-6935 Google Scholar
C. N. Banwell and E. M. McCash, Fundamentals of Molecular Spectroscopy, McGraw-Hill, London
(1983). Google Scholar
M. Daimon and A. Masumura,
“Measurement of the refractive index of distilled water from the near-infrared region to the ultraviolet region,”
Appl. Opt., 46
(18), 3811
–3820
(2007). http://dx.doi.org/10.1364/AO.46.003811 APOPAI 0003-6935 Google Scholar
“Ethyl cinnamate-natural,”
Missouri
(2015). http://www.sigmaaldrich.com/catalog/product/aldrich/w243019?lang=deion=DE Google Scholar
J. R. DeVore,
“Refractive indices of rutile and sphalerite,”
J. Opt. Soc. Am., 41
(6), 416
–417
(1951). http://dx.doi.org/10.1364/JOSA.41.000416 JOSAAH 0030-3941 Google Scholar
W. F. Cheong et al.,
“A review of the optical properties of biological tissues,”
IEEE J. Quant. Electron., 26
(12), 2166
–2185
(1990). http://dx.doi.org/10.1109/3.64354 Google Scholar
F. Bevilacqua and C. Depeursinge,
“Monte Carlo study of diffuse reflectance at source–detector separations close to one transport mean free path,”
J. Opt. Soc. Am. A, 16
(12), 2935
–2945
(1999). http://dx.doi.org/10.1364/JOSAA.16.002935 JOAOD6 0740-3232 Google Scholar
M. J. Dodge, I. H. Malitson and A. I. Mahan,
“A special method for precise refractive index measurement of uniaxial optical media,”
Appl. Opt., 8 1703
–1705
(1969). http://dx.doi.org/10.1364/AO.8.001703 APOPAI 0003-6935 Google Scholar
G. Zonios and A. Dimou,
“Light scattering spectroscopy of human skin in vivo,”
Opt. Express, 17
(3), 1256
–1267
(2009). http://dx.doi.org/10.1364/OE.17.001256 OPEXFF 1094-4087 Google Scholar
M. Das et al.,
“The ‘Sieve-effect’ in Chlorella suspensions,”
J. Phys. Chem., 71
(11), 3543
–3549
(1967). http://dx.doi.org/10.1021/j100870a031 JPCHAX 0022-3654 Google Scholar
Y. L. Geng et al.,
“Mie scattering by a uniaxial anisotropic sphere,”
Phys. Rev. E, 70 056609
(2004). http://dx.doi.org/10.1103/PhysRevE.70.056609 Google Scholar
Biography |


