
|
|
1.IntroductionSecond harmonic generation (SHG) is a nonlinear optical phenomenon in which two lower-energy photons are upconverted to a higher-energy photon with exactly twice the incident photon frequency. SHG from biological structures has been extensively studied. Collagen fibers from rat tail tendon, cornea, and skin were found to exhibit strong SHG.1–3 It was reported that actomyosin in muscle generated SHG as well.4 With the advancement of laser technology and improvements in scanning systems and data acquisition hardware, the evolution of SHG imaging into a viable routine imaging tool in medicine and biology is realized.5–7 Unlike fluorescence, an incoherent process that emits over degree angle, SHG is a coherent process, which normally favors the forward rather than the backward emission direction due to the phase matching requirement. Due to the existence of phase mismatch, efficient energy transfer from the fundamental excitation field to the SHG field happens only when the interaction length is shorter than the coherence length, defined as ,8 where is the propagation wave vector phase mismatch. The coherence length in the backward direction is extremely short ( at 800 nm excitation wavelength), which is two orders of magnitude shorter than that in the forward direction. In microscopy, the focal volume size of a high numerical aperture objective is to 1500 nm, which is longer than the coherence length in the backward direction. Therefore, according to the SHG theory for bulk material, efficient backward generated SHG is unlikely. However, in SHG microscopy, where backward collection geometry is usually needed for imaging thick biological tissues, appreciable backward SHG is observed. For example, tendon collagen fibrils, with an average diameter of 200 to 300 nm, are measured with unity forward over the backward intensity ratio (F/B).9 Forward and backward SHG intensities are comparable in sclera, which also have a diameter of a few hundred nanometers.10 Previously, we measured the forward and backward SHG in the -thin tendon slice over a wide excitation wavelength range (backward SHG excitation spectrum) from 750 to 950 nm.11 It was found that significant backward SHG was detected at all wavelengths. Our previous investigation also revealed that forward-generated backward-scattered SHG from thick mouse tail tendon only accounts for 15% of the total backward-collected SHG that includes both forward-generated backward-scattered SHG and pure backward-generated SHG.12 Therefore, although scattering affects the backward-collected SHG, backward generation is still significant over a wide excitation wavelength range. Other than phase matching, the intensity of backward SHG also depends on the nonlinear coefficient . Recently, Hall et al. used a two-step model to estimate the wavelength dependence of and compared it with experimental measurements,13 where was found to drop down by less than five times within the wavelength span from 750 to 950 nm. Thus, the moderate variation of backward SHG intensity and coefficient implies that there exists a mechanism that assists backward phase matching over a wide excitation wavelength range. Several models have been proposed to explain the significant backward-generated SHG. Zipfel et al. described the SHG from a thin surface layer with tens of nanometers’ thickness, which reduced the interaction length in the collagen so that it was comparable with the coherence length for backward SHG.14 Type I collagen fibrils usually form highly organized quasicrystalline structures, which have been proposed as a quasiphase matching (QPM) structure to study the interaction between neighboring fibrils.15,16 QPM is a technique for phase matching nonlinear optical interactions in which the relative phase is corrected at regular intervals using a periodic structure built into the nonlinear medium.17 Campagnola et al. assigned different values for the phase mismatch for the forward and backward directions to explain the relative intensity in both directions, but how the was related to the structure was not explained.15 Later on, Tian et al. theoretically discussed the effect of an additional wave vector from a lattice structure on optimum backward SHG under a dipole model framework.16 From the perspective of electrical field calculation, the difficulty of the dipole method lies in the selection of the unit dipole that generates the SHG. The dipole size selection is a trade-off between accuracy and calculation volume. Identifying the physical meaning of an appropriate dipole size is not easy. Therefore, although intuitive, the dipole method lacks a physical insight into the problem and has some unsolved issues. In addition, the underlying assumption behind the dipole model is that the second harmonic generated photon does not interact with the surrounding fibrils, which is not strictly true. The periodic collagen microstructure is similar to a two-dimensional (2-D) photonic crystal with a 2-D periodic second-order nonlinear coefficient. It has been reported that new phase matching processes can appear in a photonic crystal with 2-D periodic nonlinear susceptibility mainly because the 2-D structure of the lattice could provide additional virtual momentum to the total phase mismatch.18–21 Berger et al. first investigated different orders of the QPM process which satisfied certain phase matching directions. The efficiency of the nonlinear process was proportional to the corresponding Fourier series coefficient.18 The conversion efficiencies for different types of periodic structure, such as hexagonal, square, and rectangular, were compared in Ref. 19 to find an optimal one. Besides assisting phase matching, the conversion efficiency can also be enhanced via the strong localized fields and reduced group velocity at the band edge, which usually requires a strong dielectric contrast between the nonlinear material and the medium in the structure.20,21 In collagen tissues, the dielectric coefficient contrast between fibrils and the background material is usually weak. Therefore, the field localization effect and group velocity effect are not as significant as the phase matching effect. Regarding the theoretical method applied, the fundamental and SHG waves are assumed to be plane waves, and the nonlinear susceptibility is expanded by a reciprocal vector in Refs. 18 and 19. In Refs. 20 and 21, all the major physical terms including wave functions are expanded by a reciprocal vector. The latter method is called plane wave expansion and is studied in detail in Ref. 22. Nevertheless, the above studies have only been carried out on photonic crystals. In this manuscript, we study the backward SHG in biological tissues, specifically collagen. We apply a new approach that treats the collagen microstructure as a 2-D photonic crystal and study its backward SHG. The method used in 2-D photonic crystals will be applied on collagen microstructures. This manuscript is structured as follows: in Sec. 2, the principle of backward phase matching in a periodic lattice structure is revealed, and an SHG intensity expression is obtained by the plane wave expansion method; in Sec. 3, effects of angle tilting, beam focusing, and single fibril diameter are simulated via the theoretical solutions; in Sec. 4, the effect of different excitation and emission angles on the excitation SHG spectrum of collagen tissues is experimentally investigated and compared with simulation results. Conclusions are given in Sec. 5. 2.Theory2.1.Lattice Assisted Phase Matching and Angle Tilting for Backward Second Harmonic GenerationCollagen tissue is composed of regularly aligned fibrils which can be considered as a 2-D lattice. Figure 1(a) shows a transmission electron microscopy (TEM) image of collagen fibrils from mandrill facial skin.23 From the TEM image, collagen fibrils are shown to form a relatively regular packing structure, which is similar to a 2-D photonic crystal. Collagen has been modeled as a 2-D periodic structure before in the literature.16 Figure 1(b) shows the 2-D lattice in the spatial space, where each dot represents a fibril cylinder. The elementary lattice vectors are and , where the parameter represents the distance between the centers of two adjacent collagen fibril cylinders. Figure 1(c) shows the corresponding elementary reciprocal lattice vectors in the space, which are and given by . Each dot in the space represents a virtual momentum , provided by the lattice structure in which and are integers. Fig. 1(a) Transmission electron microscopy image of collagen fibrils from mandrill facial skin.23 Scale bar is 250 nm. (b) Illustration of the periodic structure with elementary lattice vectors and . The red and green arrows represent the wave vector of fundamental and second harmonic generation (SHG) , . (c) The corresponding space diagram with elementary reciprocal vector and . The red, green, and purple arrows illustrate the fundamental SHG wave vector , and the backward phase mismatch . 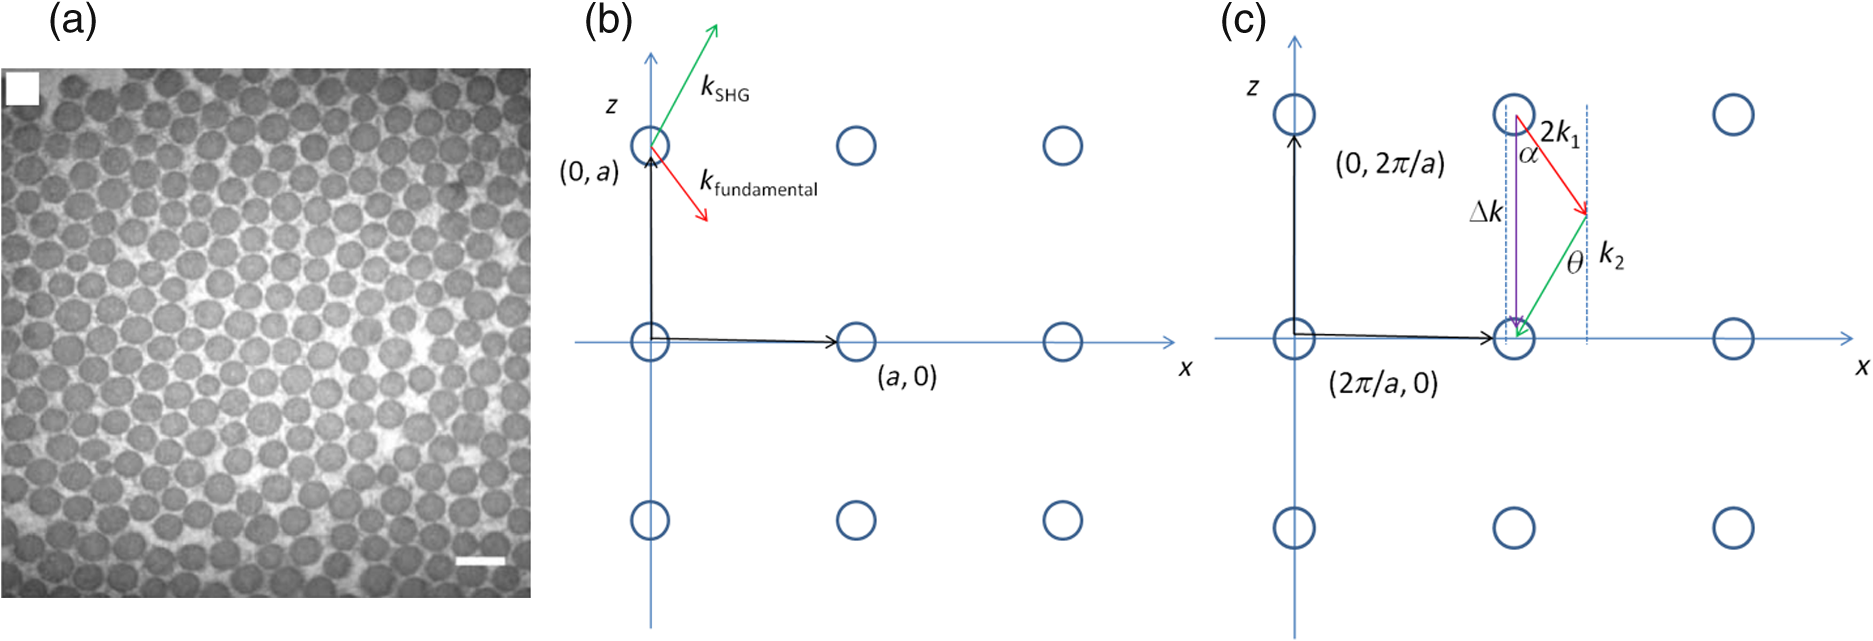 In this study, we only consider the case where the wave vectors are in the plane. For backward SHG, the wave vector of the SHG beam is in the opposite direction as that of the fundamental beam . The phase mismatch can be written as , where and . Since the lattice structure introduces virtual momentum , the phase mismatch expression can be modified as in a periodic structure. Taking and , the virtual momentum becomes in the direction, which is defined as the depth direction in our study. The projections of the phase mismatch in the (lateral direction) and directions are expressed as follows: and are the angles between the fundamental wave or SHG wave and the axis, with positive angles defined as tilting counterclockwise. Here, is the fundamental excitation wavelength. and are the refractive indices at the fundamental and SHG wavelengths, respectively. For simplicity, we will assume in the rest of the paper. In Eq. (1), the parameters , , and all affect the phase mismatch for a given spacing . From Eq. (1), phase matching in the direction, where , can be achieved when . Phase matching in the direction, meaning , is only achieved at an optimum excitation wavelength that can be found as follows: When , phase matching can be achieved at For excitation wavelengths shorter than , phase matching can still be achieved by increasing and according to Eq. (2). However, for excitation wavelengths longer than , there is no solution to and in Eq. (2), which means that there is no perfect phase matching for those longer wavelengths. 2.2.Theoretical Background for the Simulation of Second Harmonic Generation in CollagenTo describe the dependence of SHG intensity on phase mismatch quantitatively, a solution to the SHG intensity is needed. The SHG intensity in a periodic nonlinear material can be solved by the plane wave expansion method.22 In this method, the electrical fields and the dielectric function are expanded as a Fourier series in the spatial frequency domain. Maxwell’s equation is solved algebraically by formulating an eigenvalue problem in the spatial frequency domain. After the fundamental field is solved, it is substituted into the Green’s function to obtain the expression of SHG intensity. Details about the method can be found in Ref. 22. Here, we only list the key results that are related to the simulation and experiments in this paper. The SHG intensity in a periodic structure is expressed as22 The last two function terms in Eq. (4) describe the interaction of SHG waves from neighboring cylinders. and represent the number of cylinders along the lateral and depth directions in the focal volume. When perfect phase matching in the lateral or depth direction is satisfied, meaning or equal to 0, those terms reduce to or , respectively. The term describes the field distribution pattern of the SHG field in the space. The function term can be considered as an effective nonlinear susceptibility with respect to the fundamental and SHG fields within a unit cell. It can be expressed as Here, denotes the volume of the unit cell. and are periodic functions with period expressing the normalized distribution of the excitation and SHG fields, respectively. Next, we focus on the phase matching related terms and simplify Eq. (4) into Eqs. (6) and (7). In collagen tissues, the collagen fibrils only occupy part of the tissue in a periodic distribution. Single fibrils are considered as unit cells generating SHG. The SHG intensity generated by a single fibril is calculated by integrating over a unit cell, which is represented by the function term. The total SHG is the coherent summation of SHG from all the unit cells within the focal volume size, which is represented by the function terms. 3.Simulations3.1.Effect of Lattice Structure and Angle Tilting on Phase Matching for Backward Second Harmonic GenerationFrom Eq. (2), the optimized excitation and emission angles for achieving perfect phase matching can be obtained for a certain wavelength range. When the angle condition cannot be satisfied or the wavelength is beyond the range, perfect phase matching cannot be achieved, thus, the SHG intensity decreases. How the SHG intensity varies with the angles and wavelength can be simulated according to Eqs. (1) and (6). In the following simulation, we will investigate the perfect phase matching and nonperfect phase matching scenarios for two excitation wavelengths, 800 and 900 nm. To study the effect of multiple fibrils, the effective nonlinear susceptibility for a unit cell is simplified to be equal to unity. Other simulation parameters are selected as , and spacing are chosen according to an average diameter for a mouse tail tendon as reported in Refs. 24 and 25, and and are selected based on a focal depth of and focal width of for a typical objective with . Figure 2 shows the phase mismatch and SHG intensity as a function of , , and excitation wavelength. Figures 2(a) and 2(b) show the 2-D contour map of phase mismatch and as a function of and at 800-nm excitation wavelength. For the purpose of normalization, and are multiplied by spacing . The range of is selected from 0 to 35 deg because the largest incidence angle provided by an and the objective lens is . When , phase matching in the lateral direction with is satisfied, which is shown as a dark blue band marked by the arrow in Fig. 2(a). According to Eq. (3), the longest wavelength that can achieve perfect phase matching is , . For a fundamental wavelength shorter than 870 nm, such as 800 nm, two opposite angles can satisfy for each , which is illustrated as the left opened half circle dark blue band marked by a black arrow in Fig. 2(b). Figure 2(c) shows the 2-D contour map for SHG intensity as a function of and . In Fig. 2(c), the highest SHG intensity occurs at the crossing point of these two bands, where perfect phase matching with is simultaneously satisfied. The optimized and pair for achieving phase matching at are and , indicated by the arrow, which can also be verified by Eq. (2). Fig. 2The contour map of , and SHG intensity as a function of fundamental excitation angle and SHG emission angle for [(a)–(c)] 800 nm excitation wavelength and [(d)–(f)] 900 nm excitation wavelength. (g) For or 23.4 deg, respectively, the corresponding SHG intensity from 750 to 950 nm excitation wavelength. The simulated structure has , , and .  Figures 2(d)–2(f) plots the same contour maps for . Figure 2(d) shows that phase matching in the lateral direction with is satisfied when . However, there is no selection of the and pair that can satisfy perfect phase matching in the direction because this is longer than 870 nm. In Fig. 2(e), is always larger than zero, and the minimum appears at ; its value increases as increases. In Fig. 2(f), the highest SHG intensity happens at , and this SHG intensity is lower than that in Fig. 2(c) because of the phase mismatch. From the above results, when is shorter than , perfect phase matching can be achieved with an optimized selection of and given by Eq. (2). However, if is longer than , there is no perfect phase matching along the depth direction and the optimized and values are 0 deg. Figure 2(g) draws the SHG excitation spectrum when and , which shows the SHG intensity variation as a function of excitation wavelength. As we have already discussed, the optimum excitation wavelengths for these two angle sets are and 800 nm, respectively. From the figure, the half-intensity bandwidth is . From Eq. (4), the SHG intensity is approximately proportional to for small phase mismatch. A fewer number of fibrils in the focal volume not only results in a lower SHG intensity, but also flattens the dependence on and , which means a broader bandwidth of the SHG excitation spectrum. Since our model is based on the grating effect in a periodic structure for achieving phase matching, a fewer number of fibrils reduces the grating effect and eventually violates the assumption for the model. Validation on this issue is not investigated in this paper and will be studied in the future. In the literature, longer excitation wavelengths have also been used in SHG imaging.26 To address the phase matching condition at longer wavelengths, modifications to the model will be needed, such as considering some randomness of the periodic structure and different orientations of the wave vectors of the photons in the SHG process. 3.2.Effect of Single Fibril and Excitation Beam Focusing on Backward Second Harmonic Generation Excitation SpectrumAs discussed in Sec. 2.2, the function describes the SHG intensity from a unit cell consisting of a single fibril. The integration is over a relatively short length of a single fibril diameter, which is comparable with the coherence length of backward SHG. Thus, considerable backward SHG can be generated from single fibrils. Furthermore, when the fibril spacing and the wavelength satisfy a certain relationship, the SHG from individual fibrils can add up constructively, resulting in a strong backward SHG. Therefore, the backward SHG generated from a periodic structure can be much stronger than that for a bulk material with the same total length. For example, if we apply Eq. (5) to two fibrils with diameters of 140 nm (average collagen fibrils) and 1500 nm (where the whole focal volume is occupied by collagen), respectively, their intensity difference is as large as three orders of magnitude. Considering the coherent summation over multiple layers in the focal volume, the intensity increment provided by the periodic structure is even more. This quick estimation demonstrates the importance of the periodic structure in backward SHG enhancement. The combined effect of a single unit and periodic structure on the SHG excitation spectrum is demonstrated in Fig. 3. Since the wavelength dependence of is not clear yet, we ignore its wavelength dependency. We choose a fibril diameter and spacing to simulate a 70% packing ratio in regular tail tendon tissues.27,28 The solid green curve represents a plane wave incident at for the fibril structure , . is kept at 0 deg. It is found that the impact of a single fibril on its peak wavelength is negligible as the peak wavelength for a 140-nm-diameter fibril remains at 870 nm. This is because the single fibril’s phase matching variation within the wavelength range is moderate, as is shown in the dashed dotted purple curve. Fig. 3The normalized SHG excitation spectrum for fibril diameter , structure , , without (solid green) and with (dash cyan) focusing. In the nonfocusing case, .The focused beam effect is simulated through summing up the excitation spectrum generated by plane waves with incidence angles from 0 to 35 deg. The wavelength dependence of function is plotted in dash-dotted purple curve, which shows the impact of single fibril on excitation spectrum.  In multiphoton microscopy using high NA objectives, the excitation light is focused into a light cone which covers a range of incident angles . To simulate the SHG excitation spectrum excited by a focused beam, the SHG amplitude under different incident angles is integrated, where the excitation light is assumed to have a Gaussian distribution. where is the amplitude at the origin. The incident angle is determined by , where and are the radial and height parameters of the cylindrical coordinate system. In the microscopy configuration, equals the focal length of the objective lens. The dashed cyan curve represents the normalized excitation spectrum under a focused incident light. Confocal parameter (at 800 nm) and focal spot width take typical values of a objective with . The integration range for is from 0 to 35 deg.As discussed in Sec. 3.1, for this fibril structure, perfect phase matching at occurs at 870 nm wavelength. For a wavelength longer than 870 nm, is also preferred, although no perfect phase matching is obtained. Since a Gaussian beam has the highest intensity at , the optimized excitation wavelength does not shift under the focusing condition and the excitation spectra, with and without focusing, match closely from the peak position toward a longer wavelength. For a wavelength shorter than 870 nm, the incident angle can be increased to maintain perfect phase matching. Therefore, the excitation spectrum with focusing shows higher SHG intensity because of the multiple incident angles provided by the focused Gaussian beam. The half-intensity bandwidth increases from 70 to 100 nm under focusing. With focused beam incidence, the Gaussian distribution of the intensity among various angle components may slightly alter the angle that generates the strongest SHG intensity because of a compromise between phase matching and excitation intensity distribution. 4.Experiment4.1.Experiment Setup and PreparationFrom the above theoretical and simulation studies, , , fibril spacing , and excitation wavelength all affect the phase matching and SHG intensity. Next, we will investigate their effects with experiments. The multiphoton microscopy system has been reported previously.11 To control the excitation and emission angles, spatial filters composed of rings with different radii have been designed as shown in Fig. 4. The rings can be inserted in the excitation path, the emission path, or both to control the excitation and emission angles, respectively. The excitation and emission angles can be calculated by , in which is the radius of the ring and is the focal length of the objective. The objective (LUMPLFLN, Olympus) is water immersion and has , focal length , and radius of the back aperture of 3.2 mm. Fig. 4Pictures of the ring filters and schematics of their positioning in the beam path for different experimental conditions: (a) filtering the excitation path, (b) filtering the emission path, (c) filtering both excitation and emission paths, and (d) illustration of SHG excitation spectrum. The solid curves are the SHG emission spectra for different excitation wavelengths from 750 to 950 nm. The dashed line is the SHG excitation spectrum.  Two sets of ring filters are used in this experiment: a larger ring filter set B1 with four concentric rings whose center radii are 1.45, 2.45, 3.45, and 4.45 mm, respectively, where the width of the rings is 0.9 mm. For clear and simple denotation, the four rings’ radii ranges are described as 1 to 2, 2 to 3, 3 to 4, and 4 to 5 mm in the following. A smaller ring filter set B2 with four concentric rings whose center radii are 1.2, 1.7, 2.2, and 2.7 mm, respectively, and the width of the rings is 0.4 mm. In the same way, the rings’ radii ranges are denoted as 1 to 1.5, 1.5 to 2, 2 to 2.5, and 2.5 to 3 mm in the following. The width of the blocking part between the rings is 0.1 mm. Both ring filters have a 1 mm radius circular hole in the center, which selects the excitation or emission beam near the 0 deg angle. The ring filters are fabricated by Agile (Uxbridge, Ontario) using ultrahigh resolution three-dimensional printing. Light can be selected to pass a particular ring by temporarily blocking the other rings with silicone gel. The substrate of the ring filters and the silicone gel have been examined to not pass light in the fundamental and SHG wavelength bands. In Fig. 4(a), filter B1 is placed in the excitation path before the dichroic beam splitter (DM) and objective. The center hole with radius 1 mm ( to 11 deg) and the two rings on B1 with center radii 1.45 mm ( to 22 deg) and 2.45 mm ( to 32 deg) are used. In Fig. 4(b), filter B2 is placed in the emission path. The center hole with radius 1 mm ( to 11 deg) and the four rings with center radii 1.2 mm ( to 17 deg), 1.7 mm ( to 22 deg), 2.2 mm ( to 28 deg), and 2.7 mm ( to 33 deg) are used. In Fig. 4(c), two B1 are placed in the excitation and emission paths simultaneously in order to perform angle selection in both excitation and emission directions with center radii 1.45 mm ( to 22 deg) and 2.45 mm ( to 32 deg). Figure 4(d) shows how an SHG excitation spectrum is obtained. In the experiments, the excitation laser wavelength is tuned from 750 to 950 nm with a 10-nm step size. An SHG emission spectrum (shown as solid curves) is recorded by a spectrometer for each excitation wavelength. The SHG emission wavelength is exactly half of the excitation wavelength. When the excitation wavelength is tuned, the value of the SHG emission intensity is extracted (marked as solid circles) and plotted as a function of the excitation wavelength. The SHG emission intensity as a function of the excitation wavelength is defined as the SHG excitation spectrum (shown as a dashed line). The peak wavelength of the excitation spectrum is the excitation wavelength that produces the strongest SHG intensity. To fairly compare the SHG intensity at different excitation wavelengths, the calibration procedures described in Ref. 11 are conducted, where the laser excitation power, pulse width, and polarization are maintained to be the same, and the transmission coefficients are calibrated at different wavelengths. The tissue samples are mouse tail tendons, from two freshly euthanized mice. All animal experiments were performed according to a protocol approved by the University of British Columbia Committee on Animal Care (certificate #: A10-0338). In each mouse, three pieces of thick tissue samples were excised and further sliced into -thick sections. To reduce the possibility of damaging the tissue, the power shed on the tissue is . Each measurement at one sample location is repeated three times and the results are averaged. The backward SHG excitation spectrum can vary with tissue samples and locations because of the variation in the local collagen microstructure. Therefore, the excitation spectra shown below are some typical spectra that help to clarify the concepts and stimulate discussions. Although the excitation spectrum varies from location to location, the variation of the excitation spectrum excited or collected by different rings still shows some consistent trend. We also compare the experiment results with simulations. The tail tendon is simulated by and . Fibril numbers , , and refractive index are the same as the parameters in Fig. 2. To simulate the angle selection on the excitation and/or emission light by the ring filters, only the light passing through the angle range defined by the corresponding rings is integrated. 4.2.Manipulating the Excitation Beam AngleThe filter setup in Fig. 4(a) is applied to control the excitation beam angle. Figure 5 shows the SHG excitation spectrum from tail tendon excited by the beam without passing the spatial filter, and passing the filter through the center hole ( is 0 to 11 deg), and two rings of B1 with radii from 1 to 2 mm and 2 to 3 mm ( is 12 to 22 deg and 23 to 32 deg), respectively. To demonstrate the peak wavelength change clearly, the normalized spectra are first shown in Fig. 5(a). In Fig. 5(a), the spectrum without any filtering (black) and the spectrum excited by normal incidence beam from the center hole (green) share a similar peak wavelength because the dominant excitation power is from the center hole. The red and blue curves represent the spectra excited by the inner and outer rings of B1 and the peak excitation wavelength shift is clear. Since the beam entering from a larger radius ring has a larger angle, its peak excitation wavelength shifts to a shorter wavelength. Figure 5(b) plots the actual intensities of the excitation spectra. It shows a decrease of SHG intensity when spatial filters are applied, and the SHG intensity drops more significantly with a larger ring. It also demonstrates that the signal from the center hole constitutes a large portion of the total intensity. Since the SHG intensities are excited at different angles, the emitted SHG signals do not overlap spatially, thus, they add up incoherently. The SHG intensity drop is caused by the energy decrease at a larger incidence angle of the excitation beam, which has a Gaussian distribution. In Fig. 5(c), the SHG excitation spectrum with different excitation angles is simulated. A similar trend of the peak wavelength shifting with increasing excitation angle is obtained. Fig. 5(a) The normalized and (b) actual excitation spectrum of mouse tail tendon with the excitation path filtered by ring filter B1; the results are averaged over three measurements at the same location and the error bar shows the standard deviation. The allowed angles are 0 to 11 deg, 12 to 22 deg, and 23 to 32 deg. (c) Simulation results with , , and fibril numbers , for the above angled excitation beams.  In bulk SHG crystals, angle tuning is another mechanism for achieving phase matching in a forward SHG. When the crystal angle is tuned, the peak excitation wavelength that can generate a strong SHG also shifts. However, the angle tuning mechanism may not be able to provide sufficient momentum compensation in backward SHG, where the amount of phase mismatch is dramatic. Meanwhile, the quasi-phase matching mechanism can provide a large amount of momentum compensation in backward SHG due to the virtual momentum from a periodic structure, where the virtual momentum can come from the photonic crystal structure of the collagen fibrils. 4.3.Manipulating the Emission Beam AngleThe setup in Fig. 4(b) is used to control the emission beam angle. Figures 6(a) and 6(b) plot the normalized and actual SHG excitation spectrum, respectively, from tail tendon when filtering the emission beam angle. In Fig. 6(a), the spectrum shape and peak wavelength of SHG from the center hole are similar to the spectrum without any filtering. As expected, from the innermost ring with a radius from 1 to 1.5 mm ( is 12 to 17 deg) to the outermost ring with radius from 2.5 to 3 mm ( is 29 to 33 deg), the peak wavelengths of the excitation spectrum shift from 860 to 800 nm. By examining 10 slices of tissue sections from different parts of two mice, the average peak wavelength shift is . In Fig. 6(b), the actual intensity is shown to drop from the inner to outer rings. When the emission angle is increased by applying the rings, the corresponding incident angle that satisfies phase matching also increases according to . Thus, the SHG intensity drop is also caused by the increase of the incident angle of the excitation beam. Fig. 6One typical type of the (a) normalized and (b) actual excitation spectrum of mouse tail tendon with the emission path filtered by ring filter B2. (c) Another typical type of the normalized excitation spectrum. (d) Simulation results with , , and fibril numbers , for focused excitation beam. The allowed angles are 0 to 11 deg, 12 to 17 deg, 18 to 22 deg, 24 to 28 deg, and 29 to 33 deg.  In Fig. 6(d), the SHG excitation spectrum with different emission angles is simulated. A similar shift of the peak wavelength with increasing emission angle is obtained. The shift is from 860 to 800 nm, which is close to the experimental average shift. The excitation focusing beam is simulated through the method explained in Sec. 3.2. The collection of the emission signal by different rings is simulated by integrating the emitted SHG at different angles over the area of the rings. Another regularly observed spectrum pattern has a falling trend as shown in Fig. 6(c), where the SHG intensity drops down as the excitation wavelength increases. The dropping trend is more significant for a larger radius ring. This pattern may have resulted from an irregularity of the fibril structure in the focal volume. With fewer numbers or irregular organization of fibrils in the depth or lateral direction, the excitation spectrum is broadened because the phase matching condition is relaxed. One of the supporting proofs is the relatively lower actual intensity for this pattern than for the other type of spectrum. Another possibility is that the peak excitation wavelength may be shorter than 750 nm due to fibril spacing variation. The existence of different patterns of SHG excitation spectra shows the complexity of collagen structures in tissues, which deserves further investigation. 4.4.Manipulating Both the Excitation and Emission AnglesFinally, we follow the setup in Fig. 4(c) and use two B1 filters in the excitation and emission path, respectively, to measure the SHG excitation spectrum of the tail tendon samples. The center hole of B1 is not used. In emission and excitation, we use the same radii rings with radii from 1 to 2 mm and 2 to 3 mm ( is 12 to 22 deg and 23 to 32 deg) at the same time to force the excitation and emission angles to be the same. In Fig. 7(a), the two excitation spectra obtained from the two rings are observed to peak at 810 and 850 nm, respectively. Since the excitation and collection angles are the same, the phase matching condition in this experiment is tentatively explained by Eq. (2). To verify which angle component is the source of the collected emission signal, we also measure the spectrum when removing the excitation filter but keeping the emission filter. The results are shown in solid curves in Fig. 7(a). After removing the excitation filter, the peak wavelength of the SHG excitation spectrum is still at 810 and 860 nm, respectively, except that the bandwidth is slightly broadened. The similar SHG excitation spectra with and without the spatial filtering in the excitation path indicate that the main contributing angle component in the excitation comes from . This result shows that angle components in the focused beam contribute to the phase matching for certain excitation wavelengths. Fig. 7(a) Experimental and (b) simulation results of normalized SHG excitation spectrum obtained with both excitation and emission filtering (dash curves), and emission filtering only but no excitation filtering (solid curves), for mouse tail tendon. Simulation parameters are and with fibril numbers , . The allowed and angles are 12 to 22 deg and 23 to 32 deg. 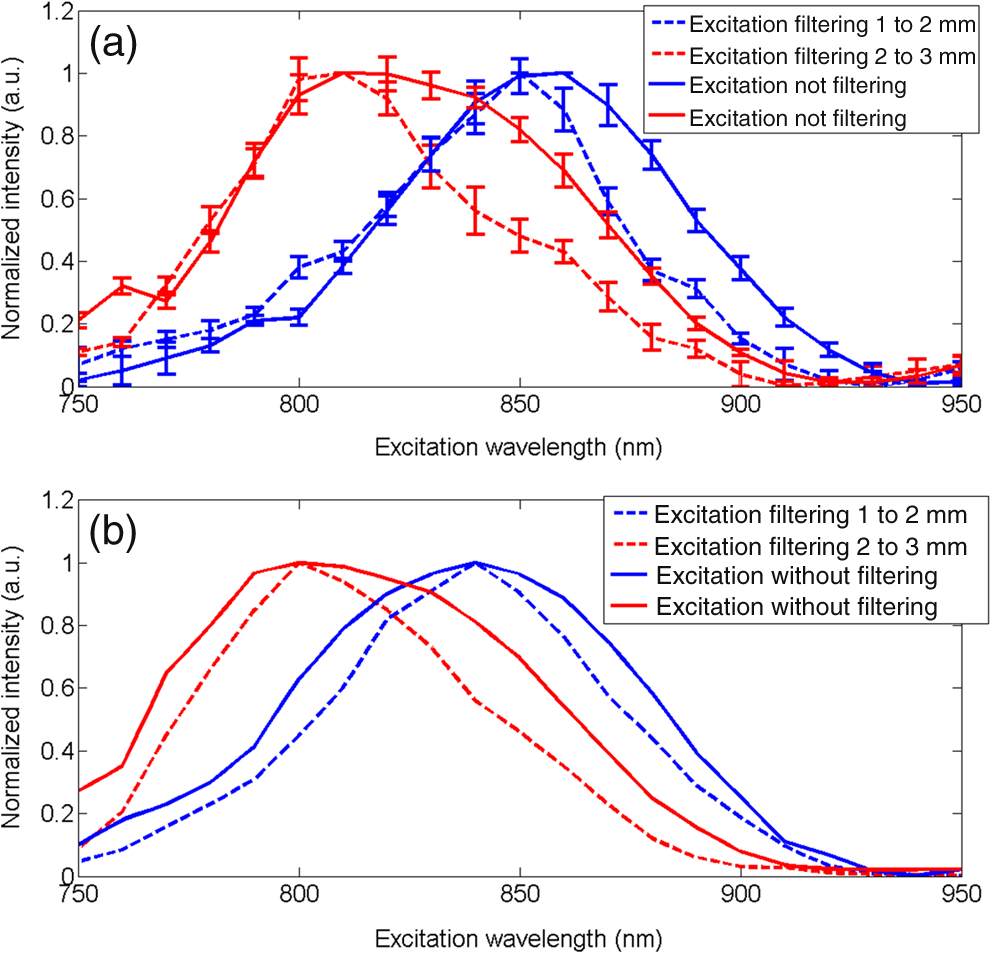 Figure 7(b) shows the simulation results under a similar condition as in the experiment where the spatial filtering is applied or removed in the excitation beam path. The unchanged peak wavelength as well as the effect of bandwidth broadening due to the removal of the B1 filter in the excitation path is very similar to the experimental results. 5.ConclusionsIn this paper, we present a theoretical framework aimed at explaining the mechanism of backward SHG in collagen tissues. It is based on the assumption that the phase matching in the backward direction can be assisted by the virtual momentum provided by the lattice structure consisting of collagen fibrils. By tilting the fundamental and SHG wave vector angles, optimized phase matching can be achieved for particular excitation wavelengths. A larger angle corresponds to a shorter optimized excitation wavelength. Using the plane wave expansion method, the backward SHG intensity in a periodic structure like collagen is solved so that the effect of angle tilting on phase matching is quantitatively evaluated. Besides the lattice structure, the effect of focusing excitation on backward SHG is also analyzed. The excitation spectrum with focusing shows a higher SHG intensity at wavelengths shorter than the peak wavelength because of the multiple incident angles provided by the focused Gaussian beam. In the experiment, by filtering the incident and emission angles of the excitation or emission beam through concentric rings, the relationship among the incident, emission angles, and peak excitation wavelength is validated. The variations of the excitation spectrum with excitation and emission angles are well explained by our theoretical model and numerical simulations. AcknowledgmentsThis work is supported by the Natural Sciences and Engineering Research Council of Canada, the Canada Foundation of Innovation, and the Canadian Institutes of Health Research (Grant # MOP130548). ReferencesI. Freund, M. Deutsch and A. Sprecher,
“Connective tissue polarity optical second-harmonic microscopy, crossed-beam summation, and small-angle scattering in rat-tail tendon,”
Biophys. J., 50
(10), 693
–712
(1986). http://dx.doi.org/10.1016/S0006-3495(86)83510-X BIOJAU 0006-3495 Google Scholar
G. Latour et al.,
“In vivo structural imaging of the cornea by polarization-resolved second harmonic microscopy,”
Biomed. Opt. Express, 3
(1), 1
–15
(2012). http://dx.doi.org/10.1364/BOE.3.000001 BOEICL 2156-7085 Google Scholar
S. P. Tai et al.,
“Optical biopsy of fixed human skin with backward-collected optical harmonics signals,”
Opt. Express, 13
(20), 8231
–8242
(2005). http://dx.doi.org/10.1364/OPEX.13.008231 OPEXFF 1094-4087 Google Scholar
P. J. Campagnola et al.,
“Three-dimensional high-resolution second-harmonic generation imaging of endogenous structural proteins in biological tissues,”
Biophys. J., 82
(1), 493
–508
(2002). http://dx.doi.org/10.1016/S0006-3495(02)75414-3 BIOJAU 0006-3495 Google Scholar
X. Chen et al.,
“Second harmonic generation microscopy for quantitative analysis of collagen fibrillar structure,”
Nat. Protoc., 7
(4), 654
–669
(2012). http://dx.doi.org/10.1038/nprot.2012.009 1754-2189 Google Scholar
A. Lee et al.,
“In vivo video rate multiphoton microscopy imaging of human skin,”
Opt. Lett., 36
(15), 2865
–2867
(2011). http://dx.doi.org/10.1364/OL.36.002865 OPLEDP 0146-9592 Google Scholar
J. Adur et al.,
“Nonlinear optical microscopy signal processing strategies in cancer,”
Cancer Inform., 13 67
–76
(2014). http://dx.doi.org/10.4137/CIN.S12419 Google Scholar
R. W. Boyd, Nonlinear Optics, Academic Press, Boston
(2003). Google Scholar
S. W. Chu et al.,
“Thickness dependence of optical second harmonic generation in collagen fibrils,”
Opt. Express, 15
(19), 12005
–12010
(2007). http://dx.doi.org/10.1364/OE.15.012005 OPEXFF 1094-4087 Google Scholar
M. Han, G. Giese and J. F. Bille,
“Second harmonic generation imaging of collagen fibrils in cornea and sclera,”
Opt. Express, 13
(15), 5791
–5797
(2005). http://dx.doi.org/10.1364/OPEX.13.005791 OPEXFF 1094-4087 Google Scholar
M. Shen et al.,
“Calibrating the measurement of wavelength-dependent second harmonic generation from biological tissues with a crystal,”
J. Biomed. Opt., 18
(3), 031109
(2013). http://dx.doi.org/10.1117/1.JBO.18.3.031109 JBOPFO 1083-3668 Google Scholar
M. Shen et al.,
“Quantifying the back scattering of SHG in tissues with confocal multiphton microscopy,”
J. Biomed. Opt., 18
(11), 115003
(2013). http://dx.doi.org/10.1117/1.JBO.18.11.115003 JBOPFO 1083-3668 Google Scholar
G. Hall et al.,
“Experimental and simulation study of the wavelength dependent second harmonic generation of collagen in scattering tissues,”
Opt. Lett., 39
(7), 1897
–1900
(2014). http://dx.doi.org/10.1364/OL.39.001897 OPLEDP 0146-9592 Google Scholar
R. W. Williams, W. R. Zipfel and W. W. Webb,
“Interpreting second harmonic generation images of collgen I fibrils,”
Biophys. J., 88
(2), 1377
–1386
(2005). http://dx.doi.org/10.1529/biophysj.104.047308 BIOJAU 0006-3495 Google Scholar
R. Lacomb et al.,
“Phase matching considerations in second harmonic generation from tissues: effects on emission directionality, conversion efficiency and observed morphology,”
Opt. Commun., 281
(7), 1823
–1832
(2008). http://dx.doi.org/10.1016/j.optcom.2007.10.040 OPCOB8 0030-4018 Google Scholar
L. Tian et al.,
“Backward emission angle of microscopic second-harmonic generation from crystallized type I collagen fiber,”
J. Biomed. Opt., 16
(7), 075001
(2011). http://dx.doi.org/10.1117/1.3596174 JBOPFO 1083-3668 Google Scholar
M. M. Fejer et al.,
“Quasi-phase-matched second harmonic generation: tuning and tolerances,”
IEEE J. Quantum Electron., 28
(11), 2631
–2654
(1992). http://dx.doi.org/10.1109/3.161322 IEJQA7 0018-9197 Google Scholar
V. Berger,
“Nonlinear photonics crystals,”
Phys. Rev. Lett., 81
(19), 4136
–4139
(1998). http://dx.doi.org/10.1103/PhysRevLett.81.4136 PRLTAO 0031-9007 Google Scholar
A. Arie, N. Habshoosh and A. Bahabad,
“Quasi phase matching in two-dimensional nonlinear photonics crystals,”
Opt. Quantum Electron., 39
(4–6), 361
–375
(2007). http://dx.doi.org/10.1007/s11082-007-9102-8 OQELDI 0306-8919 Google Scholar
A. Cowan and J. Young,
“Mode matching for second-harmonic generation in photonic crystal waveguides,”
Phys. Rev. B., 65
(8), 085106
(2002). http://dx.doi.org/10.1103/PhysRevB.65.085106 Google Scholar
J. Martorell, R. Vilaseca and R. Corbalan,
“Second harmonic generation in a photonic crystal,”
Appl. Phys. Lett., 70
(6), 702
–704
(1997). http://dx.doi.org/10.1063/1.118244 Google Scholar
K. Sakoda, Optical Properties of Photonic Crystals, 2nd ed.Springer Science & Business Media, Germany
(2005). Google Scholar
R. O. Prum and R. H. Torres,
“Structural colouration of mammalian skin: convergent evolution of coherently scattering dermal collagen arrays,”
J. Exp. Biol., 207
(12), 2157
–2172
(2004). http://dx.doi.org/10.1242/jeb.00989 JEBIAM 0022-0949 Google Scholar
D. B. Ameen, M. F. Bishop and T. Mcmullen,
“A lattice model for computing the transmissivity of the cornea and sclera,”
Biophys. J., 75
(5), 2520
–2531
(1998). http://dx.doi.org/10.1016/S0006-3495(98)77697-0 BIOJAU 0006-3495 Google Scholar
M. Maccarana et al.,
“Dermatan sulfate epimerase 1-deficient mice have reduced content and changed distribution of iduronic acids in dermatan sulfate and an altered collagen structure in skin,”
Mol. Cell. Biol., 29
(20), 5517
–5528
(2009). http://dx.doi.org/10.1128/MCB.00430-09 MCEBD4 0270-7306 Google Scholar
S. W. Chu et al.,
“Selective imaging in second-harmonic generation microscopy by polarization manipulation,”
Appl. Phys. Lett., 91
(10), 103903
(2007). http://dx.doi.org/10.1063/1.2783207 APPLAB 0003-6951 Google Scholar
T. C. Battagilia et al.,
“Ultrastructural determinants of murine achilles tendon strength during healing,”
Connect Tissue Res., 44
(5), 218
–224
(2003). http://dx.doi.org/10.1080/03008200390248452 Google Scholar
S. Rigozzi, R. Muller and J. G. Snedeker,
“Relating tendon function to ultrastructure: collagen fibril morphology and mechanical properties of the achilles tendon in two inbred mouse strains,”
(2015) http://www.ors.org/Transactions/55/1427.pdf October ). 2015). Google Scholar
|


