|
|
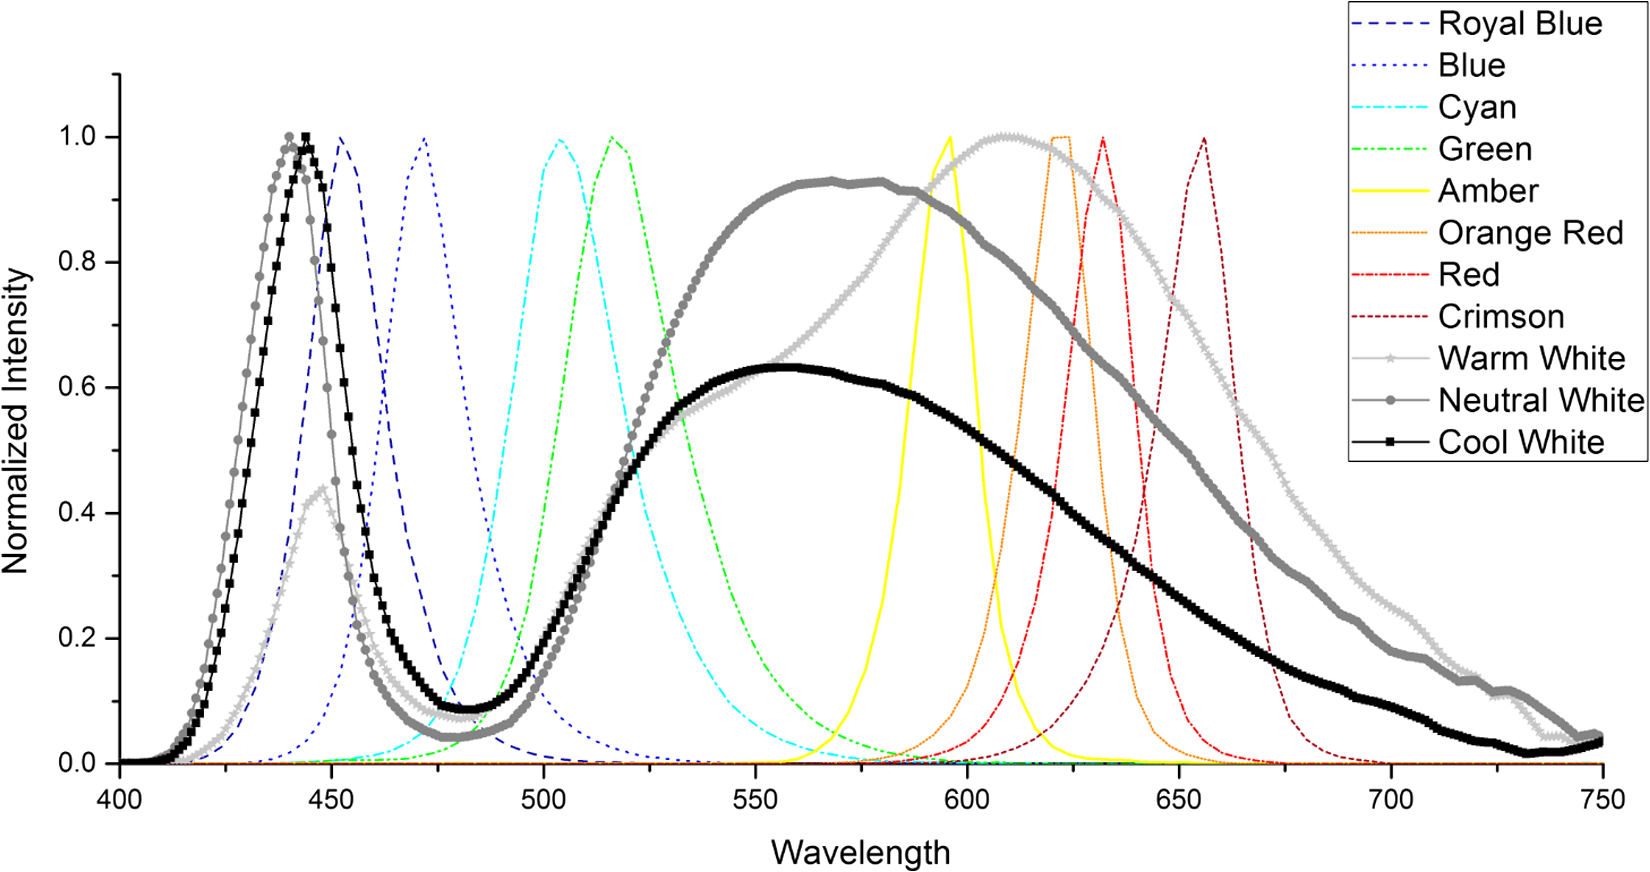
1.IntroductionA surgical lighting system (SLS) is a kind of lighting technique that is usually used to help doctors distinguish organs or tissues more accurately during surgery.1 Lighting in the hospital environment will vary from very simple bedside lamps to operating theater lighting units. The quality of an operating theater’s lighting is defined by a combination of the light’s illumination, shadow control and color rendering index (Ra), and temperature.2 The light beam characteristics, pattern and color, and its luminance are of major importance. Lighting in the operation room has long been provided by traditional light sources, such as incandescent, fluorescent, halogen, and gas discharge lamps.3 Traditional surgical lights composed of xenon, halogen, or metal halide were widely used because of their high luminance and Ra (). This meets the surgeons’ requirements of brightness and color rendering. However, a conventional lighting environment produces a lot of heat leading to the waste of energy and a short lifetime.4–6 Recently, light-emitting diode (LED)-based surgical light has begun to be used. LED lights are smaller, save energy, have a longer life, and have greater portability over traditional light sources. In addition, traditional light sources have their own spectrum distribution, so extra filters were needed to change the spectrum.7 LED lights can solve that problem by light mixing and can be widely used in modern surgical situations.8,9 The world’s first surgical procedure using LED lighting was performed in 2000.10 In 2008, Rahman et al.11 used an LED light for early oral cancer detection. LED-based surgical light that improves texture visibility by switching to light sources with different spectra is now available.12–15 Lee et al.16 obtained optimal illumination to differentiate objects with distinct absorption and scattering properties. With the rapid development of lighting materials, much research has been done to find a surgical light that not only provides bright lighting with a high Ra but also helps the surgeon identify specific tissues during an operation.17–19 The early detection and effective diagnosis of focal lesions can improve the success ratio of surgery.20 For example, Wang et al.21 found that inspection of the oral cavity, which contains mucous membrane, the tongue, and parts of the larynx, was a fundamental diagnostic tool for doctors to investigate diseases such as viral infection, enterovirus, herpetic gingivostomatitis, and oral cancer. They also describe a color image reconstruction method that enables both direct visualization and direct digital image acquisition from one oral tissue by using various light sources and color compensating filters. Shimada et al.22 tried to place a light module composed of different colored LEDs at the tip of the retractor to observe kinds of tissues, such as arterial blood, liver, lung, and nerve. They found that a light source suitable for use in distinguishing these tissues from their background can be obtained by mixing blue or bluish green light, with a wavelength of about 495 nm, and red light of about 615 nm. Meanwhile, Burton et al.23 incorporated an LED array into microscopy and endoscopy systems and studied contrast enhancement under LEDs of multiple colors, alone or in combination. However, previous research was based only on analysis of the biological properties of tissues and the evaluation of images was focused on their gray level contrast. We aimed to develop a new methodology to enhance tissue luminance contrast based on a spectral comparison that is valid for the entire visible light band. Luminance contrast was an important contrast perception stressed in the display and is more easily calculated compared to color contrast calculation. Wang and Chen24 proved that luminance contrast was one of the main factors that could substantially affect visual performance and display quality. They found that the effect of luminance contrast on subjects’ visual acuity and perception was significant and consistent. Meanwhile, Alexander Toet showed that most degradations of digital video images are luminance related (blur and low contrast), while color defects are often negligible in unprocessed images.25 Therefore, any color space where luminance is one of the coordinates, is adequate for enhancement and restoration. In fact, luminance contrast and adjustment were applied in much research to achieve image contrast enhancement. For example, Chen et al. utilized the grayscale of the image in a more controlled and efficient manner to get a better image quality.26 Tsai and Yehet al.27 proposed an automatic and parameter-free contrast enhancement algorithm focused on luminance distribution shaping for color images. They transformed the RGB color space into an HSV color space to extract the image luminance distribution information, and the original image was enhanced by a piecewise linear-based enhancement method. Caselles et al.28 proposed a novel approach for shape preserving contrast enhancement of both gray and color images, achieved by means of a local histogram equalization algorithm which preserves the level-sets of the image. The color image was showed in a YIQ color space and a local histogram modification algorithm has been applied to the luminance image Y (maintaining IQ) to achieve high contrast results. 2.Methods2.1.SpecimenPorcine heart tissues were cleaned and fixed on the lab table under LED illumination. Anticoagulant heparin was dropped into fresh arterial blood of adult sheep to prevent condensation. The ethics committee of Zhejiang University approved the study. 2.2.ApparatusThe light source used here is the LED ceiling system constructed by Zhejiang University, which is an LED panel with a size of integrated with 1700 LEDs (11 kinds of LEDs, specifications shown in Table 1). The 11 high power LEDs consisted of eight color LEDs and three white LEDs with different correlated color temperatures (CCTs), whose spectral distributions (SPD) are all given in Fig. 1. The luminance level of each LED can be controlled via the LED control circuit and software was developed to generate the light with the target SPD based on a light matching algorithm and the feedback signal from a spectrometer. Table 1Light-emitting diode (LED) specifications.
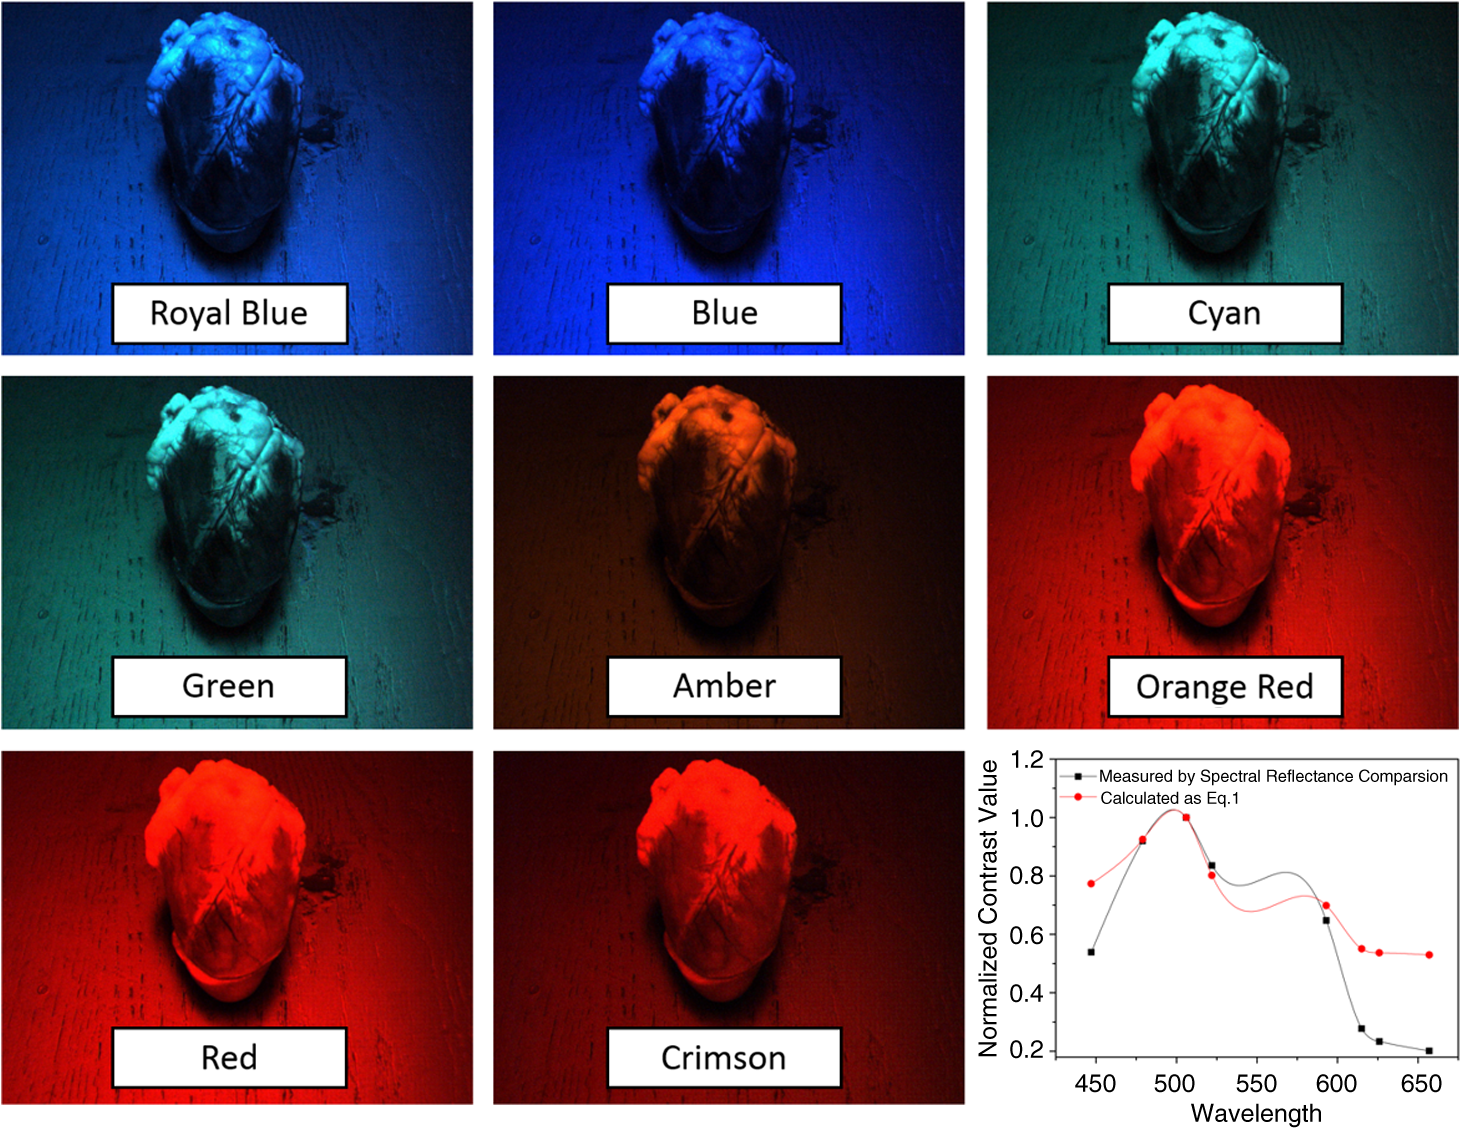
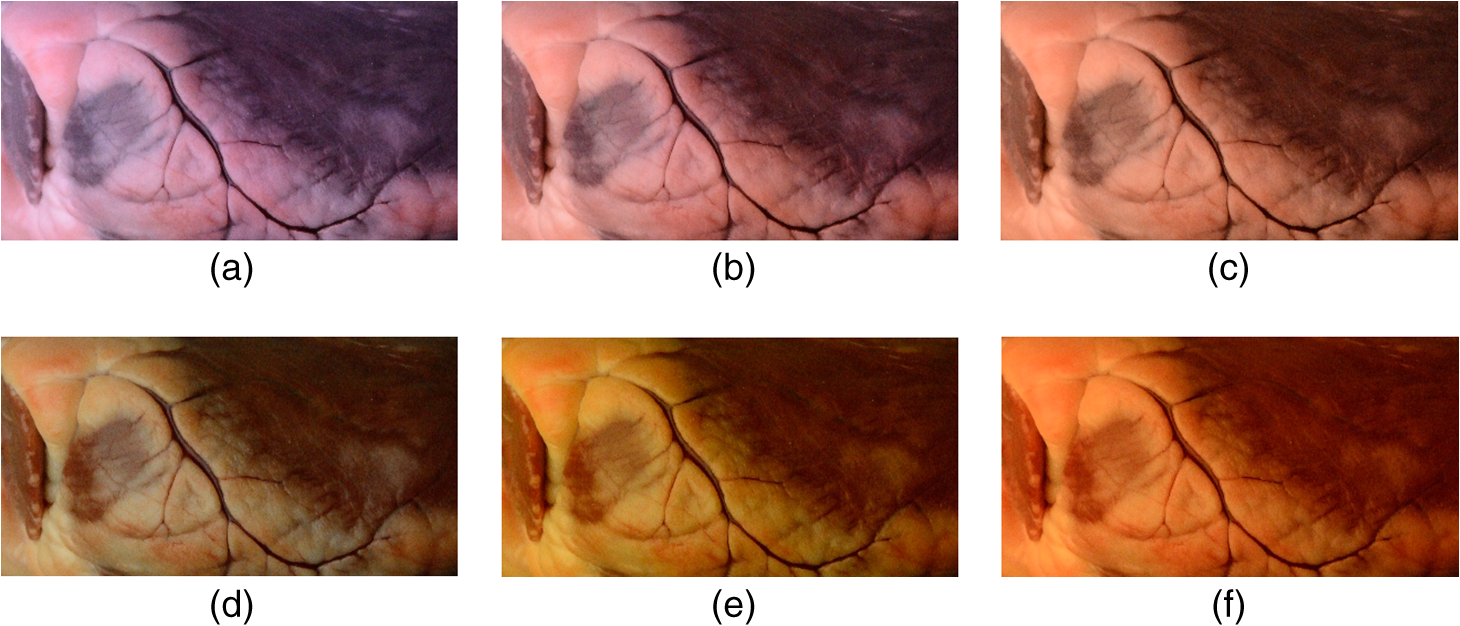
Images of specimens were obtained using a charge-coupled device (CCD) camera. A commercially available 8-bit CCD camera DFK 31BU03 with a pixel resolution of is used here. It was made by the Imaging Source, Germany. It is interfaced using a Universal Serial Bus (USB2.0). Output RAW image files were analyzed by using self-developed software based on MATLAB. Reflection spectra were acquired using a spectroradiometer. The spectrometer adopted is PR655 SpectraScan produced by Photo Research Inc. For PR655, the measurement range covers 380 to 780 nm with an average bandwidth of 4 nm. The spectral data also can be transported through the USB port. Before the experiments, the camera and the spectrometer were all calibrated with the D65 standard light source. A multispectral imaging system was used in the acquisition of spectral reflectance of porcine fat tissues. It was self-developed by the Department of Information Science and Electronic Engineering of Zhejiang University.29 As illustrated in Fig. 2, the multispectral imaging system consists of a monochrome camera and a filter wheel. The filter wheel contains 11 filters and is installed between the camera and the lens. With this system, the spectral reflectance of a sample can be obtained at pixel-level resolution and with a spectral resolution ranging from 400 to 700 nm with 10-nm intervals. In their system, they developed an improved reflectance reconstruction method by adaptively selecting training samples for the autocorrelation matrix calculation in the Wiener estimation. The 11 filters were all specifically designed. With adaptive Wiener estimation method, only 11 image channels were used in the system and it can output 30 reflectance data with a 10-nm interval. 2.3.Spectral Reflectance Comparison Model for Wavelength SelectionUsing different colored LEDs in surgical lighting requires a method to select the proper wavelengths. The traditional wavelength selection method was focused on the color difference of tissues in multipictures, which required a lot of time to complete the complicated calculation in the data process. Here, the spectral reflectance comparison (SRC) model was developed to find the wavelengths, which made the biggest difference in reflectance comparison between blood vessels and background tissues. Tissues under these wavelengths will have a strong gray contrast in the display image, which will help the surgeon easily identify them. Only the spectral reflectance of target tissues was necessary for the whole data processing, which took much less time and was easily applied. Therefore, the spectral reflectance is vital to the selection of the wavelengths used to mix white light. We measured spectral reflectance using spectroradiometer PR655 and then performed multispectral analysis to prove that the measurement was correct. The spectral reflectance of fat measured with a spectroradiometer is shown in Fig. 3(a). For multispectral image analysis, we selected two regions of interest (ROIs) in the specimen, each containing fat tissue [Fig. 3(c)] and obtained their spectral reflectance [Fig. 3(b)]. Comparison of the results of the two methods showed that they matched. However, the spectral resolution of the spectroradiometer chosen was 4 nm while that of multispectral imaging system was 10 nm. Thus, we adopted direct measurement with the spectroradiometer as it had better resolution. Fig. 3(a) Spectral reflectance of fat in regions of interest (ROI) [circled in (c)] scanned by a spectroradiometer directly. (b) Spectral reflectance of two sampling points [marked in (c)] obtained by multispectral image analysis. (c) Fresh porcine specimen.  We obtained the reflectance spectra of blood and background tissue separately using the same incident light. Equation (1) demonstrates the comparison of two tissues’ spectral reflectances by the ratio of their reflectivity: where and are the reflectance spectra of blood and background tissue, respectively, and is the incident light. was obtained by scanning the background tissue directly using the spectroradiometer.2.4.Image EvaluationThe standard image evaluation method focuses on gray level contrast. We added entropy analysis to the evaluation process to evaluate the image quality with respect to tissue texture and the details that were shown. Contrast was quantified using our evaluation function in Eq. (2), which combines entropy analysis and brightness contrast: We define the parts of Eq. (2) as follows: where is a correction factor, is the probability of every gray value occurring in the image, and is the gray value of the pixel.is the entropy of the ROIs in the input image. Image entropy is used in the evaluation of the texture of images is the probability of gray value occurring in the image and changes from 0 to 1, where 1 means that the image is a solid color and entropy is 0. A higher entropy value indicates that the image has more detail, which means the texture is refined. Thus, expresses the distribution of gray values in the ROIs and the amount of information in them. When the image is a solid color, there is no information and is 0. While characterizes the texture of the tissue, reflects the gray level contrast of two different tissues in an image. For example, our experiment focused on the contrast between blood vessels and background tissue. An image with these two parts could be acquired by a CCD camera and then changed into a grayscale image. The gray values of the pixels in the blood vessels and background parts of the image are calculated separately. and are the number of pixels selected in the images of the blood vessels and the background tissue, respectively. The average gray value for the two tissues is calculated and then the value for blood vessels is divided by that for the background to form . A higher value means a higher brightness contrast. The correction factor is defined according to the purpose of the evaluation. A higher means that there is more emphasis on image resolution; otherwise, highlights the gray level contrast of two specific tissues. In our processing analysis, is defined as where is the maximum entropy of the comparative images and is the maximum brightness contrast of the comparative images. is set to ensure that the emphasis on image information and gray value contrast is appropriate. can be adjusted as needed.3.Experiment and Results3.1.Spectral Reflectance Comparison Model ValidationThe spectroradiometer scanning region is a circular zone [as in Fig. 3(c)]. The artery vessel was too small to fill the zone, so we obtained reflectance spectra of blood vessels by scanning the fresh ovine blood (into which heparin was dropped) instead. Figure 4 showed the wavelength selection process. Incident lights of artery vessels and background myocardium tissue were the same and the spectral radiance is shown in Fig. 4(a). Reflectance spectra of two tissues were measured as in Figs. 4(a) and 4(c). The SRC results, , shown in Fig. 4(d), imply that the spectral components between 450 and 550 nm contribute the most to the identification of blood vessels that have a meat background. Fig. 4(a) Spectral radiance of incident light. (b) Reflectance spectral radiance by PR655 scanning of fresh ovine blood. (c) Reflectance spectral radiance of ovine myocardium tissue measured directly. (d) Comparison of spectral reflectance, , of blood and background myocardium tissue.  To verify the accuracy and stability of the measured results, an ovine heart was set and imaged (shown in Fig. 5) under eight monochromatic LEDs (data given in Table 1). The gray level contrast () values of blood and background myocardium tissue in each image were calculated and are shown in Fig. 5. Meanwhile, the gray level contrast of the artery vessel and background myocardium changed with the LED wavelengths and could be extracted by SRC (Fig. 4); the extracted result is plotted in Fig. 5 (bottom right panel). We found that the trends of the two results were similar. 3.2.Contrast EnhancementBased on the preliminary reflectance comparison result in Fig. 4(d), light in the 450 to 550 nm range was found to be helpful in identifying blood vessels. Therefore, we chose LEDs with wavelengths of 479, 506, and 522 nm between our 11 kinds of LEDs to mix the light. In addition, we added a 593-nm wavelength light in the selection group to mix with white light. Then warm (3000 K), neutral (4100 K), or cool (6000 K) white light was mixed with the selected LEDs. Specimens (cleaned ovine heart tissues) were imaged under the three compound lights and the three commercial white LEDs separately (two examples are shown in Fig. 6). In Fig. 6(a), region A, which contained both heart artery vessel and background myocardium tissue, was used for brightness contrast analysis using the evaluation function. Region B, which contained mainly artery vessels and background myocardium tissue, was used to analyze the gray level contrast [ in , Eq. (2)]. The result of the analysis is shown in Fig. 6(b). A higher value means a higher illumination quality. The gray level contrast values of the specimen under mixed white light and different CCTs were higher than those under commercial white LEDs. Fig. 6(a) Ovine heart imaged under white light, where region A was used for entropy analysis and region B for gray contrast analysis. (b) Evaluation function value (normalized) for six LED illuminations; mixed white light (black bars), and commercial white LEDs (red bars) with different correlated color temperatures. 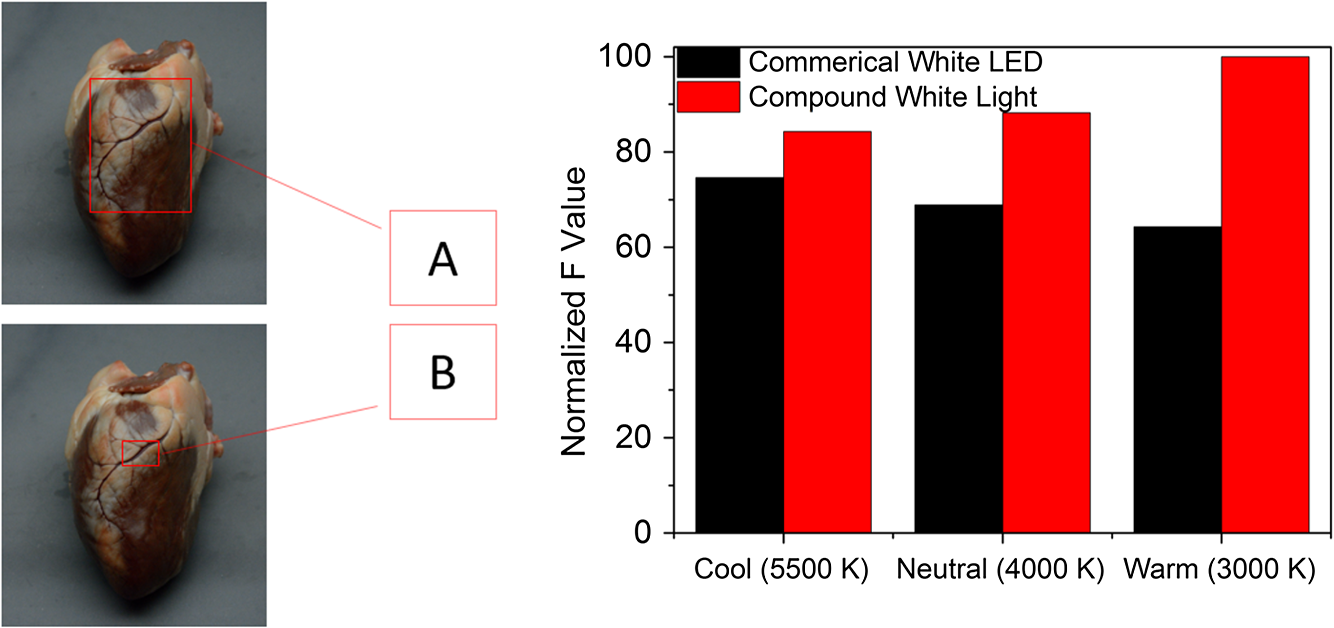 Figures 7(a)–7(c) are images of the ovine heart taken under mixed white light and Figs. 7(d)–7(f) are images taken under commercial warm, neutral, and cool white LEDs. The contrast of blood vessels and background tissues is low in Fig. 7(f), while details were lost in Fig. 7(e). The images in Figs. 7(a)–7(c) have higher contrast and sharpness. 3.3.Validation Using the New ApproachThe traditional image evaluation method focused mainly on gray value contrast, which ignores the value of the details of the tissue in the image. Our evaluation function [Eq. (2)], which includes entropy analysis, can solve this problem because it balances the two parts. Figure 8 shows gray images of the same tissue under two different lighting conditions. The gray value contrast of artery vessels and background myocardium tissue in the two images was the same (); however, the image captured under the mixed white light had a higher value (83.27) than the image taken under the commercial white LED (77.04). Fig. 8Gray image of ovine heart captured in (a) mixed cool white light (5500 K), with the white balance set at 5650 K and (b) commercial cool white light (5500 K), with the white balance set as a standard bulb.  The two images in Fig. 8 would show the same quality performance with the traditional image evaluation method because only the gray level contrast is considered. However, there is more detail and texture information in the red box region of the ovine heart in Fig. 8(a) than in that of Fig. 8(b). The mixed white light with an optimal spectrum achieved a better performance as diagnostic lighting. 4.Discussion and ConclusionsWe have successfully replaced the traditional lamps used in surgery with Philips LEDs to provide efficient illumination. LED lights are smaller, save energy, and last longer. However, the most significant advantage of LED light is that the spectral components can be adjusted based on the absorption spectra of living body tissues to offer high-quality illumination with contrast enhancement. In our study, we compared reflectance spectra to enhance the tissue contrast. Based on the analysis of the results of the spectral comparison, images of ovine heart tissues were captured under customized LEDs and commercially available Philips LEDs. The contrast acquired by the new evaluation method demonstrates that the features are more visible when customized LED illumination is used. Thus, an inexpensive and highly efficient light source with a flexible SPD is available for use in surgery to provide illumination for significant tissue identification. Only blood and external tissues were used as specimens in our experiment. We discussed the spectral components that contributed to the contrast of artery vessels and background myocardium tissue, but more experiments are needed using different organs if LED illumination is to be used for clinical situations. The optimal light for blood and background tissues discrimination may lead to the low contrast of other tissues. Thus, a tradeoff may need to be made between the contrasts of different pairs of tissues during the wavelengths selection. In the experiment, we used ex-vivo tissues as the specimen because the spectrum reflectance of in-vivo tissue was difficult to measure. Additionally, the image of in-vivo tissues was hard to obtain and analyze in time. This may affect the wavelength selection. In a later experiment, an endoscope technique can be used to capture the tissue image and complete the in-vivo case research. In addition, the focus on contrast enhancement in this paper was put on the CCD display because the image display is an import tool in operations. However, in many cases, doctors complete the operation using their eyes directly, thus the research about light optimization with human eyes is also vital. Therefore, the contrast of different tissues under human eyes is also an important part of SLS lighting to study. Meanwhile, the performance of the LEDs with color rendering must be taken into consideration because it is an important characteristic of medical light sources. The customized LEDs used in our experiment were monochromatic light, which leads to a low Ra of about 40. The average Ra of a medical white LED needs to be at least 85. We needed to improve the Ra if LED light is to be used in the hospital. We solved this problem by mixing customized LEDs with the original broadband lamps. The proportion of each can be adjusted to control the balance between the contrast value and Ra. The rapid development in LED technology indicates that LEDs will be used extensively in the surgical field. AcknowledgmentsThe authors acknowledge funding support from the National Science Foundation China (Grant No. 61327902) and the Philips Brain Bridge Project. ReferencesA. J. Knulst et al.,
“Indicating shortcomings in surgical lighting systems,”
Minimally Invasive Ther. Allied Technol., 20
(5), 267
–275
(2011). http://dx.doi.org/10.3109/13645706.2010.534169 Google Scholar
T. Dumbleton et al., Buyers’ Guide: Operating Theatre Lighting, NHS Purchasing and Supply Agency, West Yorkshire
(2010). Google Scholar
N. T. Clancy et al.,
“Light Sources for single-access surgery,”
Surg. Innovation, 19
(2), 134
–144
(2012). http://dx.doi.org/10.1177/1553350611421021 Google Scholar
J. Akridge,
“Illuminating advances in surgical lighting,”
Healthcare Purch. News, 32
(2), 4
(2008). Google Scholar
W. C. Beck and R. F. Heimburger,
“Illumination hazard in the operating room,”
Arch. Surg., 107
(4), 560
–562
(1973). http://dx.doi.org/10.1001/archsurg.1973.01350220044011 Google Scholar
A. Hensman et al.,
“Total radiated power, infrared output, and heat generation by cold light sources at the distal end of endoscopes and fiber optic bundle of light cables,”
Surg. Endosc., 12
(4), 335
–337
(1998). http://dx.doi.org/10.1007/s004649900665 Google Scholar
N. T. Clancy et al.,
“Development and evaluation of a light-emitting diode endoscopic light source,”
Proc. SPIE, 8214 82140R
(2012). http://dx.doi.org/10.1117/12.909331 Google Scholar
A. C. Lee et al.,
“Solid-state semiconductors are better alternatives to arc-lamps for efficient and uniform illumination in minimal access surgery,”
Surg. Endosc., 23
(3), 518
–526
(2009). http://dx.doi.org/10.1007/s00464-008-9854-7 Google Scholar
S. Muthu, F. J. Schuurmans and M. D. Pashley,
“Red, green, and blue LEDs for white light illumination,”
IEEE J. Sel. Top. Quantum Electron., 8
(2), 333
–338
(2002). http://dx.doi.org/10.1109/2944.999188 Google Scholar
J.-I. Shimada et al.,
“The innovations with the medical applications of white LEDs and the breakthrough for new business,”
Proc. SPIE, 6134 613408
(2006). http://dx.doi.org/10.1117/12.645967 Google Scholar
M. Rahman et al.,
“Low-cost, multimodal, portable screening system for early detection of oral cancer,”
J. Biomed. Opt., 13
(3), 030502
(2008). http://dx.doi.org/10.1117/1.2907455 Google Scholar
A. Chi, H. Yoo and M. Ben-Ezra,
“Multi-spectral imaging by optimized wide band illumination,”
Int. J. Comp. Vision, 86
(2–3), 140
–151
(2010). http://dx.doi.org/10.1007/s11263-008-0176-y Google Scholar
A. R. Harvey et al.,
“Spectral imaging in a snapshot,”
Proc. SPIE, 5694 110
–119
(2005). http://dx.doi.org/10.1117/12.604609 BOEICL 2156-7085 Google Scholar
M. Litorja et al.,
“Development of surgical lighting for enhanced color contrast,”
Proc. SPIE, 6515 65150K
(2007). http://dx.doi.org/10.1117/12.719424 Google Scholar
J.-I. Park et al.,
“Multispectral imaging using multiplexed illumination,”
in IEEE 11th Int. Conf. on Computer Vision,
1
–8
(2007). Google Scholar
M.-H. Lee et al.,
“Optimal illumination for discriminating objects with different spectra,”
Opt. Lett., 34
(17), 2664
–2666
(2009). http://dx.doi.org/10.1364/OL.34.002664 Google Scholar
K. Gono et al.,
“Endoscopic observation of tissue by narrowband illumination,”
Opt. Rev., 10
(4), 211
–215
(2003). http://dx.doi.org/10.1007/s10043-003-0211-8 Google Scholar
M. Sambongi et al.,
“Analysis of spectral reflectance using normalization method from endoscopic spectroscopy system,”
Opt. Rev., 9
(6), 238
–243
(2002). http://dx.doi.org/10.1007/s10043-002-0238-2 Google Scholar
F. Wieringa et al.,
“Remote non-invasive stereoscopic imaging of blood vessels: first in-vivo results of a new multispectral contrast enhancement technology,”
Ann. Biomed. Eng., 34
(12), 1870
–1878
(2006). http://dx.doi.org/10.1007/s10439-006-9198-1 Google Scholar
K. Murai, H. Kawahira and H. Haneishi,
“Improving color appearance of organ in surgery by optimally designed LED illuminant,”
in World Congress on Medical Physics and Biomedical Engineering, 26–31 May 2012,
1010
–1013
(2013). Google Scholar
H.-C. Wang et al.,
“Enhanced visualization of oral cavity for early inflamed tissue detection,”
Opt. Express, 18
(11), 11800
–11809
(2010). http://dx.doi.org/10.1364/OE.18.011800 Google Scholar
J.-I. Shimada et al.,
“Surgical retractor with RGB-white LEDs,”
Proc. SPIE, 6910 69100T
(2008). http://dx.doi.org/10.1117/12.761979 Google Scholar
K. Burton et al.,
“Contrast enhancement in biomedical optical imaging using ultrabright color LEDs,”
Proc. SPIE, 6441 64411I
(2007). http://dx.doi.org/10.1117/12.712401 Google Scholar
A.-H. Wang and M.-T. Chen,
“Effects of polarity and luminance contrast on visual performance and VDT display quality,”
Int. J. Ind. Ergon., 25
(4), 415
–421
(2000). http://dx.doi.org/10.1016/S0169-8141(99)00040-2 Google Scholar
A. Toet,
“Multiscale color image enhancement,”
in Int. Conf. on Image Processing and its Applications,
583
–585
(1992). Google Scholar
Z. Chen et al.,
“Gray-level grouping (GLG): an automatic method for optimized image contrast Enhancement-part I: the basic method,”
IEEE Trans. Image Process., 15
(8), 2290
–2302
(2006). http://dx.doi.org/10.1109/TIP.2006.875204 Google Scholar
C.-M. Tsai and Z.-M. Yeh,
“Contrast enhancement by automatic and parameter-free piecewise linear transformation for color images,”
IEEE Trans. Consumer Electron., 54
(2), 213
–219
(2008). http://dx.doi.org/10.1109/TCE.2008.4560077 Google Scholar
V. Caselles et al.,
“Shape preserving local histogram modification,”
IEEE Trans. Image Process., 8
(2), 220
–230
(1999). http://dx.doi.org/10.1109/83.743856 Google Scholar
H.-L. Shen et al.,
“Reflectance reconstruction for multispectral imaging by adaptive Wiener estimation,”
Opt. Express, 15
(23), 15545
–15554
(2007). http://dx.doi.org/10.1364/OE.15.015545 Google Scholar
BiographyJunfei Shen is a PhD candidate at Zhejiang University. His current research interests include optical design, biomedical imaging, and applications for LED products. Huihui Wang is a PhD candidate at Zhejiang University and Eindhoven University of Technology. Her current research interests include interaction between light and material and measurement and application of light-emitting diode light. Yisi Wu is a PhD candidate at Zhejiang University. His current research interests include far-field microscopy imaging and super-resolution analysis. An Li is a PhD candidate at Zhejiang University. His current research interest is focused on the distortion correction calculation. |