|
|
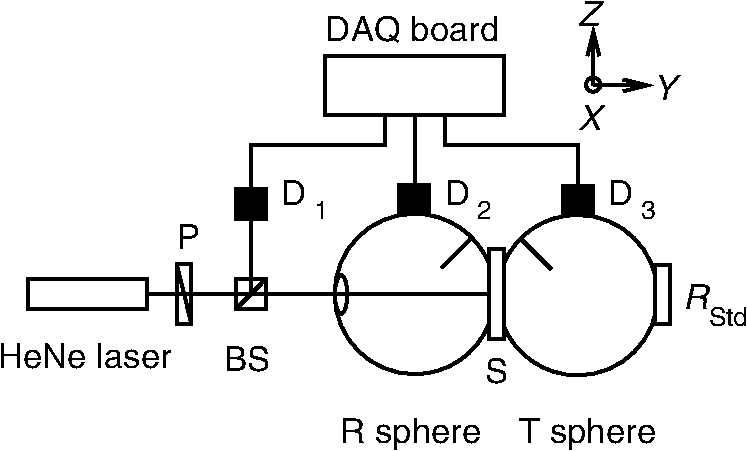
1.IntroductionThe biomedical community relies on phantoms mimicking the optical properties of tissues to develop, test, and/or calibrate biomedical optical devices. These tissue-simulating phantoms can be built using different types of scatterers [ powder, lipid emulsion (i.e., intralipid), size-calibrated microspheres of polymer, or glass], an absorber (ink, molecular dyes), and supporting materials (aqueous suspension, silicon, polyurethane resin).1–4 The chosen components are then mixed and sometimes cured (solid phantoms). Ultimately, the optical properties of the resulting phantoms (absorption coefficient ; scattering coefficient ; scattering anisotropy factor ; refractive index ) need to be measured. The base material refractive index, , can be estimated by an independent measurement2 or is known from the literature.5 Different model-based approaches can be used to infer the remaining optical parameters from experimental data. Photon transport in biological tissues and phantoms can be simulated by Monte Carlo modeling6,7 that launches and tracks a large number of photons subjected at random to absorption and scattering events. Monte Carlo simulations can accurately model the experiment by considering every significant parameter and the specific geometry of the sample but are computationally time consuming as are inversion calculation algorithms based on Monte Carlo simulations.8–10 The optical properties of the sample can be obtained by solving the radiative transport equation (RTE), which is difficult but possible under some simplifying hypotheses. Prahl’s adding-doubling (AD) procedure11 solves the RTE for samples with homogeneous optical properties in an infinite parallel-plane slab geometry and does not consider the polarization of light. The AD algorithm first solves the RTE for a single layer in the single-scattering approximation and computes the total reflectance and transmittance. The reflectance and transmission for a slab twice as thick are achieved by successively adding/doubling the thin slab with proper boundary conditions, and this iteration is repeated until the final desired thickness is reached. The inverse adding-doubling (IAD) routine12 solves for the optical properties of the sample using the measured total reflectance, total transmittance, and additionally the measured unscattered transmittance of ballistic photons that follow Beer–Lambert’s law. Another simplifying approach in solving the RTE is to use the diffusion approximation valid for a medium with high albedo, i.e., . Under these conditions, the RTE is simplified into the diffusion equation that depends on , and on the reduced scattering coefficient, .13,14 The diffusion equation can be formally solved for different types of photon sources.15 In association with these models, many approaches have been used to study the optical properties of biomedical tissues and phantoms. Time-resolved experimental techniques based on the temporal spreading of light pulses while traveling in the sample offer the natural ability to decouple the absorption and scattering effects, since these events differently affect the distribution of photons.16 Indeed, the solution of the time-dependent form of the RTE for a temporal Dirac delta function photon source is the product of the response for an absorption-free medium and a factor (where is the speed of light).17 This property has been used to precisely measure of liquid intralipid/India ink phantoms by using the added absorber technique in which calibrated amounts of absorber are added to the scattering solution.18 The natural logarithm of the ratio of the signals measured for two different concentrations of absorber is then linearly dependent on , the difference between the corresponding values. The absorption coefficient per unit concentration can be accordingly estimated. Some authors also used this property of the RTE to optimize the computation time of look-up-tables (LUT) representing the distribution of photon’s time-of-flight as a function of the optical properties of the sample. They did so by limiting Monte Carlo simulations to absorption-free media with different scattering properties, the absorption contribution being later introduced by multiplying the results by .19,20 Within the diffusion approximation, measurements of liquid phantoms in the time-domain with different source-detector separation have been carried out in reflection for infinite and semi-infinite scattering media20,21 and in transmission for liquid phantoms contained in a cuvette assuming an infinite plane-parallel slab geometry.18 Transmission measurements in the time domain are favored since they are less sensitive to detector-source interactions.19 Solid phantoms have been analyzed with time-domain reflection measurements of semi-infinite scattering media22,23 and transmission measurements of turbid slabs.24–26 Using an inverse Monte Carlo procedure, Bouchard et al.19 measured and of solid tissue-simulating phantom slabs manufactured by the Institut National d’Optique (Biomimic™, INO Inc., Quebec, Canada) with respective uncertainties (coverage factor ) of about 6% and 3.5%. Frequency domain photon migration (FDPM) measurement methods have been developed using an intensity-modulated light source and the detection at some distance from the source of the shift of the mean value of the signal, the amplitude attenuation, and the phase shift relative to the incident light. Solving the diffusion equation for a point source with sinusoidally modulated intensity in the infinite medium approximation or the semi-infinite medium approximation with extrapolated boundary conditions, and could be determined by fitting the model to the data. FDPM offers the possibility of measuring at multiple source-detection distances using a single modulation frequency27,28 [multiple distance (MD) method] or measuring at a fixed source-detection distance with multiple modulation frequencies29 [multiple frequency (MF) method]. The MF method implies a nonlinear fitting procedure of the model to the data, whereas for the MD method, the model is linearly dependent on the distance between the detection points.30 The MD method probes different volumes of the sample, which causes variations of the optical properties in the case of heterogeneous samples. The MD method is favored in the case of homogeneous samples, whereas the MF method can be used for heterogeneous samples.31 Spatial-domain measurement techniques of the optical properties of liquid biomedical phantoms have been carried out in the continuous wave (CW) domain, based on source-detector multidistance measurements of fluence rate under the diffusion approximation and for point-like isotropic sources in infinite medium. Under these assumptions, an effective attenuation coefficient, , was estimated. The scattering properties of the samples were measured with the added absorber technique32 at visible wavelengths. The method of water absorption is similar and can be expanded to the near-infrared regime as well.33,34 For different dilutions of the diffusive medium, i.e., different water concentrations, and assuming that the absorption coefficient of water was known precisely, the optical properties of the diffusive medium were derived from the measurement of . Both methods were aimed at uncoupling absorption from scattering coefficients in . Based on this measurement technique, a diffusive liquid reference standard has been proposed using intralipid as a scatterer with well-defined optical properties, and , to be measured each with variations smaller than 2%.35 One should note that both the added absorber technique and the water absorption method are particularly suited for liquid phantoms. However, liquid phantoms are not ideal for dissemination or round-robin tests; therefore, solid phantoms are preferred as reference standards. Fiber-based multidistance reflectance measurements of tissue or solid biomedical phantoms in the CW domain require that great care is taken to ensure optimal optical coupling at the sample-fiber interfaces.36 Also, measuring tissue in that experimental situation requires that the contact pressure between the sample and the fibers remains low in order to not modify the optical properties. Fixed distances between the source and detection fibers imply a limited number of measurement points that make prior knowledge of the sample optical properties necessary to optimize fiber separation. To circumvent these problems, noncontact measurement techniques allowing continuous source-probe interdistances have been developed using a laser beam or a projected point source and imaging the sample surface or a single surface point at MDs.37,38 Structured illumination is a noncontact alternative version of the measurement of the optical properties of tissues or phantoms. Under normal incidence, a sinusoidal pattern is projected on the samples. Assuming a linear medium, the diffusion equation becomes a one-directional second-order Helmholtz equation for the fluence rate as a function of sample depth, yielding an expression of the diffuse reflectance dependent on the optical parameters, and , and the modulation frequency. The diffuse reflectance shows a different sensitivity to the absorption and scattering properties of the sample for the low- and high-frequency regimes of projected patterns, respectively, allowing the uncoupling of and .39–41 Even though this technique is based on the assumption that the diffuse approximation is valid, forward Monte Carlo simulation showed that this limit can be tweaked to allow using structured illumination of a variety of samples with lower albedos. Measurements of the total reflectance and total transmittance of thin homogeneous biomedical samples can be performed with integrating spheres. These measurements are then used as input data to a light propagation model inversion routine to estimate and . Technically, only a single-integrating sphere is necessary to measure the total reflectance or the total transmittance at the expense of repositioning the sample or the sphere,42,43 both of which may add to the overall uncertainties. For improved measurement accuracy, measurements with double-integrating spheres (DIS) are favored, since the total reflectance and total transmittance are acquired simultaneously with the sample in the same position, under the same illumination conditions and mechanical constraints. However, relevant application of the light propagating model in a DIS setup requires rigorous control of the experimental conditions (e.g., ensuring good contact between the sample and the sample port of both spheres, mitigated finite-size effect of the sample, etc.), so that the model-based interpretation of the measured optical properties of the sample yields accurate values of and . The optical properties of the sample are solved using a Monte Carlo inversion routine10,44,45 or an IAD routine.46–48 An additional measurement of the unscattered transmittance allows independent determination of and . However, low signal levels make this measurement difficult for optically thick samples. Also, multiple scattered photons can be collected leading to erroneous values of the unscattered transmittance. Consequently, the anisotropy factor is often an educated guess from size distribution and Mie theory2 or is borrowed from literature values.9,49 At this time, there is no National Institute of Standards and Technology (NIST)-traceable measurement standard for the calibration of biomedical optical devices, where the key measurements are tissue absorption and scattering properties. This report presents progress toward filling this gap. Our choice of the DIS measurement technique in association with the inversion of the AD algorithm for the implementation of this national reference instrument was based on the ability to cover a broad range of optical properties, offers a fast inversion procedure, and allows for the measurement of solid samples as well as liquid phantoms in a cuvette. Moreover, the DIS measurement technique is even qualified as the “golden standard” method by some authors48 in reference to the numerous studies it was based on. Hence, we establish a DIS-based measurement platform and a data analysis, graphical user interface (GUI), in which variations of experimental configurations and model-based analysis to compute absorption and scattering properties of the samples are implemented. Analysis of the data (total reflectance and total transmittance) is performed with an inversion procedure similar to Prahl’s IAD,12 but our procedure allows for the computation of a complete uncertainty budget for each sample measurement. In our previous work,50 the development of our setup and the method used to compute an uncertainty budget for the measurement of the optical properties of a sample were explained. Since repeatability and validation of the measurement results are essential qualifications of a standardized measurement platform; in this work, we expand to include the measurement of samples with different thicknesses and compare the results to the optical properties measured by the phantom manufacturer. For repeatability tests, three commercially available INO solid biomedical phantoms having the same optical properties and the same lateral sizes but different thicknesses were measured in a CW regime at different sample orientations and polarization angles of the incident light. For validation tests, the results are compared to those measured by the sample manufacturer on an exemplar sample of the same batch. 2.Materials and Methods2.1.Experimental SetupThe experimental setup is shown in Fig. 1. The polarization of an incident HeNe laser beam (, beam diameter 0.80 mm, beam divergence 0.86 mrad, minimum output power 0.75 mW, JDS Uniphase Corporation, Milpitas, California; or , beam diameter 0.80 mm, beam divergence 0.01 mrad, minimum output power 5 mW, Research Electro-Optics, Inc., Boulder, Colorado) is controlled by a linear Glan–Taylor polarizer, P, which is followed by a beam splitter, BS. A reference signal is detected by photodiode to compensate for intensity variations of the laser source. The light is at normal incidence to a sample, S, held between two integrating spheres, R and T (UMBK-190, Gigahertz Optik, Türkenfeld, Germany; internal diameter: 196 mm; entrance port diameter: 25.1 mm; sample port diameter: 63.5 mm reduced to 38.1 mm by a removable port diameter reducer; detector port diameter: 12.7 mm; coated with ODM98 synthetic material). The total reflectance signal and the total transmittance signal are measured by photodiodes and , respectively (, , ; blue enhanced response silicon detector, Edmunds Optics Inc., Barrington, New Jersey). The photocurrent is amplified by three P-9202-6 amplifiers (Gigahertz Optik) connected to a DAQ board (NI PCI-6110, National Instruments Corporation, Austin, Texas) and monitored by a LabVIEW program for data acquisition. A NIST-traceable 99% reflectance standard, , blocks the exit port of the transmittance sphere during the measurements. 2.2.SamplesThe samples are manufactured by INO, Inc. and are commercially available. They consist of a base material, polyurethane, with titanium dioxide () as a scatterer and carbon black as an absorbing component. The samples are designed to match nominal values of optical parameters (, at ). They have a 100-mm-square base and come in three different thicknesses measured with a dial thickness gauge, , 7.09 mm, and 9.92 mm (uncertainty 0.0058 mm). A custom-made holder was used to hold the sample by opposite corners to minimize the contact area. It allows the sample to freely rotate around the - and -axes to ensure flat contact between the sample port of the reflectance sphere and the sample. The lateral position and tilt angle of the sample ports are adjustable to align the incident laser beam normal to the sample surface. The spheres and sample holder are installed on a linear translator aligned along the laser beam to control and minimize mechanical pressure from sample-port contact while ensuring light-tight contact. 2.3.MeasurementsThe experimental procedure requires measuring the total reflectance and the total transmittance of the sample. The measured total reflectance is the ratio of the light intensity reflected from the sample set between both spheres’ sample ports to the intensity reflected from a NIST-certified nominal 99% reflectance standard, , set at the sample port of the reflectance sphere. The measured voltages for the signal channel and the reference channel are and , respectively, with , Standard. Background values of both the signal channel and the reference channel, and , respectively, are measured by blocking the incident beam right after the laser. Hence, where are the normalized intensities computed from the measured voltages with , Standard.The measured total transmittance is the ratio of the light intensity transmitted through the sample set between both spheres’ sample ports to the intensity with no sample. The measured voltages for both the signal channel and the reference channel are and , respectively, with , Empty. Background values of both the signal channel and the reference channel, and , respectively, are measured by blocking the incident beam right after the laser. Hence, where is the normalized intensities computed from the measured voltages for both the signal channel and the reference channel with , Empty.The details on how to measure the optical properties can be found elsewhere.2,12,51 The experimental procedure is based on the substitution method, i.e., the sample port is successively blocked by the sample, the reflectance standard, or left empty. One should note that the measurements in integrating sphere throughput efficiency are sensitive to the reflectance of the internal coating, the internal geometry of the sphere, and the reflectance of the sample placed at the sample port. Hence, corrections reflecting those variations in the sphere are included in our model. The model we used is slightly different from the one used in the IAD algorithm. IAD considers the diameter of the exit port of the transmittance sphere to be set to zero, i.e., it replaces the reflectance of the 99% reflectance standard by the reflectance value of the sphere and, therefore, neglects any effect of the exit port of the transmittance sphere. This is inconsistent with the way the transmittance sphere is calibrated as explained in the IAD manual.12 The thick coating material present in the integrating spheres used in our setup makes it necessary to consider the presence of the exit port of the transmittance sphere. Moreover, the internal geometry of each of our integrating spheres is more complex than the one from the sphere model in the IAD routine. In our case, the additional reflectance surface coming from the baffle and a sample port diameter reducer has to be taken into account. However, for its simplicity, we still use the sphere model from the IAD routine in our computations only after scaling the diameter of the real integrating spheres to the one of a model sphere presenting the same value of the reflectance coefficient of the spheres’ walls. The details are described elsewhere.50 2.4.Data AnalysisThe AD method was used with a modified inversion routine to compute the optical properties of the samples. This modified routine is similar to the IAD procedure from Prahl2,11 but allows for some flexibility in the choice of the model for the integrating sphere. As is the case with IAD, this model takes the normal incident light as well as the light back-scattered by the spheres into account to compute the total hemispherical reflectance and total hemispherical transmittance of the sample.50 A comparison study of the optical properties obtained by analyzing the same set of simulated data by IAD and our inversion routine showed an agreement better than 2% (better than 5% for high-scattering or high-absorbing samples). Using the Guide to the Expression of Uncertainty in Measurement,52 our method also enables the computation of the uncertainty budget for the measurements of the optical properties of the sample by considering the statistical uncertainty (type A uncertainty) on the measurements and the nonstatistical uncertainty (type B uncertainty) on the sample’s parameters, on the integrating spheres’ parameters, on the detectors’ reflectance, and on the calibration standard’s reflectance. The uncertainty propagation is based on the numerical estimation of the sensitivity of the optical parameters of the sample to each experimental parameter and measured signal in order to compute a covariance matrix for the input quantities of the problem. Details on this procedure can be found elsewhere.50 A GUI was developed to facilitate the data analysis. The refractive index of the base material of the phantoms and the scattering anisotropy factor used in the data analysis comes from the values measured by INO at 660 nm, i.e., , and .19 3.Discussion and ConclusionFigures 2 and 3 present the optical properties and measured at and for three 100-mm-square INO phantoms of thicknesses , 7.09 mm, and 9.92 mm. To account for reproducibility of the results, each sample was measured eight times at each wavelength by flipping the face hit by the incident laser beam and rotating the sample 90 deg around the -axis between measurements. The time-domain transmittance technique used by INO requires optically thick samples to allow measurable pulse spreading. This thickness is not applicable in our DIS-based setup, so our results from thinner () samples are compared to the results provided by INO at the same wavelengths on a 20-mm-thick phantom with identical optical properties. The uncertainties in the INO results were estimated from the measurements at .19 Figures 2 and 3 present the results with error bars (i.e., coverage factor ). At , our results are consistent with the values from INO for both and . At , the agreement is only for for both and . However, with a coverage factor , preferred by NIST,53 the optical properties measured here agree with the results provided by INO. Table 1 summarizes the results and the uncertainty with . Fig. 2Results at of (a) , the absorption coefficient, and (b) , the reduced scattering coefficient, versus the thickness of the sample for 100-mm-square INO phantoms. The error bars (coverage factor ) are obtained for each experiment by propagation of the type A and type B uncertainties. The NIST results are compared to the values from INO (mean value and error, dotted lines, and dashed lines, respectively). 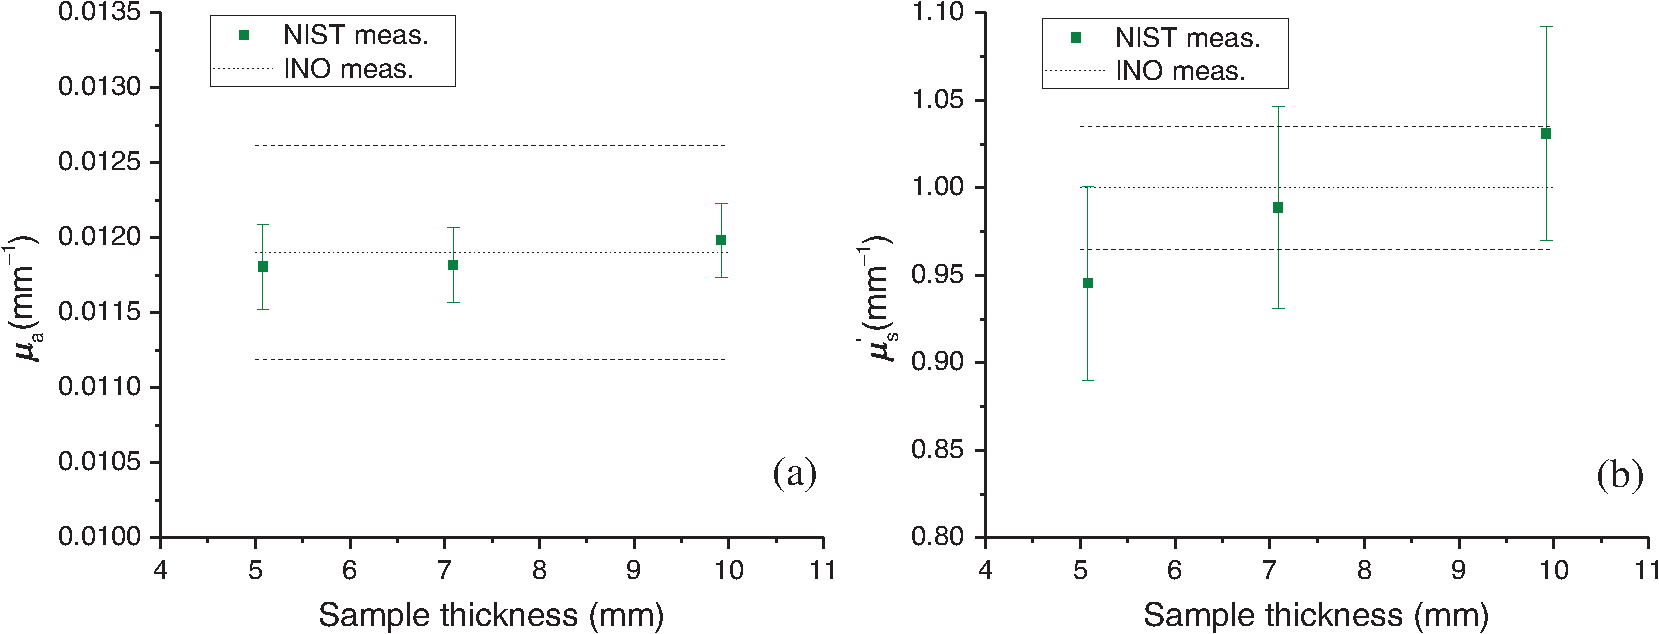 Fig. 3Results at of (a) , the absorption coefficient, and (b) , the reduced scattering coefficient, versus the thickness of the sample for 100-mm-square INO phantoms. The error bars (coverage factor ) are obtained for each experiment by propagation of the type A and type B uncertainties. The NIST results are compared to the values from INO (mean value and error, dotted lines, and dashed lines, respectively).  Table 1Results and uncertainties (k=2) of μa, the absorption coefficient of the sample, and μs′, the reduced scattering coefficient of the sample. The uncertainties on the INO results were estimated from measurements at λ=660.0 nm.19
One major advantage of the time-domain transmittance measurement technique used by INO is that it ensures that the detected photons experience multiple scattering events before detection. Hence, it is less sensitive than DIS to the measurement of the anisotropy factor, . Moreover, the INO procedure uses an inverse Monte Carlo model to take into consideration the photons being reflected or transmitted at the sample boundaries, which is not the case with the AD routine that considers samples of homogeneous optical properties in an infinite plane-parallel slab geometry. However, the geometry of the samples measured here allows for this assumption to be valid. Our setup compensates for the fluctuations of the laser beam intensity by means of a reference channel that requires a beam splitter and control of the polarized light input by a linear polarizer set at a fixed angular position. Within the range of optical properties of tissues, multiple-scattering events are expected to totally depolarize light.54 However, the INO samples have a smooth nonspecular surface and it was a concern that surface reflection captured by the reflectance integrating sphere might show enough of a polarization dependence that the measured optical properties of the sample might be affected. To ensure that the measurements of the reflectance are not sensitive to the chosen polarization angle of the input beam, additional measurements of the optical properties were carried out for different angles of the linear input polarization. For that purpose, a rotating achromatic half-wave plate was set in the incident beam path between the beam splitter and the reflectance sphere. The fast axis of the half-wave plate was initially aligned along the polarization direction set by polarizer P, and the angular orientation of the half-wave plate was incremented by a 15° rotation step. The corresponding polarization orientation, , of the incident beam is , 30 deg, 60 deg, and 90 deg. Figure 4 presents the optical parameters, and , versus measured for one of the INO phantoms (thickness ) at . The values present fluctuations well within the error bars at , so we can rule out any measurable influence of the linear input polarization on the optical parameters measured with our DIS setup. Fig. 4Results at of (a) , the absorption coefficient, and (b) , the reduced scattering coefficient, versus , the angle of the input linear polarization ( corresponds to a vertical linear polarization) for the 100-mm-square INO phantoms of thickness . The error bars (coverage factor ) are obtained for each experiment by propagation of the type A and type B uncertainties. The NIST results are compared to the values from INO (mean value and error, dotted lines, and dashed lines, respectively).  In this paper, we presented measurements of the optical properties of solid biomedical phantoms at and and compared the results to the values obtained from their manufacturer, INO. The samples were measured using our double-integrating-sphere setup in the steady-state domain. The measured data consist of the total transmittance and the total reflectance of the sample, and analysis of the data was based on a custom-made inversion routine of the adding-doubling procedure, which solves the radiative transfer equation iteratively for the data. Our inversion routine computed the optical parameters and the uncertainty budget for each measurement. A GUI was developed to facilitate the data analysis. The samples were three square solid phantoms of thicknesses , 7.09 mm, and 9.92 mm. There is an agreement within the error bars at between our results and the ones from INO at both and and for all thicknesses. The uncertainty in the optical parameters measured was estimated to be between 4.0% and 5.0% for and between 11% and 12% for , compared to 12% and 7%, respectively, obtained by INO.19 With the DIS measurements of the optical properties, the uncertainties on were found to be mainly sensitive to the uncertainty on the scattering anisotropy factor, , and the uncertainty on was mainly dependent on the uncertainty on the incident angle.50 As previously mentioned, the time-domain technique is less sensitive to measurements of , and consequently, the uncertainty on is smaller. Figures 2(a) and 3(a) show values that are thickness independent, whereas in Figs. 2(b) and 3(b), values are also thickness independent within the error bars. However, the mean values of the reduced scattering coefficient have a trend of increasing as a function of the sample thickness. A close consideration of this finite sample-size effect needs to be addressed for more careful analysis, which is the scope of future work. The well-collimated laser source used in our measurements helps reduce the uncertainty in the absorption coefficient.50 Future work in developing this facility will include extending the capabilities to cover a broad spectral range, analyzing liquid samples, and implementing an in-depth analysis of the associated uncertainties. Interlaboratory comparisons with other national metrology institutes will be investigated. AcknowledgmentsCertain commercial materials and equipment are identified in order to adequately specify the experimental procedure. Such identification does not imply recommendation by the National Institute of Standards and Technology. This work was supported by the NIST Innovation in Measurement Science (IMS) program on “Optical Medical Imaging for Clinical Applications” and the NIST intramural research program in the Statistical Engineering Division of the Information Technology Laboratory of NIST. ReferencesB. W. Pogue and M. S. Patterson,
“Review of tissue simulating phantoms for optical spectroscopy, imaging and dosimetry,”
J. Biomed. Opt., 11
(4), 041102
(2006). http://dx.doi.org/10.1117/1.2335429 JBOPFO 1083-3668 Google Scholar
T. Moffitt, Y. C. Chen and S. A. Prahl,
“Preparation and characterization of polyurethane optical phantoms,”
J. Biomed. Opt., 11
(4), 041103
(2006). http://dx.doi.org/10.1117/1.2240972 JBOPFO 1083-3668 Google Scholar
M. L. Vernon et al.,
“Fabrication and characterization of a solid polyurethane phantom for optical imaging through scattering media,”
Appl. Opt., 38
(19), 4247
–4251
(1999). http://dx.doi.org/10.1364/AO.38.004247 APOPAI 0003-6935 Google Scholar
G. J. Greening et al.,
“Characterization of thin poly(dimethylsiloxane)-based tissue-simulating phantoms with tunable reduced scattering and absorption coefficients at visible and near-infrared wavelengths,”
J. Biomed. Opt., 19
(11), 115002
(2014). http://dx.doi.org/10.1117/1.JBO.19.11.115002 JBOPFO 1083-3668 Google Scholar
R. Michels, F. Foschum and A. Kienle,
“Optical properties of fat emulsions,”
Opt. Express, 16
(8), 5907
–5925
(2008). http://dx.doi.org/10.1364/OE.16.005907 OPEXFF 1094-4087 Google Scholar
C. Zhu and Q. Liu,
“Review of Monte Carlo modeling of light transport in tissues,”
J. Biomed. Opt., 18
(5), 050902
(2013). http://dx.doi.org/10.1117/1.JBO.18.5.050902 JBOPFO 1083-3668 Google Scholar
L. Wang, S. L. Jacques and L. Zheng,
“MCML—Monte Carlo modeling of light transport in multi-layered tissues,”
Comput. Methods Programs Biomed., 47
(2), 131
–146
(1995). http://dx.doi.org/10.1016/0169-2607(95)01640-F CMPBEK 0169-2607 Google Scholar
M. Friebel et al.,
“Determination of optical properties of human blood in the spectral range 250 to 1100 nm using Monte Carlo simulations with hematocrit-dependent effective scattering phase functions,”
J. Biomed. Opt., 11
(3), 034021
(2006). http://dx.doi.org/10.1117/1.2203659 JBOPFO 1083-3668 Google Scholar
E. Salomatina et al.,
“Optical properties of normal and cancerous human skin in the visible and near-infrared spectral range,”
J. Biomed. Opt., 11
(6), 064026
(2006). http://dx.doi.org/10.1117/1.2398928 JBOPFO 1083-3668 Google Scholar
A. Roggan et al.,
“Experimental set-up and Monte-Carlo model for the determination of optical tissue properties in the wavelength range 330 to 1100 nm,”
Proc. SPIE, 2323 21
–36
(1995). http://dx.doi.org/10.1117/12.199205 PSISDG 0277-786X Google Scholar
S. A. Prahl, M. J. C. van Gemert and A. J. Welch,
“Determining the optical properties of turbid media by using the adding-doubling method,”
Appl. Opt., 32
(4), 559
–568
(1993). http://dx.doi.org/10.1364/AO.32.000559 APOPAI 0003-6935 Google Scholar
L. V. Wang and H. I. Wu, Biomedical Optics: Principles and Imaging, John Wiley & Sons, Hoboken, New Jersey
(2012). Google Scholar
W.-F. Cheong, S. A. Prahl and A. J. Welch,
“A review of the optical properties of biological tissues,”
IEEE J. Quantum Electron., 26
(12), 2166
–2185
(1990). http://dx.doi.org/10.1109/3.64354 Google Scholar
S. L. Jacques and B. W. Pogue,
“Tutorial on diffuse light transport,”
J. Biomed. Opt., 13
(4), 041302
(2008). http://dx.doi.org/10.1117/1.2967535 JBOPFO 1083-3668 Google Scholar
A. Pifferi et al.,
“Fully automated time domain spectrometer for the absorption and scattering characterization of diffusive media,”
Rev. Sci. Instrum., 78
(5), 053103
(2007). http://dx.doi.org/10.1063/1.2735567 RSINAK 0034-6748 Google Scholar
A. Pifferi et al.,
“Time-domain broadband near infrared spectroscopy of the female breast: a focused review from basic principles to future perspectives,”
J. Near Infrared Spectrosc., 20
(1), 223
–235
(2012). http://dx.doi.org/10.1255/jnirs.980 Google Scholar
L. Spinelli et al.,
“Calibration of scattering and absorption properties of a liquid diffusive medium at NIR wavelengths. Time-resolved method,”
Opt. Express, 15
(11), 6589
–6604
(2007). http://dx.doi.org/10.1364/OE.15.006589 OPEXFF 1094-4087 Google Scholar
J.-P. Bouchard et al.,
“Reference optical phantoms for diffuse optical spectroscopy. Part 1—error analysis of a time resolved transmittance characterization method,”
Opt. Express, 18
(11), 11495
–11507
(2010). http://dx.doi.org/10.1364/OE.18.011495 OPEXFF 1094-4087 Google Scholar
I. Bargigia et al.,
“Time-resolved diffuse optical spectroscopy up to 1700 nm by means of a time-gated InGaAs/InP single-photon avalanche diode,”
Appl. Spectrosc., 66
(8), 944
–950
(2012). http://dx.doi.org/10.1366/11-06461 APSPA4 0003-7028 Google Scholar
A. Liebert et al.,
“Evaluation of optical properties of highly scattering media by moments of distributions of times of flight of photons,”
Appl. Opt., 42
(28), 5785
–5792
(2003). http://dx.doi.org/10.1364/AO.42.005785 APOPAI 0003-6935 Google Scholar
A. Bassi et al.,
“Time-resolved spectrophotometer for turbid media based on supercontinuum generation in a photonic crystal fiber,”
Opt. Lett., 29
(20), 2405
–2407
(2004). http://dx.doi.org/10.1364/OL.29.002405 OPLEDP 0146-9592 Google Scholar
C. Abrahamsson et al.,
“Time and wavelength resolved spectroscopy of turbid media using light continuum generated in a crystal fiber,”
Opt. Express, 12
(17), 4103
–4112
(2004). http://dx.doi.org/10.1364/OPEX.12.004103 OPEXFF 1094-4087 Google Scholar
A. Liebert et al.,
“Fiber dispersion in time domain measurements compromising the accuracy of determination of optical properties of strongly scattering media,”
J. Biomed. Opt., 8
(3), 512
–516
(2003). http://dx.doi.org/10.1117/1.1578088 JBOPFO 1083-3668 Google Scholar
D. Khoptyar et al.,
“Broadband photon time-of-flight spectroscopy of pharmaceuticals and highly scattering plastics in the VIS and close NIR spectral ranges,”
Opt. Express, 21
(18), 20941
–20953
(2013). http://dx.doi.org/10.1364/OE.21.020941 OPEXFF 1094-4087 Google Scholar
T. Svensson et al.,
“Near-infrared photon time-of-flight spectroscopy of turbid materials up to 1400 nm,”
Rev. Sci. Instrum., 80
(6), 063105
(2009). http://dx.doi.org/10.1063/1.3156047 RSINAK 0034-6748 Google Scholar
B. Cletus et al.,
“Characterizing liquid turbid media by frequency-domain photon-migration spectroscopy,”
J. Biomed. Opt., 14
(2), 024041
(2009). http://dx.doi.org/10.1117/1.3119282 JBOPFO 1083-3668 Google Scholar
S. Fantini et al.,
“Quantitative determination of the absorption spectra of chromophores in strongly scattering media: a light-emitting-diode based technique,”
Appl. Opt., 33
(22), 5204
–5213
(1994). http://dx.doi.org/10.1364/AO.33.005204 APOPAI 0003-6935 Google Scholar
T. H. Pham et al.,
“Broad bandwidth frequency domain instrument for quantitative tissue optical spectroscopy,”
Rev. Sci. Instrum., 71
(6), 2500
–2513
(2000). http://dx.doi.org/10.1063/1.1150665 RSINAK 0034-6748 Google Scholar
Z. Sun, Y. Huang and E. M. Sevick-Muraca,
“Precise analysis of frequency domain photon migration measurement for characterization of concentrated colloidal suspensions,”
Rev. Sci. Instrum., 73
(2), 383
–393
(2002). http://dx.doi.org/10.1063/1.1427303 RSINAK 0034-6748 Google Scholar
F. Bevilacqua et al.,
“Broadband absorption spectroscopy in turbid media by combined frequency-domain and steady-state methods,”
Appl. Opt., 39
(34), 6498
–6507
(2000). http://dx.doi.org/10.1364/AO.39.006498 APOPAI 0003-6935 Google Scholar
G. Zaccanti, S. D. Bianco and F. Martelli,
“Measurements of optical properties of high-density media,”
Appl. Opt., 42
(19), 4023
–4030
(2003). http://dx.doi.org/10.1364/AO.42.004023 APOPAI 0003-6935 Google Scholar
P. Di Ninni, F. Martelli and G. Zaccanti,
“The use of India ink in tissue-simulating phantoms,”
Opt. Express, 18
(26), 26854
–26865
(2010). http://dx.doi.org/10.1364/OE.18.026854 OPEXFF 1094-4087 Google Scholar
F. Martelli and G. Zaccanti,
“Calibration of scattering and absorption properties of a liquid diffusive medium at NIR wavelengths. CW method,”
Opt. Express, 15
(2), 486
–500
(2007). http://dx.doi.org/10.1364/OE.15.000486 OPEXFF 1094-4087 Google Scholar
P. Di Ninni, F. Martelli and G. Zaccanti,
“Intralipid: towards a diffusive reference standard for optical tissue phantoms,”
Phys. Med. Biol., 56
(2), N21
(2011). http://dx.doi.org/10.1088/0031-9155/56/2/N01 PHMBA7 0031-9155 Google Scholar
R. M. P. Doornbos et al.,
“The determination of in vivo human tissue optical properties and absolute chromophore concentrations using spatially resolved steady-state diffuse reflectance spectroscopy,”
Phys. Med. Biol., 44
(4), 967
(1999). http://dx.doi.org/10.1088/0031-9155/44/4/012 PHMBA7 0031-9155 Google Scholar
S. Andree et al.,
“Evaluation of a novel noncontact spectrally and spatially resolved reflectance setup with continuously variable source-detector separation using silicone phantoms,”
J. Biomed. Opt., 15
(6), 067009
(2010). http://dx.doi.org/10.1117/1.3526367 JBOPFO 1083-3668 Google Scholar
A. Kienle et al.,
“Spatially resolved absolute diffuse reflectance measurements for noninvasive determination of the optical scattering and absorption coefficients of biological tissue,”
Appl. Opt., 35
(13), 2304
–2314
(1996). http://dx.doi.org/10.1364/AO.35.002304 APOPAI 0003-6935 Google Scholar
D. J. Cuccia et al.,
“Modulated imaging: quantitative analysis and tomography of turbid media in the spatial-frequency domain,”
Opt. Lett., 30
(11), 1354
–1356
(2005). http://dx.doi.org/10.1364/OL.30.001354 OPLEDP 0146-9592 Google Scholar
D. J. Cuccia et al.,
“Quantitation and mapping of tissue optical properties using modulated imaging,”
J. Biomed. Opt., 14
(2), 024012
(2009). http://dx.doi.org/10.1117/1.3088140 JBOPFO 1083-3668 Google Scholar
R. B. Saager, D. J. Cuccia and A. J. Durkin,
“Determination of optical properties of turbid media spanning visible and near-infrared regimes via spatially modulated quantitative spectroscopy,”
J. Biomed. Opt., 15
(1), 017012
(2010). http://dx.doi.org/10.1117/1.3299322 JBOPFO 1083-3668 Google Scholar
D. L. Glennie et al.,
“Inexpensive diffuse reflectance spectroscopy system for measuring changes in tissue optical properties,”
J. Biomed. Opt., 19
(10), 105005
(2014). http://dx.doi.org/10.1117/1.JBO.19.10.105005 JBOPFO 1083-3668 Google Scholar
A. N. Bashkatov et al.,
“Optical properties of the subcutaneous adipose tissue in the spectral range 400–2500 nm,”
Opt. Spectrosc., 99
(5), 836
–842
(2005). http://dx.doi.org/10.1134/1.2135863 OPSUA3 0030-400X Google Scholar
M. Hammer et al.,
“Optical properties of ocular fundus tissues—an in vitro study using the double-integrating-sphere technique and inverse Monte Carlo simulation,”
Phys. Med. Biol., 40
(6), 963
(1995). http://dx.doi.org/10.1088/0031-9155/40/6/001 PHMBA7 0031-9155 Google Scholar
N. Honda et al.,
“Determination of the tumor tissue optical properties during and after photodynamic therapy using inverse Monte Carlo method and double integrating sphere between 350 and 1000 nm,”
J. Biomed. Opt., 16
(5), 058003
(2011). http://dx.doi.org/10.1117/1.3581111 JBOPFO 1083-3668 Google Scholar
T. L. Troy and S. N. Thennadil,
“Optical properties of human skin in the near infrared wavelength range of 1000 to 2200 nm,”
J. Biomed. Opt., 6
(2), 167
–176
(2001). http://dx.doi.org/10.1117/1.1344191 JBOPFO 1083-3668 Google Scholar
E. Zamora-Rojas et al.,
“Double integrating sphere measurements for estimating optical properties of pig subcutaneous adipose tissue,”
Innovative Food Sci. Emerg. Technol., 19 218
–226
(2013). http://dx.doi.org/10.1016/j.ifset.2013.04.015 Google Scholar
B. Aernouts et al.,
“Supercontinuum laser based optical characterization of Intralipid phantoms in the 500–2250 nm range,”
Opt. Express, 21
(26), 32450
–32467
(2013). http://dx.doi.org/10.1364/OE.21.032450 OPEXFF 1094-4087 Google Scholar
A. N. Bashkatov et al.,
“Optical properties of human skin, subcutaneous and mucous tissues in the wavelength range from 400 to 2000 nm,”
J. Phys. D: Appl. Phys., 38
(15), 2543
(2005). http://dx.doi.org/10.1088/0022-3727/38/15/004 JPAPBE 0022-3727 Google Scholar
P. Lemaillet, J.-P. Bouchard and D. W. Allen,
“Development of traceable measurement of the diffuse optical properties of solid reference standards for biomedical optics at National Institute of Standards and Technology,”
Appl. Opt., 54
(19), 6118
–6127
(2015). http://dx.doi.org/10.1364/AO.54.006118 APOPAI 0003-6935 Google Scholar
T. P. Moffitt, Light Transport in Polymers for Optical Sensing and Photopolymerization, Oregon Health & Science University, Portland, Oregon
(2005). Google Scholar
“Guide to the Expression of Uncertainty in Measurement (GUM)-Supplement 1: Numerical Methods for the Propagation of Distributions,”
International Organization for Standardization, Geneva
(2004). Google Scholar
B. N. Taylor et al.,
“Guidelines for Evaluating and Expressing the Uncertainty of NIST Measurement Results,”
(1994). Google Scholar
D. A. Boas, C. Pitris and N. Ramanujam, Handbook of Biomedical Optics, CRC Press, Boca Raton, Florida
(2011). Google Scholar
|