
|
|
1.IntroductionThe tremendous contribution of microscopy, in general, and of fluorescence microscopy in particular, to fundamental research in life sciences is obvious and needs no clarification. However, molecular specificity, one of its major advantages, cannot be addressed with current label-free methods, therefore, in most cases, it calls for the use of exogenous fluorophores, introduced into the investigated cells in order to enhance the “visibility” of a component or feature of interest within the cell or its membrane. There are two pivotal limitations to labeling cells with exogenous fluorophores1: (a) exogenous fluorophores may interfere with the physiology of the hosting cell, and hence bias the results and (b) the fluorescent label, especially when related to a living cell, tends to bleach while illuminated. Therefore, though at present its ability to trace subcellular events is much more modest, the label-free microscopy (LFM) approach is significantly developed in an effort to address these shortcomings, enabling measurement in standard culture conditions without requiring any further manipulation.2,3 Recruitment of LFM and other nonmicroscopy label-free measurements for research and drug discovery has become more and more common in the last decade.2,4 Of these LFM approaches, pixel-based analysis of bright field computerized images affords definition of characteristic features of gray value distribution within an image.5–7 In this context, we note the fundamental work of Haralick et al.,8 in which the term entropy is borrowed from physics to define an index of textural entropy (TE) for the gray values within an image: , where stands for the incidence of two gray values ( and ) at a specific predetermined angle and distance where TE, which reflects the lack of homogeneity and randomness in the analyzed image, is one of 14 gray-level co-occurrence matrix (GLCM) Haralick indices. Several studies have investigated the relationship between clinical situations and GLCM, for instance, cellular senescence,9 apoptosis,10 and activation of lymphocytes11,12 and GLCM values obtained from measurement within the nuclear image of postfixation stained cells. Cellular senescence and apoptosis resulted in a decrease in homogeneity of image gray value appearance and an increase in nuclear textural entropy values,9,10 while on the other hand, activation of lymphocytes yielded an increase in homogeneity and a decrease in textural entropy of cell nuclei.11,12 Another approach to describe the level of homogeneity and complexity of gray values constructing an image was proposed by Gonzalez and Woods.13 They relied on information entropy formulation and described the average information in the measured pixels in bit units: , where stands for the occurrence of pixels with a specific gray value within the inspected image field. This was further realized in flow cytometry by Wiedemann et al.14 who calculated Gonzalez’s values on 25 pixels of a cell image acquired during flow. This was compared to the results of viability tests performed on the same cells during flow as well. Though sensitivity and specificity of values are not presented in their work, they indeed show that values of dead cells are higher than those of living cells, hence enabling presentation of two distinct cell populations. Their experimental setup of flow cytometry, however, was not suitable for exploring spatiotemporal fluctuations of their calculated index. These studies explored the possible relation between physiological states of cells and static textural entropy of gray values within the cell image, overlooking the dynamic and fluctuating aspects of a cell, which in turn regulates the fluctuating nature of the homogeneity and randomness of gray values within the cell image. Complementary to the above static measures, this study examines the informative value of their fluctuations. In particular, based on the hypothesis that living cells are not in a state of thermodynamic equilibrium, but rather in a metastable state,15–17 the proposed approach relies on the fluctuating nature of the static measure gray level information entropy (GLIE) and offers two novel dynamic measures: (a) ASDE—the spatial average of the temporal standard deviation (SD) of GLIE and (b) AA—the average time autocorrelation of GLIE. Performance of these two was exemplified in contrast to that of GLIE on various states (dead and live nondifferentiated and differentiated) of U-937 cells at single cell resolution. In addition, the power spectrum of GLIE was analyzed using discrete Fourier transform (DFT). Results were then further confirmed in two T cell lines (Jurkat and Molt-4), and on embryonic HEK293 cells as well, and indicated that precision in differentiating between cells in various states was greatest when based on the proposed fluctuation-based measures. 2.Materials and Methods2.1.MaterialsComplete medium (medium): RPMI-1640, Dulbecco’s Modified Eagle Medium (DMEM), heat-inactivated fetal calf serum (FCS), penicillin, streptomycin, glutamine, sodium pyruvate, 4-(2-hydroxyethyl)-1-piperazineethanesulfonic acid (HEPES), and trypsin-EDTA solution B were obtained from biological industries (Kibbutz Beit Haemek, Israel). Propidium iodide (PI) and phorbol myristate acetate (PMA) were obtained from Sigma-Aldrich (St. Louis, Missouri). 2.1.1.Cell linesHuman promonocytic U-937 cells (ECACC, United Kingdom) as well as Molt-4 and Jurkat T-lymphoblast cell lines were maintained in RPMI-1640 medium supplemented with 10% FCS, penicillin, streptomycin, 2% glutamine, 2% sodium pyruvate, and 2% HEPES. Cells were maintained in completely humidified air with 5% at 37°C. Before use, exponentially growing cells were obtained, washed, and suspended in phosphate-buffered saline (PBS) at a concentration of . HEK293 cell line was grown as a monolayer in a high glucose DMEM medium supplemented with 10% FCS, penicillin, streptomycin, 2% glutamine, and 2% sodium pyruvate. Cells were grown in a completely humidified atmosphere containing 5% at 37°C. For preparation of HEK293 cell suspension, cells were harvested by incubation for 3 min at room temperature with 0.25% trypsin-EDTA solution B, followed by washing and suspending in PBS at a concentration of . 2.1.2.Petri dish-based Cytocapture and related operationsA commercial Cytocapture imaging dish (joint venture of Zell-Kontakt GmbH, Nörten-Hardenberg, Germany and Molecular-Cytomics Inc., Boston) was used (Fig. 1). For cell loading, of cell suspension () in PBS or HEPES buffer were loaded on top of the picoliter well (PW) array (Fig. 1, middle panel) and cells were allowed to settle by gravity for 5–10 min. Then of buffer was added gently to the medium exchange region around the array. The imaging dish was mounted on the microscope stage and measured. An example of cells within their PWs is shown in the right panel of Fig. 1. Fig. 1The Cytocapture dish. (a) Tiled view of the dish. (b) Picoliter wells (PWs) on the glass bottom of a Cytocapture dish. PWs are filled with complete RPMI-1640 medium. Upper edges of PWs are set within the microscope focal plane. (c) Molt-4 cells within the deep honeycomb array. Bars indicate . 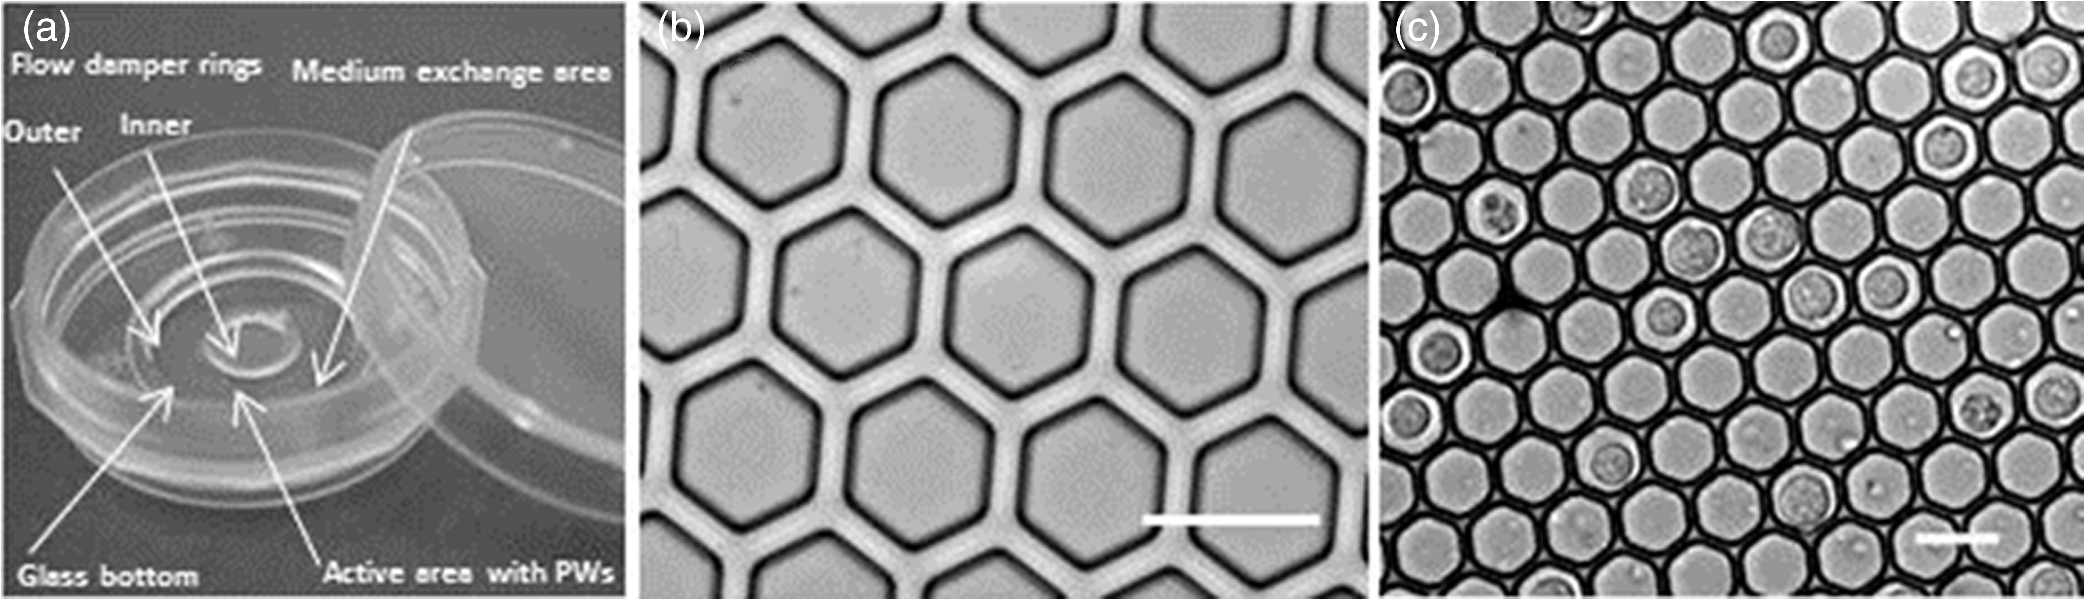 For each measurement of cell free solution and cells, two Cytocapture dishes were used—in each of which 10 PWs were sampled. 2.1.3.Induction of cell deathCell death was induced by serum deprivation. Cells were incubated for 48 h in incomplete RPMI-1640 (without FCS), then washed, suspended in HEPES buffer (0.1 M HEPES, pH 7.4; 1.4 M NaCl; 25 mM ) and maintained for 12 h, then washed again and loaded on the array. Cell viability and plasma membrane integrity were evaluated by staining with PI. PI (final concentration ) was added to the cells within the PW array and incubated for 10 min in the dark at room temperature. The excitation filter was 470 to 490 nm, dichroic mirror 505-nm long pass, and emission filter 510 to 530 nm. 2.2.Measurement System2.2.1.MicroscopeImages were acquired using a motorized Olympus inverted IX81 microscope (Tokyo, Japan). The microscope is equipped with a submicron Marzhauser Wetzlar motorized stage-type SCAN-IM, with an Lstep controller (Wetzlar-Steindorf, Germany) and a filter wheel, including the fluorescence cube (excitation filters, dichroic mirrors, and emission filters, respectively), all filters were obtained from Chroma Technology Corporation (Brattleboro, Vermont). A oil objective and objective were used without oil immersion, since its density tends to fluctuate and consequently the intensity of light propagates through it as well.18 Nevertheless, the quality of the study was not mitigated with this approach, as tracking pixel-based fluctuation was the purpose, rather than image-analysis-based investigation, and though the resolution of the image would be lower than with oil, it would be of no consequence since the data are binned later during image processing. A microscope halogen lamp was used as a light source with a control box which diminishes intense electrical noise and heat from the microscope frame. 2.2.2.Image/data acquisitionA 12-bit cooled, highly sensitive ORCA II C4742-98 camera (Hamamatsu, Japan) was used for image and data acquisition. Image acquisition time was 1 ms, in a 16-bit TIF format, each having , and a physical dimension of at magnification and at magnification on the microscope working plane. Illumination of the sample was synchronized with acquisition time using a controllable electronic shutter. 2.2.3.Image processingAcquired stacks of 200 16-bit TIF images were used for calculation of GLIE, using MATLAB® R2013a software (MathWorks Inc. Natick, Massachusetts). Using MATLAB, 12-bit images with 4096 possible gray values were converted into 682 possible gray value images by reducing every six successive gray values to one new gray value. The GLIE calculation equation used was: where stands for the occurrence of specific gray level value . and are the number of different gray values, both within the inspected field. For the sake of clarity, from here on, the expression entropy will stand for GLIE.Practically speaking, in this study, the spatiotemporal aspect of GLIE is of interest. To that end, a region of interest (ROI) consisting of at the center of the acquired PW image was defined for processing. Each field of view was acquired 200 times at 0.5 s intervals, and was indexed by its serial time point (1 to 200), all together yielding the temporal aspect of GLIE within a ROI. Next, the spatial aspect of GLIE within the ROI was examined by dividing the of a ROI into 400 subgroups, each consisting of from which the 25 pixel-based spatial GLIE (GLIE25) was calculated for each of the 200 time points. Hence, for each time point, a GLIE25 map was compiled from 400 GLIE25 values, reflecting the spatial distribution aspect of GLIE within a ROI. Practically, a discrete bins, rather than a sliding windows approach was realized though the latter might yield a higher resolution map of GLIE. ROIs were chosen (a) at the center of a PW for investigation of cell-free solutions and (b) at the image center of a cell occupying a PW, for investigation of cells within the PWs. From this spatiotemporal data, the following measures were calculated: Time-space averaged GLIE: A two-step averaging (time and space) of GLIE25. First, each GLIE25 was averaged over the 200 time points yielding 400 aGLIE values of time-based averaged GLIE25. Then the average of these 400 values was calculated as well, all together yielding the AGLIE value of a ROI. Since GLIE might be fluctuative in nature (yes/no randomly), the proposed measure AGLIE is perceived as an accurate evaluation like the GLIE measure used by others.14 Hence, all consequent results and conclusions will be used to identify the nature of the GLIE measure. Space averaged temporal standard deviation of entropy: This is a newly proposed measure determined by calculating the temporal SD of 200 time serial GLIE25 values (SD25), yielding 400 values of SD25. Then the average of these 400 SD25 values is defined as the ASDE value of a ROI. Space averaged autocorrelation: This is a newly proposed measure consisting of two-step calculations. First, calculation of A25, the time autocorrelation of 200 GLIE25 values utilizing the one-lag time unit autocorrelation () equation (MathWorks Inc. Natick, Massachusetts): where is the total number of GLIE25 measurements, i.e., 200, performed on the same subgroup of , is the serial number of a single GLIE25 measurement (one out of 200), is the GLIE25 value of the measurement, is the succeeding GLIE25 value, i.e., of the measurement, and is the average GLIE25 value taken over the 200 measurements. Second, averaging these A25 time correlation values over the 400 unit cells within a ROI.The power spectrum of GLIE was calculated by applying DFT on the time dependence GLIE discrete values, (using MATLAB R2013a software, MathWorks Inc. Natick, Massachusetts), from which a new measure, AP, was calculated as follows: Average power spectrum amplitude: This is the average power amplitude of the frequency range . 2.2.4.Data analysis and statisticsThe acquired data within ROIs were exported to Excel spreadsheets (Microsoft Inc., Redmond, Washington) for graph and table presentation and statistical analysis. Significance of differences between groups was calculated using analysis of variance single factor function, with statistical significance set at . 3.Results and Discussion3.1.System Performance ValidationFeasibility of the proposed approach, that is application of fluctuation-based measures as a probe-free indicator in light microscopy, was comprehensively examined. Specifically, the dependency of AGLIE, ASDE, and AA measures upon deviations one might encounter in routine use of light microscopy was examined in order to define the consequent limitations and thresholds of said measures. Relevant experiments were performed as described in Materials and Methods, on a Cytocapture dish filled with cell-free media and placed with its microcavity edge plane adjusted to the microscope working plane, yielding a focused image. The influencing factors considered were electrical noise, light intensity, incorrect vertical sample placement, and type of sample hosting liquid. ASDE and AA were found to be more indifferent than GLIE to light intensity, vertical sample placement (at the range around the working plane), and sample hosting liquid. Results of these feasibility tests seem to suggest that ASDE and AA measures are more appropriate than AGLIE for evaluating true changes occurring in cells, since they allow attribution of measured changes to intracellular physiological alteration or fluctuation, rather than to inherent fluctuation in the measuring system. For detailed description of experiments performed, results obtained and their analysis, see Appendix. 3.2.Measurements of Averaged Gray Level Information Entropy, Averaged Temporal Standard Deviation of Entropy, and Averaged Autocorrelation in Live and Dead U-937 CellsThis experiment aimed to evaluate the ability of AGLIE, ASDE, and AA to distinguish between dead and live cells. The rationale behind this is that cell physiology, which is a major factor in determining the time-dependent physiochemical states of cell content, is expected to be spatiotemporally reflected within the cell content and its consequent optical features, which in turn, can be effectively traced by either said fluctuative measure, ASDE, or AA. Two extreme physiological states were preferred: live and dead cells, which are also distinguishable by the well-established PI staining method used as a complementary reference examination. Figure 2 presents a transmitted light image of a field of PWs containing cells (, bright field) beside the corresponding PI fluorescence image of the same field. Fig. 2U-937 cells within the Cytocapture dish (). (a) Transmitted light image of a field of PWs. (b) Propidium iodide (PI) florescence image of the same field of PWs. Arrows indicate PI positive dead cells. 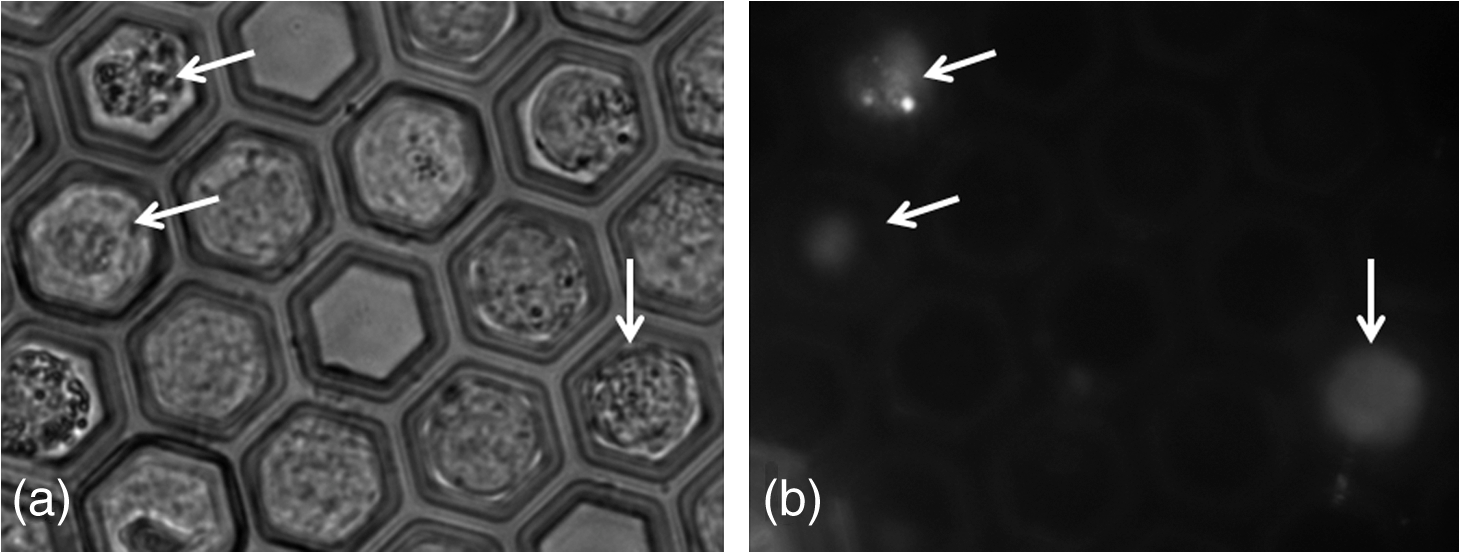 Three populations of U-937 cells were examined:
In all cases, frequency of dead cells within a mixture was assured by counting PI-stained cells. For each of the three populations, AGLIE, ASDE, and AA of pre- and post-PI-treated cells were measured. Two Cytocapture dishes were used for each cell population, one loaded with nonPI-treated cells and the other with PI-treated cells. Cell images and consequent gray values within a unit cell (i.e., ) of representative dead and live cells are shown in Fig. 3. The ROI () from which AGLIE, ASDE, and AA were extracted is indicated by a yellow square. Fig. 3Images (, air immersion) and gray values. Images of dead (a) and live (c) cells, and their consequent gray value (b and d) displayed across a unit cell of , which is of the respective region of interest (ROI) () defined by a square. 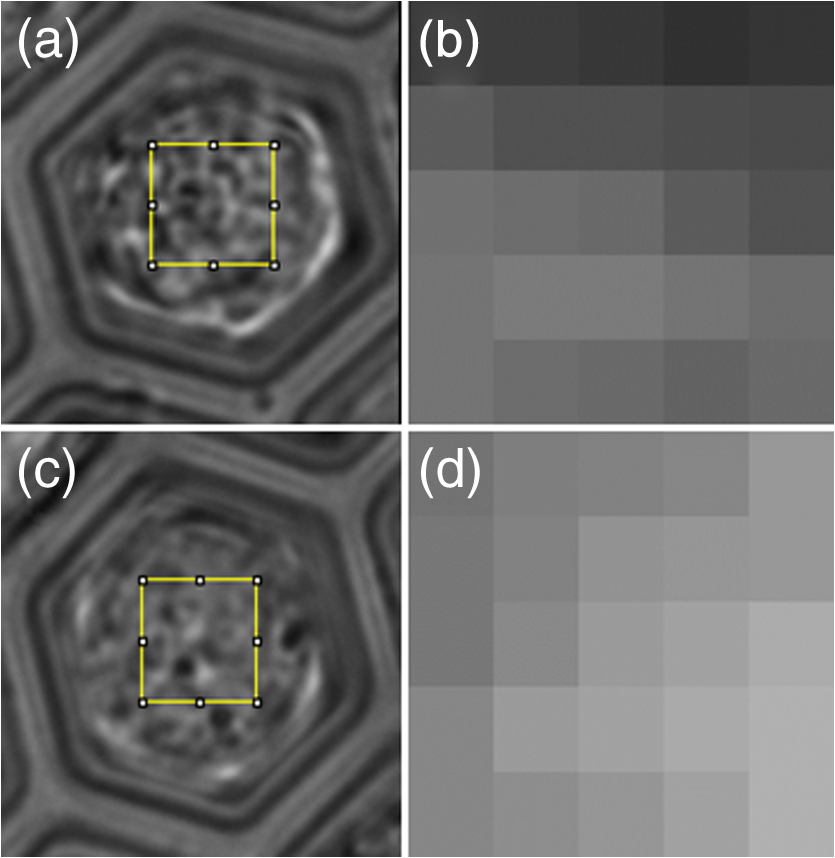 Representative unit cell images () of the dead and live cell samples were acquired 200 times at 0.5 s intervals. The consequent time-dependent GLIE values of randomly chosen 10 live and 10 dead cells are depicted in Figs. 4 and 5. The corresponding 10-cells-based averaged power spectra (calculated with DFT) are presented in Fig. 6. Fig. 4Ten individual live-cell gray level information entropy (GLIE) time dependencies. Abscissa: time in seconds. Ordinate: GLIE values of cell unit (). 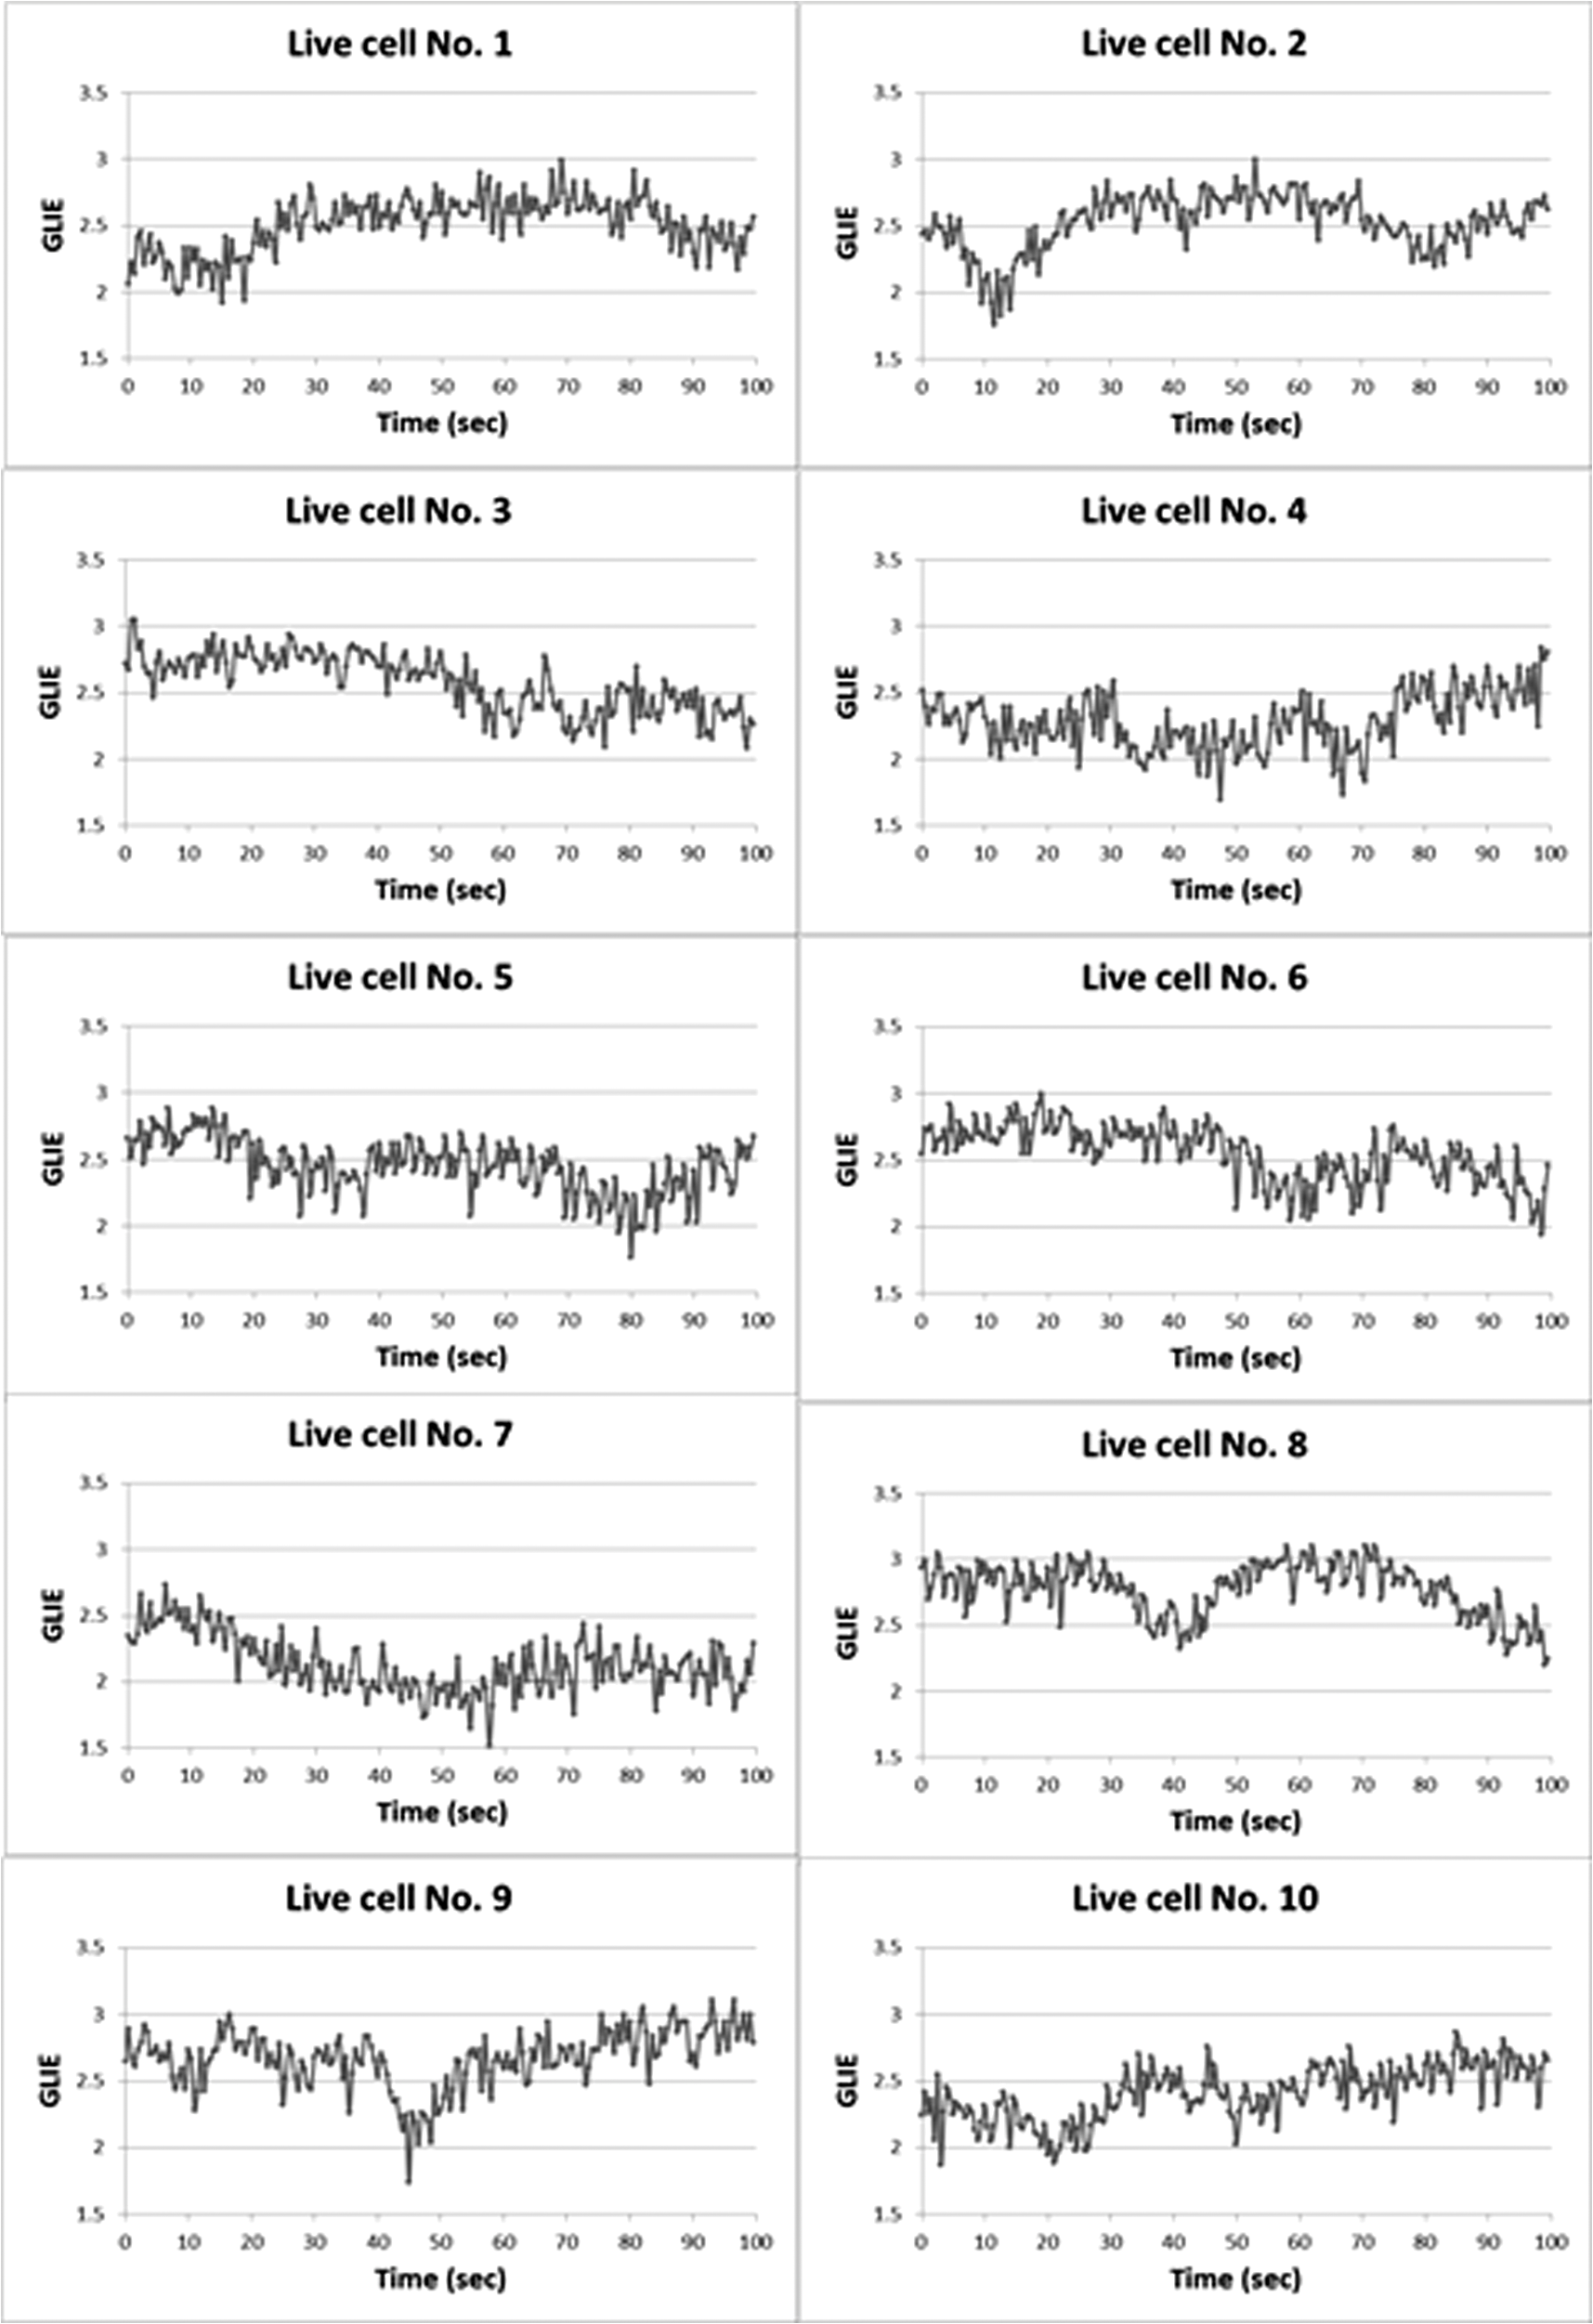 Fig. 5Ten individual dead-cell GLIE time dependencies. Abscissa: time in seconds. Ordinate: GLIE values of cell unit ().  Fig. 6Averaged power spectra of ten cells. For each frequency, the average power of 10 live and 10 dead cells were calculated and depicted in (a) (gray and black curves respectively). To better distinguish the deviation between the spectra, the data in (a) were divided into two frequency regions: (b) and (c) . Black bars depict standard deviation per frequency of 10 cells power spectra.  As seen in Figs. 4 and 5, and based on tens of additional corresponding measurements, the average GLIE value in live cells is lower than that in dead cells. Furthermore, there is no need for a closer look into the figures in order to notice the major difference between the two behaviors: The GLIE time dependencies of dead cells seem constant, while that of live cells changes with time, indicating a possible periodic component. This is better recognized with the corresponding power spectra shown in Fig. 6. While the power spectra calculated from dead cell GLIE signals show no preference frequency (indicating complete randomness), that of live cells shows relatively notable powers at low frequencies. It is suggested that the fluctuate nature of higher frequency region powers reflects thermodynamic-based fluctuations of the cellular content, while the periodicity seen in GLIE signals in live cells (Fig. 6) reflects physiological metabolism. Obviously, the latter is expected to yield elevated SD and non-negligible autocorrelation values. For the sake of clarity, utilizing the acquired data of the cells discussed in Fig. 3, a three-dimensional (3-D) layout of aGLIE25, SD25, and A25 is depicted in Fig. 7 at the single cell () resolution. Hence, each figure consists of 400 () data points, where their height ( coordinate) represents the value of the relevant measure, processed from of a unit cell, acquired 200 times at 0.5 s intervals. The location of a unit cell within an ROI ( matrix of unit cells) is defined by their , coordinates. Fig. 7Three-dimensional (3-D) layout of aGLIE25 (time-averaged GLIE25 over the 200 measurements of the same unit cell), SD25 and A25 in ROIs of representative dead [left column, (a), (c), and (e)] and live [right column (b), (d), and (f)] cells. Each figure consists of 400 data points (). The coordinate stands for the value of the relevant measure processed from which assemble a unit cell. The location of a unit cell within the unit cell matrix is defined by its , coordinates. From top to bottom: aGLIE25, SD25, and A25. 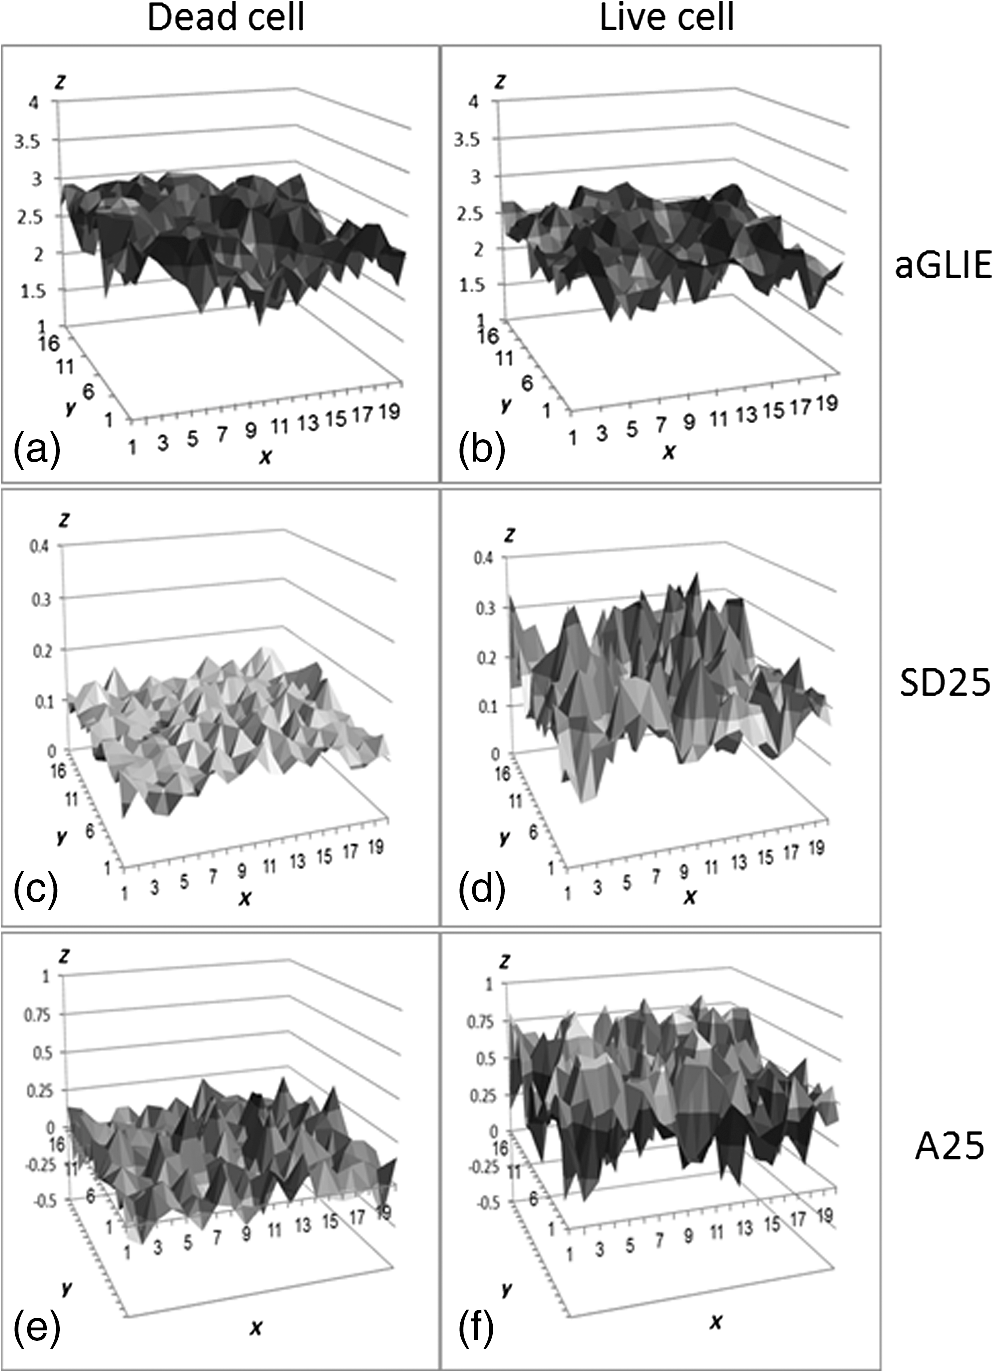 A close look at Fig. 7 reveals that while the difference between the aGLIE25 3-D presentations of dead and live cells (upper panel of Fig. 7) seems quite vague, it is clear in the SD25 and A25 3-D presentations. After completion of the image acquisition procedure for the nonPI-stained sample, the same cells were stained with PI on a Cytocapture dish, and thereafter, underwent image acquisition a second time. By comparing results obtained for each of the measures before and after PI staining, all on the same cells, the performance of the measures in differentiating between dead and live U-937 cells could be determined at an individual cell resolution. Values of AGLIE, ASDE, AA, and consequent sensitivities and specificities, as concluded from the above comparison, are summarized in Table 1. Table 1Ability of averaged gray level information entropy (AGLIE), averaged temporal standard deviation (ASDE), and average autocorrelation (AA) to distinguish between dead and live U-937 cells, pre- and post-PI-treatment. N—number of cells.
Frequency distributions of ASDE and AA values in live () and dead () cell populations (of Table 1) are presented in Fig. 8. Fig. 8Distribution of averaged temporal standard deviation (ASDE) (a) and average autocorrelation (AA) (b) values in dead (black curve) and live (gray curve) cell populations. 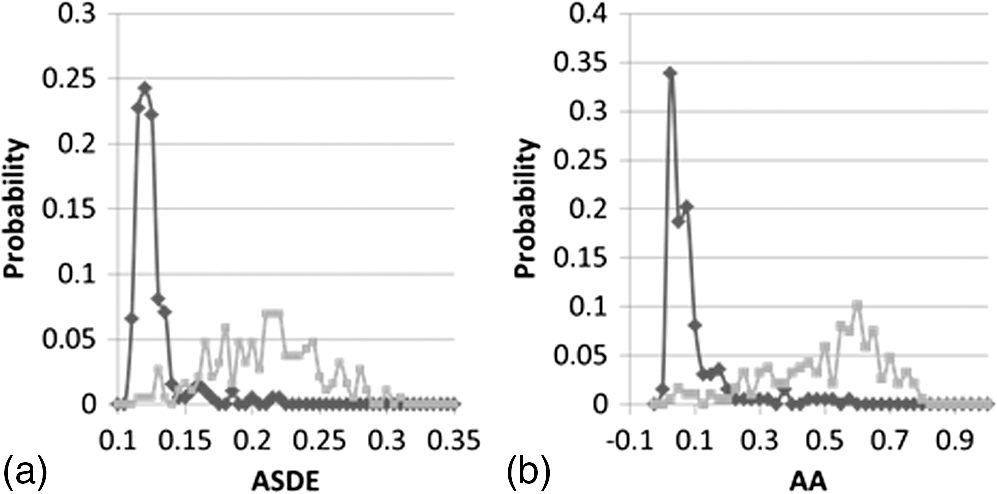 Clearly, the distribution of the two parameters, ASDE and AA for both dead and live cells, presents a negligible overlap, hence differentiating quite sharply between dead and live cells. Examination of the results so far indicates the value of the proposed fluctuation-based measures ASDE and AA over that of the static measure AGLIE. Results in Table 1 indicate that the former yield better sensitivity or specificity in distinguishing between live and dead cells. Moreover, these parameters seem to be indifferent to PI staining, a fact which renders this approach more user friendly. The high values obtained for AGLIE in dead cells in comparison to those in live cells are suggestive of the decrease of morphologic homogeneity in dead cells. This is in agreement with results obtained by Wiedemann et al.14 and known morphological changes which occur in apoptosis, such as dense appearance of cytoplasm, tightly packed organelles, and chromatin condensation.19 However, when fluctuation-sensitive measures (ASDE and AA) are considered, it is clear that dead cells behave as their intracellular content—more consistently than live cells. AA values in live-still samples (see Appendix Tables 5 and 6) are considerably low and in harmony with the low values of AA of dead cells (Table 1). The difference between SD and autocorrelation values obtained for dead cells and between the corresponding values obtained for live cells appears to be an unwavering phenomenon (this is so as it seems typical of most unit cells () within a ROI, when comparing between the two presentations of the middle panel and between the two presentations of the lower panel, both in Fig. 7). These high autocorrelation and SD values, as well as the cyclic behavior of GLIE (Figs. 4 and 5) are believed to stem from physiological activities occurring in live cells. Similar performances of ASDE and AA were observed in U-937 cells when measured at magnification (see Appendix Table 7). AGLIE, ASDE, and AA were also challenged with mixed (live and dead) cell populations of U-937 cells. The percentage of dead and live cells in a given sample was practically predetermined by mixing certain volumes of 100% dead cell suspension with a certain volume of 97% live cell suspension at the same cell density. Three samples were prepared consisting of 100%, 50%, and 20% dead cells (cell solutions which contained 50% and 20% dead cells were prepared by mixing live and dead cells solutions at ratios of , and , respectively). Results obtained by employing the measures were verified by counting the percent of PI positive cells are presented in Table 2: Table 2Performance of AGLIE, ASDE, and AA in evaluating percentage of dead/live cells arrested within the Cytocapture dish. 100%, 50%, and 20% refer to estimated predetermined mixtures. N—number of cells in each group.
As presented in Table 2, unlike with AGLIE, distinguishing between live and dead cells using ASDE and AA was found to be in high agreement with that of PI staining. ASDE, AA, and DFT analyses of GLIE measured in resting nondifferentiated promonocytic U-937 cells before and after stimulation with PMA, and of dead U-937 cells, were calculated, and results presented in Table 3. Table 3Effect of PMA on U-937 cells evaluated by ASDE, AA, and discrete Fourier transform (DFT) of GLIE. N—number of cells in each group. AP—average power amplitude of frequency range <0.5 Hz.
These results indicate statistically significant differences in all parameters between U-937 cells treated for 24 h with and without PMA. Results clearly imply that the AP of PMA-treated-cells is significantly higher than that measured in dead and live cells. Though quite likely, there is not enough evidence to suggest a direct relation between high AP and enhanced cell activity. Distribution histograms of aGLIE25, SD25, and A25 values in 10 dead, 10 live normal, and 10 PMA-treated U-937 cells were examined as well, and their graphic presentations are displayed in Fig. 9, each panel showing 10 distribution curves of 10 individual cells. Calculation of said measures is performed from of an arbitrary selected ROI in the center region of each of the cells, yielding the histograms. A single curve is constructed from 400 relevant values, each extracted by processing the (data points) of a unit cell within a ROI. Fig. 9Distribution histograms of (top to bottom) aGLIE25, SD25, and A25 measured in 10 representative individual cells: dead [(a), (d), and (g)], live incubated without PMA [(b), (e) and (h)] and with PMA p(c), (f) and (i)]. Each panel contains 10 occurrence curves, each of a different cell. Calculations of said measures are performed on of an arbitrary selected ROI, apparently within the center of the image of each of the cells, yielding the occurrence curves (histograms). A single curve is constructed from 400 relevant values, each extracted by processing the (data points) of a unit cell within a ROI. 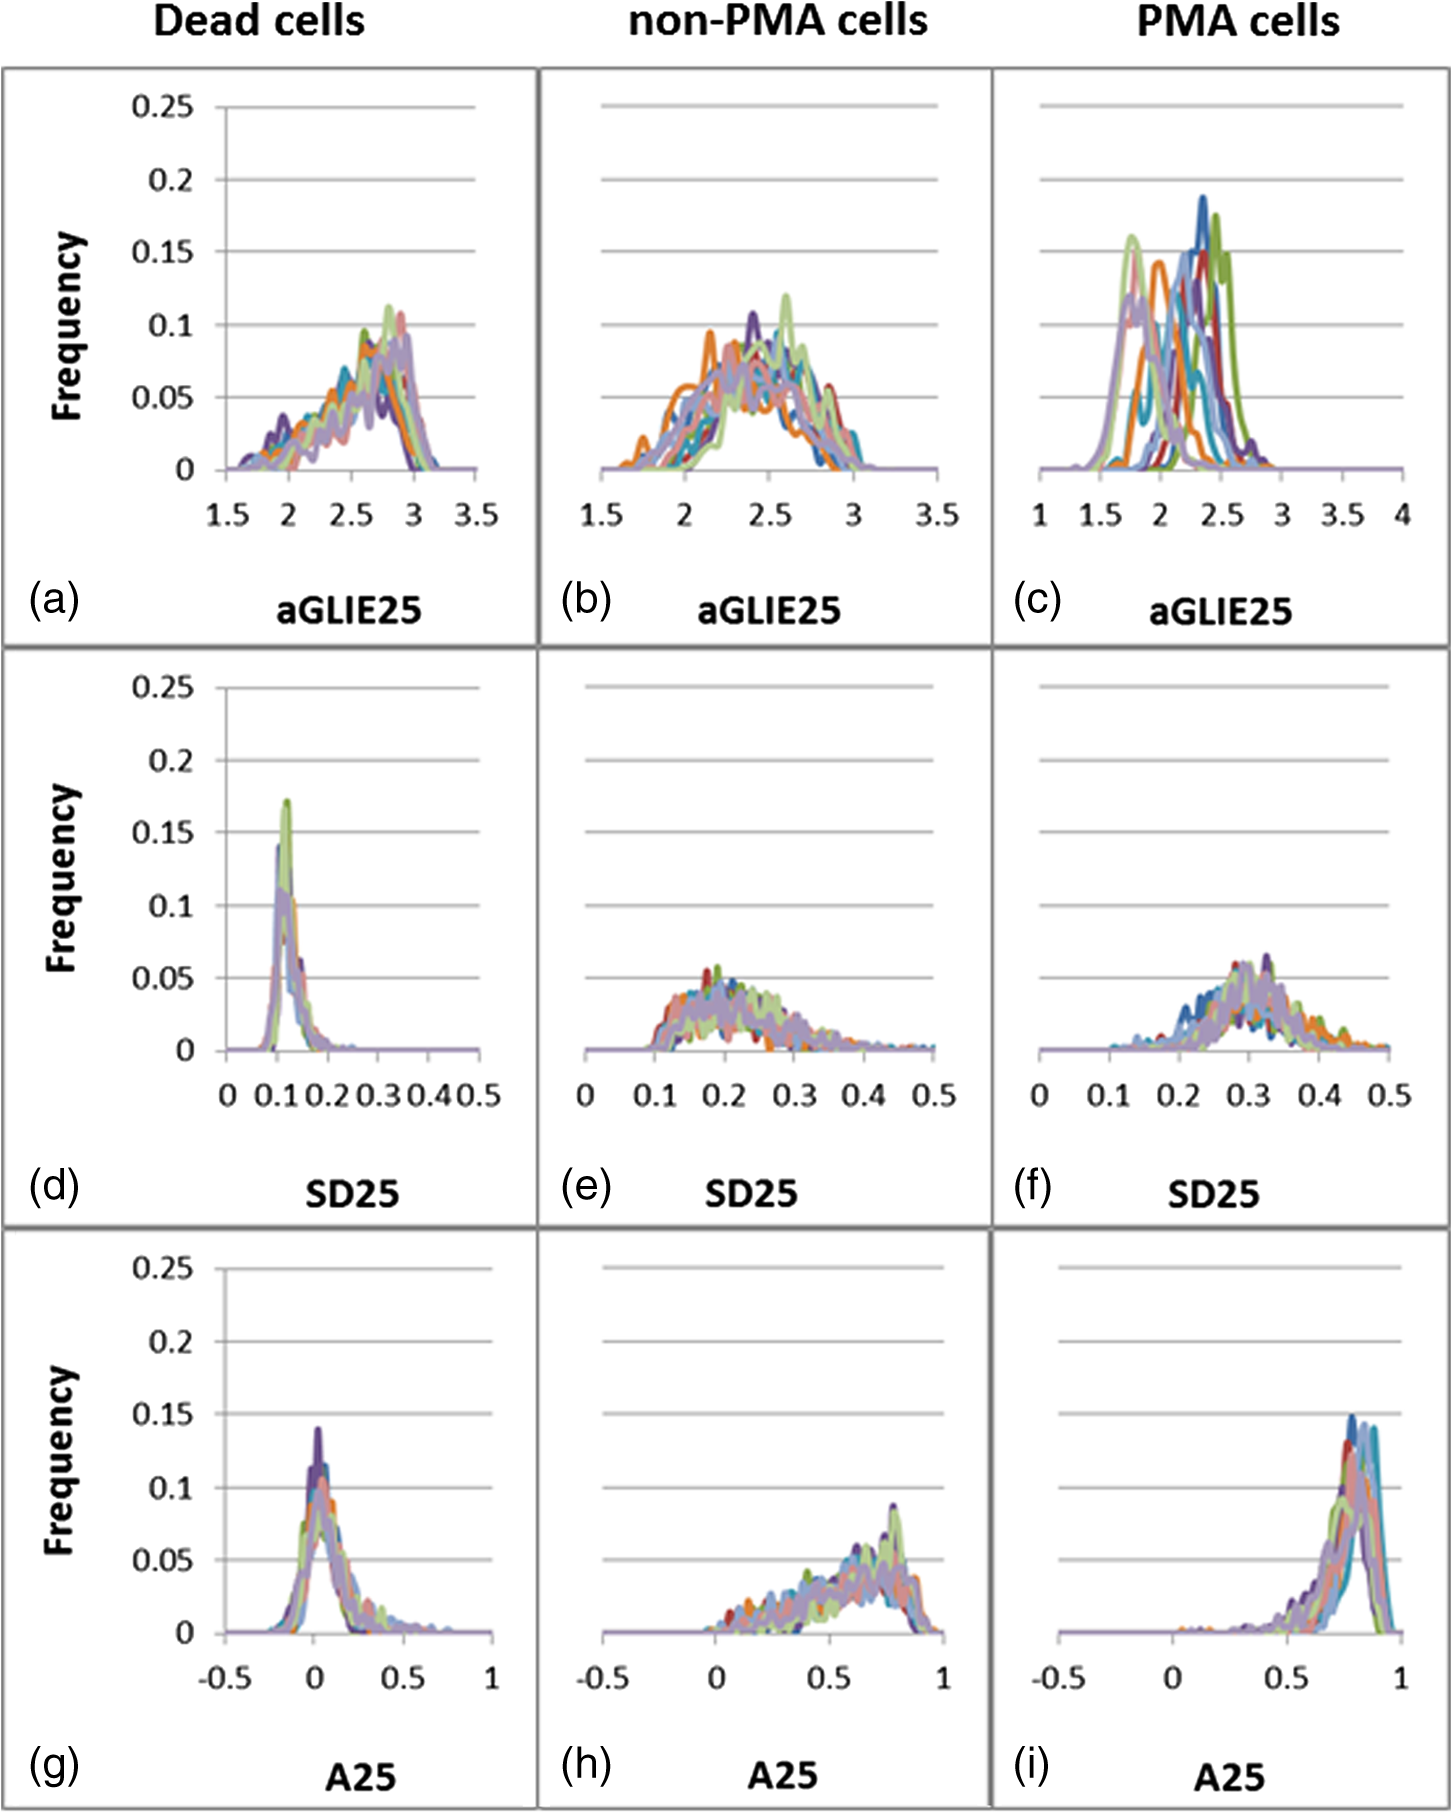 As seen in Fig. 9, a high similarity is evident between curve shapes of individual cells within each cell group. Moreover, in addition to the significant differences between the mean values of the three groups (see also Tables 1 and 3), the respective shapes of distribution histograms are distinctive. Dead cell aGLIE25 curves (upper left panel) and A25 curves of both live cells incubated without (lower middle panel) and with PMA (lower-right panel) are skewed to the right. These skewed distributions may be asymmetric due to a natural limit (upper panel) of these parameters (maximum values of 3.22 and 1 for the aGLIE25 and A25, respectively) which prevent outcomes on one side. However, it is clear that the SD25 measure (middle panels, left to right) is significantly different not only in the mean value [ for the dead U-937 cell group, and respectively and for cells incubated without and with PMA (), but in the dispersion of the values as well; for instance, the averaged SDs of SD25 values of cells incubated without and with PMA are and respectively, while that of dead cells are ; for both live cell groups versus dead cells]. Thus, the variability of SD25 within the 400 cell units of live cells is significantly higher than that within dead cells. Moreover, histograms of SD25 derived from individual live cells treated with and without PMA exhibited low kurtosis ( and respectively) in comparison with that of dead cells (; ). Similarly, skewness values for live cells treated with and without PMA ( and respectively) were found to be lower than those of dead cells (; ). The differences among the above four parameters (ASDE, the standard deviation of the frequency distribution of SD25 within a ROI, and the skewness and kurtosis of these distributions) in live and dead cells are suggested to be attributed to the higher versatility of live cell content due to their physiology and inherent activity. 3.3.Generality of Averaged Temporal Standard Deviation of Entropy and Averaged Autocorrelation MeasuresIn order to assess the generality of the proposed fluctuation-based measures ASDE and AA, they were applied to other cell types as well: Jurkat, Molt-4 T-lymphoblast, and embryonic HEK293. Calculations were performed as with U-937cells above, and results are presented in Table 4. Table 4Performance of ASDE and AA in distinguishing between live and dead cells within populations of Jurkat, Molt-4, and HEK293 cells.
The fact that the results in Table 4, obtained for Jurkat, Molt-4, and HEK293 cell lines, are consistent with those observed when applied to U-937 cell lines illustrates the generality of the proposed measures ASDE and AA. 3.4.Postulates and FoundationsThe assumption on which this study relies is that intracellular physiological activities are associated with consequent spatiotemporal optospectroscopic alterations, which is, in turn, reflected in the appearance of time-dependent gray values within the transmitted light image of the examined cell. The main aim in this section is to present evidence to support said postulate in light of the results obtained. The feasibility and system performance measurements performed on cell-free solutions (see Appendix) indeed strengthen this line of thought, as it teaches that these fluctuation-based measures, which are expected to report on the fluctuate nature of a measurement, are indifferent to static states such as various illumination intensities, deviations from proper object settings in respect to the microscope working plane, as well as the type of hosting media. On the other hand, the static parameter AGLIE, indeed, shows (Tables 5, 6, and Fig. 10) some level of sensitivity to these static states. It is, hence, suggested that this inherent difference between fluctuation-based and static measures makes the former more appropriate for distinguishing between still-life, dead and live cells, and between yes/no activated cells, disregarding the influence of static states, all clearly demonstrated in this study. Table 5Influence of illumination-intensity upon AGLIE, ASDE, and AA [averaged over measurements of 10 picoliter wells (PWs)] with relevant p values below.
Table 6AGLIE, ASDE, and AA values measured in two types of liquids.
Results obtained on cells in the different states, dead, live, and PMA-activated, strengthen said postulate and furthermore, show positive correlation between the level of cell vitality and activity and the proposed fluctuation-based measures. In other words, the more active the cell, the greater the ASDE, AA, and AP values are. Optical fluctuations in the cell image are related to fluctuations of cell content, refractive index, and permittivity, which are connected to fluctuation in mass density. With respect to the biological system, fluctuations in mass density can be attributed to both cell physiological activity and to inherent thermal Brownian fluctuations. Considering live cell in a physiological medium as a canonical thermodynamic system with temperature and volume reservoirs, statistical mechanics state that fluctuation () in mass density () can be expressed as: , where is the Boltzmann constant, is the temperature, and is the isothermal compressibility.20 This was further successfully applied on liquids21,22 and suspensions of liposomes.23,24 On the other hand, since permittivity and refractive index are mass-density and temperature-dependent, fluctuation in the latter two is expected to produce fluctuation in the permittivity and refractive index of a liquid medium as is generally expected, and in intracellular content as well, following the equation:21,22 The dominant contributor to is density fluctuation resulting from molecule motions, which contribute about 99% in comparison to just 1% contributed by temperature fluctuation.22 Fluctuation in cell permittivity was evident in measuring the time dependency of light scattered from cells.25,26 Furthermore, it has been shown that these fluctuations in the refractive index range from 0.04 to 0.1 around and that these fluctuations have long range spatial correlations.26 At present, the time scale along which the proposed fluctuation-based measures are reliable and truly reflect cellular events relies on others’ work. Joshi et al.27 and Shaked et al.28 have independently demonstrated, using different methods, fluctuations in phase values in living cells occurring in time scales of tens of milliseconds or more, which could be tracked and related to physiological changes. Joshi et al. initiated cellular physiological events by exposing cells to hypotonic media known to induce various cellular changes such as water influx into the cell, cell excitation, hormone release, migration, cell proliferation, and cell death.29 Shaked et al., in applying their measurement system, followed in vitro physiological changes which occur during cardiomyocyte contraction-relaxation cycles. Within the same time scale of tens of milliseconds or more, Watson et al.30 showed random fluctuations of forward scattered light from living cells at the single cell level which yielded fluctuation in up to 30% of the scattered intensity. In light of these studies, it can be assumed, with a high level of confidence, that the acquisition time used in the current work () does not average a representative fluctuation which lasts about tens of milliseconds or more, based independently on the work of Joshi et al., Shaked et al., and Watson et al. Now, since the time scale of several cardinal physiological processes, such as protein synthesis and translocation, is a few seconds,31,32 it is anticipated that a sampling rate of 200 per 100 s (2 Hz) with sampling duration of 1 ms will be enough to trace these physiological events. This is also in agreement with Nyquist sampling criterion (Wolfarm MathWorld), which requires a sampling rate of at least twice the frequency of the function signal one wishes to reconstruct. The GLIE measure seems to change quite periodically with cycle times longer than 10 s. (Figs. 4 and 5). It is suggested that this might be associated with the well-known physiological oscillations of the intracellular spatial concentration of signaling molecules,33 and hence in turn, with the subsequent spatiotemporal fluctuation in mass density as well. Following this line of thought, the time period of other intracellular oscillations may reach minutes and even hours.34 However, some oscillations of pivotal intracellular mediators like -induced translocation of protein kinase C and G proteins have been shown to take place in time periods of seconds.35–37 The above discussion is limited to pointing out various cellular constellations which could be monitored by the proposed fluctuation-based measures and does not purport to characterize any specific association between the biological event and said measure—a mission which calls for further investigation and analysis beyond the scope of the present study. 4.SummarySpatiotemporal fluctuation of GLIE was investigated and realized in distinguishing among dead, live, and PMA-activated cells. This was performed on four types of cells by utilizing a combination of (a) simple bright-field microscope-based static cytometry and (b) Cytocapture dish, in which cells of interest are held, each within a picoliter optical chamber ( entrance diameter, depth), forming an arrayed cell arrangement which allows time-dependent measurement at individual-cell resolution while treated in situ. Results obtained in this study indicate that fluctuation-sensitive measures (SD25/ASDE and A25/AA) seem to be more practical than static measures (GLIE25/AGLIE) in distinguishing between dead and live cells. Furthermore, relying on their good performance in distinguishing between cells activated with or without PMA, it is believed that the proposed ASDE and AA measures might be a significant addition to the existing microscope-based probe-free toolbox. It is our intention to further deepen this research by challenging the proposed measures to discriminate between various fine physiological states, under controlled induction and inhibition of intracellular processes. Last but not least, the proposed ASDE and AA measures are eventually consequences of fluctuations of the index of refraction. The latter is a macroscopic parameter, and hence the ability of the measures to directly discover biophysical cause and its spatial aspect (which in some cases might be addressed by fluorescence microscopy) is justly questioned, even though indications of uneven spatial distribution of the proposed measures within a cell image have been observed, suggesting that they might reveal spatial information (data not shown). However, it is believed that an effort to correlate between the measures and between specific cellular situations, with established biochemical–physical aspects and location, might better define the ability of the measures to specifically identify cellular events, their location, and probably, to explore their biophysical mechanism as well. This effort might even be further enhanced if performed with higher contrast methods such as phase contrast microscopy, differential interference contrast, or quantitative phase imaging/digital holographic microscopy, which will probably have higher signal-to-noise ratio in comparison to the presently used bright field measurements. AppendicesAppendixA.1.Dependency of averaged gray level information entropy, averaged temporal standard deviation, and average autocorrelation upon light intensityA microscope Halogen lamp was used to evaluate the influence of light intensity upon the three measures. Intensities used were 0: no light (lamp is off), 30%, 80% (determined by means of natural density filters), and 100% of the source. Then AGLIE, ASDE, and AA were calculated for each of the intensities, in 10 PWs. The 10 PW-based averages are summarized in Table 5. As seen in Table 5, the increase of AGLIE with light intensity is prominent (), while ASDE and AA seem to be indifferent to measured intensity. This makes the latter two measures more appropriate for evaluating true changes occurring in cells, since they allow attribution of measured changes to intracellular physiological alteration or fluctuation, rather than to fluctuation in illumination intensity which can occur in microscopy on a regular basis. The physical reasoning behind these findings, ignoring sources of electrical noise, is mostly photon statistics, according to which the expected SD equals the square root of the count . This means that the number of at least 68% of the gray values (1 SD) is . For instance, if the average count read is 100, one would expect reading counts in the range of 90 to 110 with coefficient of variation (CV) of , yielding 20 gray levels (within 1 SD). However, for average count read of say 10,000, , yielding 200 gray values, though the entire relative distribution of gray values is narrowed (having CV of) . This was also verified by counting the number of gray values within ROIs at different intensities (data not shown). Hence, the higher the intensity () (i.e., the higher ), the wider the occurrence distribution of gray values, which results in higher values of GLIE. This explains the sensitivity of AGLIE to intensity, as shown in Table 5. For clarification, when all 25 pixels () within a unit cell have the same gray value (maximum order), the occurrence of this single gray value within a unit is unity (). Using Eq. (1), the GLIE25 of such a state is . On the other hand, if each of the pixels has a different gray value (maximum disorder), the GLIE25 is . Therefore, in the particular case of a unit cell consisting of 25 pixels, , this calculated range is in agreement with the measured right edge upper panel of the experimental frequency histogram curve of GLIE depicted in the upper panel of Fig. 9. A.2.Influence of incorrect vertical sample-placement upon averaged gray level information entropy, averaged temporal standard deviation, and average autocorrelationThe influence of deviation from correct sample placement in respect to the microscope working and/or focal plane was examined. Experiments were performed on Cytocapture dishes loaded with medium, after assuring that the image of PW edges was focused. Then the coordinate of the microscope controlled stage was manipulated from in increments of . All together, there were 9 -planes in each of which data was acquired (200 serial images) in 3 PWs. Results, AGLIE (), ASDE (), and AA (), indicate the indifference of the measures, especially those of ASDE and AA, to the vertical sample location within the said range. For a graphic illustration, see Fig. 10. A broader range of error was not considered due to its improbability of occurrence with an experienced user. Fig. 10Influence of deviation from proper sample-placement (in respect to the working plane distance) on (a) AGLIE, (b) ASDE, and (c) AA Each symbol in the figure represents the relevant three PW-based for a given distance () of the object/sample from the microscope working plane (), wherefrom the object image is focused. Abscissa: distance () from working plane (). Increment along the optical axis is . Ordinate: (a), (b), and (c) are AGLIE, ASDE, and AA, correspondingly. 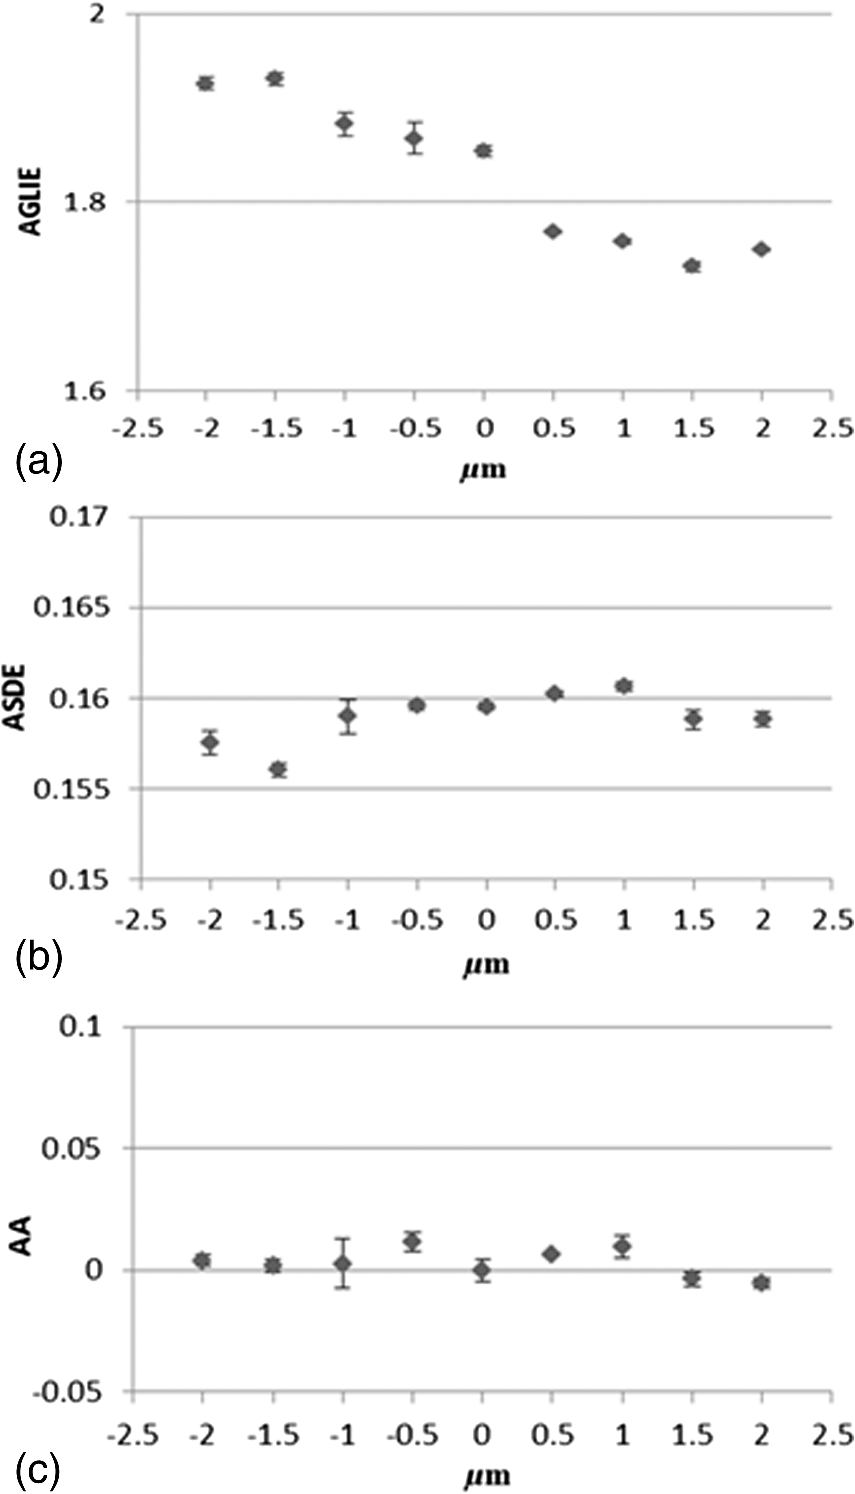 A.3.Dependency of averaged gray level information entropy, averaged temporal standard deviation, and average autocorrelation on liquid typeUtilizing the data acquisition and image processing procedures described above, AGLIE, ASDE, and AA was examined in 20 PWs, 10 per Cytocapture dish filled by either medium or water. Average values given in Table 6 indicate that liquid types are indistinguishable by both ASDE and AA, but might be distinguished by AGLIE. When attempting measurement of cells in suspension, the lower the interference of the hosting media with the applied measure, the more reliable and informative the measure is. A.4.Averaged temporal standard deviation and average autocorrelation parameter values at and magnificationsLive U-937 cells were measured for ASDE and AA values at magnification and magnification for comparison. Results are presented in Table 7. Table 7ASDE and AA values in U-937 cells measured at 60× and 100× magnifications.
No significant difference in ASDE and AA values was found between cells measured at magnification and corresponding cells at magnification. ReferencesB. N. G. Giepmans et al.,
“The fluorescent toolbox for assessing protein location and function,”
Science, 312 217
–224
(2006). http://dx.doi.org/10.1126/science.1124618 SCIEAS 0036-8075 Google Scholar
D. Evanko,
“Label-free microscopy,”
Nat. Methods, 7
(1), 36
–36
(2010). http://dx.doi.org/10.1038/nmeth.f.288 1548-7091 Google Scholar
N. Pavillon, K. Fujita and N. I. Smith,
“Multimodal label-free microscopy,”
J. Innovative Opt. Health Sci., 7
(5), 1330009
(2014). http://dx.doi.org/10.1142/S1793545813300097 Google Scholar
M.-N. Zhang, Y.-T. Long and Z. Ding,
“Filming a live cell by scanning electrochemical microscopy: label-free imaging of the dynamic morphology in real time,”
Chem. Cent. J., 6
(20), 1
–6
(2012). http://dx.doi.org/10.1186/1752-153X-6-20 Google Scholar
A. Rosenfeld and E. Troy,
“Visual texture analysis,”
College Park, Maryland
(1970). Google Scholar
A. Rosenfeld and M. Thurston,
“Visual texture analysis, 2,”
College Park, Maryland
(1970). Google Scholar
E. B. Troy, E. S. Deutsch and A. Rosenfeld,
“Gray-level manipulation experiments for texture analysis,”
IEEE Trans. Syst. Man Cybernet., SMC-3
(1), 91
–98
(1973). http://dx.doi.org/10.1109/TSMC.1973.5408582 Google Scholar
R. M. Haralick, K. Shanmugam and I. Dinstein,
“Textural features for image classification,”
IEEE Trans. Syst. Man Cybernet., SMC-3
(6), 610
–621
(1973). http://dx.doi.org/10.1109/TSMC.1973.4309314 Google Scholar
I. Pantic, S. Pantic and J. Paunovic,
“Aging increases nuclear chromatin entropy of erythroid precursor cells in mice spleen hematopoietic tissue,”
Microsc. Microanal., 18
(5), 1054
–1059
(2012). http://dx.doi.org/10.1017/S1431927612001377 MIMIF7 1431-9276 Google Scholar
I. Pantic, S. Pantic and G. Basta-Jovanovic,
“Gray level co-occurrence matrix texture analysis of germinal center light zone lymphocyte nuclei: physiology viewpoint with focus on apoptosis,”
Microsc. Microanal., 18
(3), 470
–475
(2012). http://dx.doi.org/10.1017/S1431927612000098 MIMIF7 1431-9276 Google Scholar
I. Pantic and S. Pantic,
“Germinal center texture entropy as possible indicator of humoral immune response: immunophysiology viewpoint,”
Mol. Imaging Biol., 14
(5), 534
–540
(2012). http://dx.doi.org/10.1007/s11307-011-0531-1 Google Scholar
I. Pantic et al.,
“Nuclear entropy, angular second moment, variance and texture correlation of thymus cortical and medullar lymphocytes: grey level co-occurrence matrix analysis,”
An. Acad. Bras. Cienc., 85
(3), 1063
–1072
(2013). http://dx.doi.org/10.1590/S0001-37652013005000045 AABCAD 0001-3765 Google Scholar
R. C. Gonzalez and R. E. Woods, Digital Image Processing, 425
–427 3rd ed.Prentice Hall, New Jersey
(2008). Google Scholar
P. Wiedemann et al.,
“In situ microscopic cytometry enables noninvasive viability assessment of animal cells by measuring entropy states,”
Biotechnol. Bioeng., 108
(12), 2884
–2893
(2011). http://dx.doi.org/10.1002/bit.23252 BIBIAU 0006-3592 Google Scholar
P. C. W. Davies, E. Rieper and J. A. Tuszynski,
“Self-organization and entropy reduction in a living cell,”
BioSystems, 111
(1), 1
–10
(2013). http://dx.doi.org/10.1016/j.biosystems.2012.10.005 BSYMBO 0303-2647 Google Scholar
D. Marín, M. Martín and B. Sabater,
“Entropy decrease associated to solute compartmentalization in the cell,”
BioSystems, 98
(1), 31
–36
(2009). http://dx.doi.org/10.1016/j.biosystems.2009.07.001 BSYMBO 0303-2647 Google Scholar
E. Schrödinger, What is Life? The Physical Aspect of the Living Cell, Cambridge University Press, Cambridge
(1967). Google Scholar
B. Derrida,
“Non-equilibrium steady states: fluctuations and large deviations of the density and of the current,”
J. Stat. Mech., 2007
(07), P07023
(2007). http://dx.doi.org/10.1088/1742-5468/2007/07/P07023 JSMTC6 1742-5468 Google Scholar
A. Saraste and K. Pulkki,
“Morphologic and biochemical hallmarks of apoptosis,”
Cardiovasc. Res., 45
(3), 528
–53
(1999). http://dx.doi.org/10.1016/S0008-6363(99)00384-3 CVREAU 0008-6363 Google Scholar
R. K. Pathria and P. D. Beale,
“The grand canonical ensemble,”
Statistical Mechanics, 104 Elsevier, Butterworth-Heinemann, Oxford
(2011). Google Scholar
A. Morel,
“Optical properties of pure water and pure sea water,”
Optical Aspects of Oceanography, 1
–24 Academic Press, New York
(1974). Google Scholar
X. Zhang and L. Hu,
“Estimating scattering of pure water from density fluctuation of the refractive index,”
Opt. Express, 17
(3), 1671
–1678
(2009). http://dx.doi.org/10.1364/OE.17.001671 OPEXFF 1094-4087 Google Scholar
R. Krivanek, L. Okoro and R. Winter,
“Effect of cholesterol and ergosterol on the compressibility and volume fluctuations of phospholipid-sterol bilayers in the critical point region: a molecular acoustic and calorimetric study,”
Biophys. J., 94
(9), 3538
–3548
(2008). http://dx.doi.org/10.1529/biophysj.107.122549 BIOJAU 0006-3495 Google Scholar
P. Chong, M. Sulc and R. Winter,
“Compressibilities and volume fluctuations of archaeal tetraether liposomes,”
Biophys. J., 99
(10), 3319
–3326
(2010). http://dx.doi.org/10.1016/j.bpj.2010.09.061 BIOJAU 0006-3495 Google Scholar
S. L. Jacques,
“Optical properties of biological tissues: a review,”
Phys. Med. Biol., 58
(11), R37
–R61
(2013). http://dx.doi.org/10.1088/0031-9155/58/11/R37 PHMBA7 0031-9155 Google Scholar
M. Xu, T. T. Wu and J. Y. Qu,
“Unified Mie and fractal scattering by cells and experimental study on application in optical characterization of cellular and subcellular structures,”
J. Biomed. Opt., 13
(2), 024015
(2008). http://dx.doi.org/10.1117/1.2907790 JBOPFO 1083-3668 Google Scholar
B. Joshi et al.,
“Label-free route to rapid, nanoscale characterization of cellular structure and dynamics through opaque media,”
Sci. Rep., 3 2822
(2013). http://dx.doi.org/10.1038/srep02822 SRCEC3 2045-2322 Google Scholar
N. T. Shaked et al.,
“Whole-cell-analysis of live cardiomyocytes using wide-field interferometric phase microscopy,”
Biomed. Opt. Express, 1
(2), 706
–719
(2010). http://dx.doi.org/10.1365/BOE.1.000706 BOEICL 2156-7085 Google Scholar
F. Lang et al.,
“Functional significance of cell volume regulatory mechanisms,”
Physiol. Rev., 78
(1), 247
–306
(1998). PHREA7 0031-9333 Google Scholar
R. Y. D. Watson et al.,
“Elastic light scattering from single cells: orientational dynamics in optical trap,”
Biophys. J., 87
(2), 1298
–1306
(2004). http://dx.doi.org/10.1529/biophysj.104.042135 BIOJAU 0006-3495 Google Scholar
R. Young and H. Bremer,
“Polypeptide-chain-elongation rate in Escherichia coli B/r as a function of growth rate,”
Biochem. J., 160
(2), 185
–194
(1976). http://dx.doi.org/10.1042/bj1600185 Google Scholar
J. F. Presley et al.,
“ER-to-Golgi transport visualized in living cells,”
Nature, 389
(4), 81
–85
(1997). http://dx.doi.org/10.1038/38001 Google Scholar
P. Paszek, D. A. Jackson and M. R. H. White,
“Oscillatory control of signalling molecules,”
Curr. Opin. Genet. Dev., 20
(6), 670
–676
(2010). http://dx.doi.org/10.1016/j.gde.2010.08.004 COGDET 0959-437X Google Scholar
A. Hoffmann et al.,
“The IkappaB-NF-kappaB signalling module: temporal control and selective gene activation,”
Science, 298
(5596), 1241
–1245
(2002). http://dx.doi.org/10.1126/science.1071914 SCIEAS 0036-8075 Google Scholar
E. Oancea and T. Meyer,
“Protein kinase C as a molecular machine for decoding calcium and diacylglycerol signals,”
Cell, 95
(3), 307
–318
(1998). http://dx.doi.org/10.1016/S0092-8674(00)81763-8 CELLB5 0092-8674 Google Scholar
F. Codazzi, M. N. Teruel and T. Meyer,
“Control of astrocyte oscillations and waves by oscillating translocation and activation of protein kinase C,”
Curr. Biol., 11
(14), 1089
–1097
(2001). http://dx.doi.org/10.1016/S0960-9822(01)00326-8 CUBLE2 0960-9822 Google Scholar
L. Giri et al.,
“A G-protein subunit translocation embedded network motif underlies GPCR regulation of calcium osscillations,”
Biophys. J., 107
(1), 242
–254
(2014). http://dx.doi.org/10.1016/j.bpj.2014.05.020 BIOJAU 0006-3495 Google Scholar
BiographyIshay Wohl is a PhD student of biophysics at Bar Ilan University’s, Physics Department in Israel. He earned his medical degree at Tel Aviv University’s, Sackler School of Medicine in 1992 and completed residency in plastic surgery at Jerusalem’s Shaare Zedek Medical Center in 2000. Since then, he has been employed as a senior plastic surgeon at Klalit Health Services, and a senior physician at the Plastic Surgery Units of Kaplan Medical Center in Rehovot and Barzilai Medical Center in Ashkelon. Mordechai Deutsch is a member of the Physics Department at Bar Ilan University. He formulated the vision of the Biophysical Interdisciplinary Jerome Schottenstein Center for the research and technology of the cellome, established it and serves as its director. His fields of expertise are molecular physics, biophysics, electromagnetism, geometric and physical optics, fluorescence, micro optics, light microscopy, advanced imaging and signal analysis, microfluidics, and micro fabrication. Applications include spectroscopic measurements of live cells in cancer, immunology, and cryobiology. |
|||||||||||||||||||||||||||||||||||||||||||||||||||||||||||||||||||||||||||||||||||||||||||||||||||||||||||||||||||||||||||||||||||||||||||||||||||||||||||||||||||||||||||||||||||||||||||||||||||||||||||||||||||||||||||


