|
|
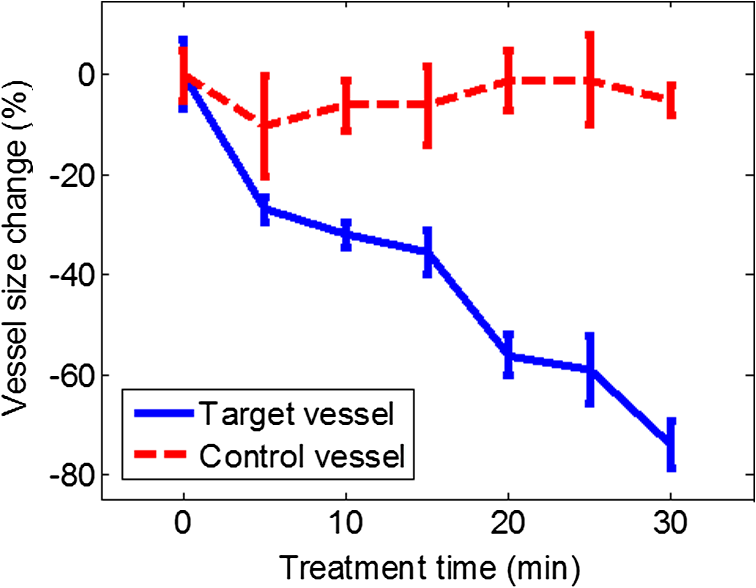
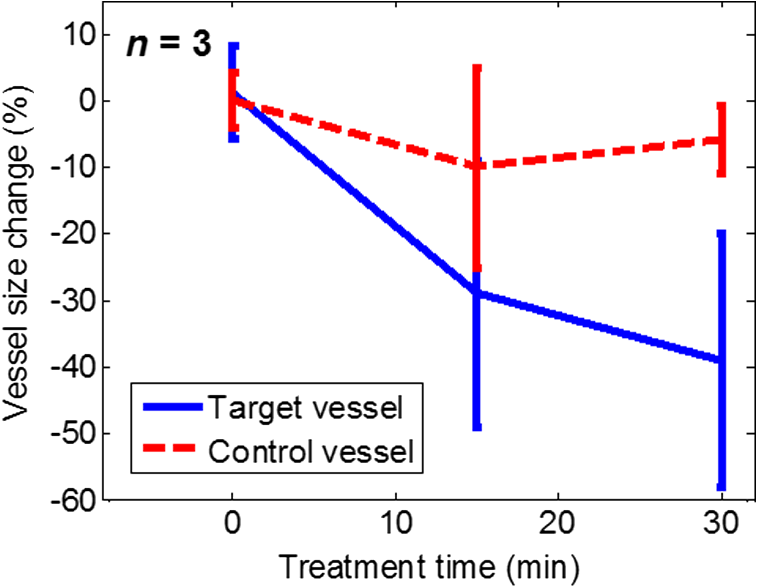
1.IntroductionPhotodynamic therapy (PDT) is a treatment that takes advantage of toxicity of light-activated photosensitizers to kill targeted diseased tissues.1 It has been successfully applied to a wide range of medical conditions, such as skin conditions and cancer treatment. During a PDT treatment, photosensitizer is activated from ground state to excited state by photons when exposed to a treatment light source; then it decays to a triplet excited state, which interacts with molecular oxygen to create reactive oxygen species including singlet oxygen (), which is highly cytotoxic.2 Therefore, there are three interacting components: photosensitizer (PS), light administration, and oxygen involved in PDT. Oxygen level plays an important role, as PDT relies on oxygen in the surrounding environment to generate cytotoxic reactive species. To optimize outcomes in clinical practices, real-time evaluation of PDT treatment is of significant importance and urgently needed.3 Although light dosimetry measurement is important, other factors such as PS distribution, concentration and light fluence (rate), and biological response monitoring are effective means to evaluate the efficacy of PDT as it is a direct reflection of the treatment outcomes.4 By using PSs with high affinity for vascular endothelial cells, PDT can target vasculature in soft tissue.5 Imaging vasculature is important for these applications. A number of techniques can be used to accomplish this task, for example, magnetic resonance angiography, which is a group of techniques (including dynamic contrast enhancement) to image blood vessel effects based on magnetic resonance imaging.6,7 However, it requires imaging contrast agent, long scanning time, comparatively high cost, and can provide only limited spatial resolution. Positron emission tomography also requires contrast agents to visualize vasculature.8,9 Ultrasound Doppler imaging has been widely applied to vasculature (blood flow) imaging. However, only modest spatial resolution can be provided.10 Recently, optical techniques such as laser Doppler imaging11,12 and laser speckle imaging13 have been proposed to study vasculature. However, these techniques suffer from either limited penetration depth due to highly scattered photons in soft tissue, limited resolution, or difficulty to target specific regions of interest in practice. Optical coherence tomography (OCT) has been applied to PDT.14,4 Jung et al. used time-lapse OCT to image microscale response of in vitro models to PDT.15 Hamdoon et al. used OCT to image tumor cancer to guide PDT in human skin cancer treatment.16 Doppler optical coherence tomography, an extention of OCT, which measures frequency shifts due to moving particles, has been employed to study microvascular tissue response in PDT in animal models.14,17,18 Although different methods have been proposed, estimation of oxygen saturation with OCT is still nontrivial.19,20 Photoacoustic (PA) imaging is an imaging modality being intensively studied recently because of its promise for combined high resolution and intrinsic optical contrast, which can reveal important physiological information without the assistance of contrast agents.21 Imaging contrast in PA imaging is primarily provided by optical absorption. As hemoglobin in blood is the dominant absorber in soft tissue to provide optical contrast in the visible wavelength window, PA imaging techniques have been applied to a wide spectrum of topics for both morphological and functional studies related to blood vasculature.22–24 Xiang et al.25 reported using a computed photoacoustic tomography (PAT) imaging system to monitor vascular damage in PDT on a chick chorioallantoic membrane (CAM) tumor model. In their study, a single pulsed laser with a wavelength of 532 nm served as the light source for both PA imaging and PDT. Protoporphyrin IX was used as the PS. They visualized neovascularization in tumor angiogenesis and then verified the capability of PAT for imaging vascular injury induced by PDT. However, only blood vessel size change was studied in their report. Their study was also limited to topical application of PS on the CAM model. Mallidi et al.26 used ultrasound-guided PA imaging to map three-dimensional (3-D) atlas of tumor oxygen saturation () change due in PDT. However, this study is limited to large-scale maps rather than at single blood vessel level. In this paper, we report our work on monitoring both morphological and functional information variations due to PDT with acoustic-resolution photoacoustic microscopy (PAM). With the wavelength tunability of our laser system, we are able to image change of areas of interest during PDT, besides structural variations. We studied effects of PDT in a rat ear model with intravenous (IV) injection of PS from a tail vein, and topical application of PS on a CAM model. 2.Methodology2.1.Experiment SetupThe experiment setup is shown in Fig. 1. We used a tunable nanosecond pulsed dye laser (ND6000, Continuum, Santa Clara, California) as the light source for PA imaging. The laser has a tunable wavelength range between 420 and 900 nm with proper selected dyes. Pulse-repetition rate is 10 Hz and the output energy can reach up to (with Rhodamine 6G). Pulse duration is . For the present study, we used Rhodamine 590 (Exciton, Dayton, Ohio), whose emission range with our pumping source is 552 to 584 nm. We utilized 560 nm for structural imaging. For oxygen saturation measurement, 560 and 576 nm were employed. The laser pulse was coupled into a multimode optical fiber. The pulses coming out of the fiber were first collimated. After being focused by a microscope objective lens, it was directed to the subject/target by a custom-made imaging probe, which consists of two right-angle prisms. An ultrasound transducer (V214-BB-RM, Olympus) with a 50 MHz center frequency was coupled with the probe acoustically. An optically transparent acoustic lens was positioned under the probe for acoustic focusing. Ultrasonic gel was applied between the acoustic lens and the sample to couple sound waves. PA signals (A-lines) detected by the transducer were digitized by a high-speed digitizer and then transferred to a PC for further processing. To realize raster scanning during the imaging task, the object was positioned on a three-axis motion stage, which was controlled by a PC through a motion control card.27 In the present paper, 15 min were needed for each rastered image acquisition with a field-of-view size of . Lateral and axial resolutions of our system were quantified to be and , respectively. Energy used for imaging was , and the laser fluence on animal skin surface was limited to be below , set by the ANSI safety standard for the wavelength range used here. Fig. 1Experiment setup. OL, optical lens; MF, multimode fiber; Ob. L, objective lens; UST, ultrasonic transducer; AL, acoustic lens; AP, aperture; M, mirror; DAQ, data acquisition card; MC, motion controller. 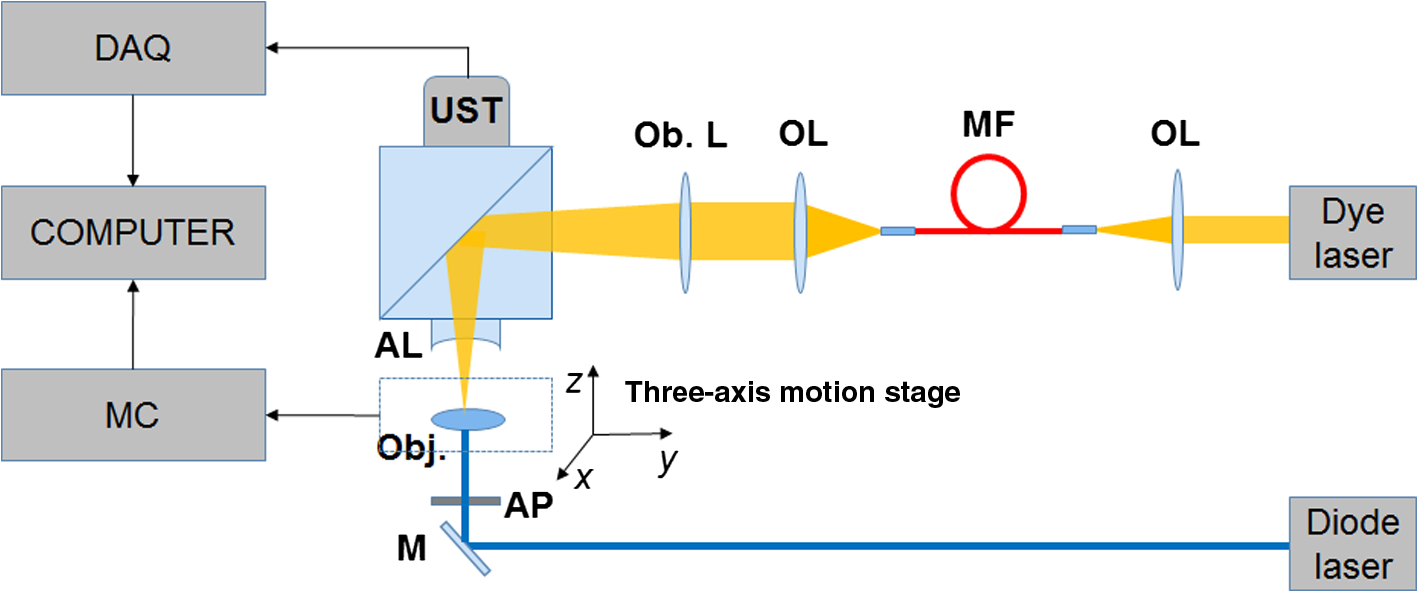 A representative whole rat ear 3-D dataset and the corresponding two-dimensional (2-D) image generated with maximum amplitude projection (MAP) method demonstrated the imaging capability of this system.(Fig. 2) In the remaining sections of the present paper, we use 2-D MAP images for quantitative analysis. A diode laser with a wavelength (Ultralasers, Newmarket, Ontario, Canada) was utilized for PDT. The laser beam was directed to an aperture to adjust the beam size for treatment and, thus, to control the optical fluence on the surface of the subjects. 2.2.PhotosensitizerVerteporfin (129497-78-5, Sigma-Aldrich, St. Louis, Missouri) was utilized as the PS. Verteporfin 3.6 mg was first dissolved in dimethyl sulfoxide and then diluted with phosphate buffered saline to various concentrations for the experiments. During preparation, handling, and storage, the solution was protected from light. 2.3.Imaging and Data AnalysisTo validate the capability of our system to image vasculature change due to PDT, a preliminary study was conducted with the CAM model. We imaged three eight-week-old chick embryos, which all received 20 min light illuminations. The laser illumination was conducted on embryo #1 without use of PS as a comparison control. Verteporfin was applied topically to the regions of treatment 15 min before treatment on the membrane of chick embryos #2 and #3. PAM imaging was performed before and after treatments for the embryos #1 and #2. Then we conducted a longitudinal study with the CAM of embryo #3, for which sequential images were obtained at every 10-min interval. We also examined the feasibility of our technique with a rat ear model. Experimental procedures followed the laboratory animal protocol approved by the University of Alberta Animal Use and Care Committee. An animal anesthesia system was utilized while image data were collected. Verteporfin was injected via a tail vein of 60-g-weight Sprague Dawley (Charles River Laboratories, Wilmington, Massachusetts) rats ( animals) with a dose of , as suggested in the literature.28 Before an experiment, the rats’ ears were processed with hair removal cream for 10 min and then cleaned with warm water. PDT was started 20 min after each of the injection. Light irradiance on the skin surface for the treatment was . During the experiment, the treatment was temporally stopped every 5 min for PAM imaging. To quantify blood vessel structural change due to PDT, we compared the diameter of one selected major blood vessel in the PAM images induced by the treatment for each animal. Only blood vessels in the treatment areas with diameter around two to three times larger than the imaging lateral resolution were selected for analysis. Full width at half maximum of the identical feature was used to measure the diameter in longitudinally acquired images for comparison. For a single blood vessel, measurements were taken at multiple locations along the axial direction of the vessel, and data were presented as . Oxygen saturation of target blood vessels in the treatment area was measured at multiple time spots longitudinally during PDT in rats’ ears () to demonstrate variations. We utilized the dual-wavelength assessment method described in Ref. 29. At each target blood vessel location, 100 PA measurements with both wavelengths were recorded and averaged to suppress noise effects. 3.ResultsResults of the CAM imaging are shown in Fig. 3. The two treatment regions in PAM images [Figs. 3(a) and 3(b) (chick embryo #1) and Figs. 3(c) and 3(d) (embryo #2)] received the same illumination irradiance () before and after the same PDT duration (20 min). Figures 3(a) and 3(b) are the PAM images of the comparison control area taken before and after the light illumination without PS, while Figs. 3(c) and 3(d) are the images acquired before and after the treatment with PS topically applied. We also obtained sequential images during a treatment on chick embryo #3 at intervals of 5 min (data not shown, total PDT duration 30 min) to quantify vasculature variations due to the treatment. To better visualize the graduate vasculature change, we utilized less optical fluence rate for embryo #3, which was . Figures 3(e) and 3(f) are the PAM images acquired before and after this treatment. Although vasculature remained the same in the image of the control area [Figs. 3(a) and 3(b)], a dramatic change was visualized in the treatment region [Figs. 3(c) and 3(d)]. Major blood vessel structures (with diameters ) were destroyed. Capillary networks too small to be resolved were seen as cloudy signal areas. Such capillary beds were also partially damaged, leaving bleeding/leaking spots (bright spots) with extravasation. We measured the size change of blood vessels with an original diameter of [boxed in Figs. 3(e) and 3(f)] along with the treatment, as is shown in Fig. 4. On average, the diameter of the blood vessel experienced a steady decrease of up to of its original value. After the therapy, discontinuities appeared in the circled vessel, which may be thrombi after the treatment. Fig. 3Structrual variations of blood vessel vasculature on a chorioallantoic membrane model. (a) and (b) control group; (c) and (d) vasculature change before and after a 15-min treatment with light power; (e) and (f) vasculature before and after a 30-min photodynamic therapy (PDT) with optical power.  Resultant images of the rat ear imaging are shown in Fig. 5 with the same color map. Although no obvious morphological changes were observed in the control group animals as is shown in Fig. 5(a), both PAM images and white-light pictures of the treatment area [darkened area in the left image of Fig. 5(b)] showed destruction of blood vessels. Absence of blood vessel structure was observed in the white-light pictures, with enlargement of the bleached area during the treatment. This suggested variations of vasculature and was confirmed by destruction of vessel structures in PAM images [top row of Fig. 5(b)]. We measured diameter change of one target vessel in the treatment areas induced by PDT in each of the three rats (labeled with dashed rectangular). It should be noted that more serious destruction of blood vessel structures in the 15-min PAM image may be due to dilation of soft tissue caused by PDT. Nevertheless, the quantitative analysis of blood vessel change did show size decrease. We repeated the experiments ( animals), and the results are presented in Fig. 6 as of the measurement. Target vessels shrank to of their original size after 30-min treatments. This change agrees with previous reports in the literature describing blood vessel diameter decrease due to blood vessel constriction, which is a normal biological response to PDT.25 This was followed by destruction of blood vessel architecture, which was observed after a 45-min treatment. Fig. 5Vasculature change of a rat ear model with a 45-min PDT: (a) results from the control group with only treatment light but no photosensitizer and (b) white-light pictures and PAM images of the treatment area.  We longitudinally examined the oxygen saturation levels of target vessels during the treatment to demonstrate the capabilities of PAM in real-time monitoring of oxygen levels in PDT, and the data presented in Fig. 7(a) are the average change on one target vessel in each of the three animals, and in Figs. 7(b)–7(d), we plot the data points collected on all the three animals. Measurements of in the target vessels were obtained at 15-min intervals during treatments. A quick decrease of oxygenation was observed after the first treatment interval, which then gradually recovered even with the presence of the treatment light. The recovery reached a level slightly lower than its original status, along with constriction of blood vessels after 30 min of treatment. As destruction of blood vessels begins to appear after 30 min of treatment, as is shown in Fig. 5, oxygen levels measured 45 min after the initiation of PDT showed significant inconsistency. Nevertheless, an immediate drop-recover cycle was observed in the three treated animals (). 4.Conclusion and DiscussionWe report our initial feasibility studies of parametric imaging of vasculature response to PDT with PAM with both structural and functional parameters. We measured size and oxygen level variations in single blood vessels during PDT. We observed consistent major blood vessel size decrease along the PDT. We believe this is due to blood vessel constriction1 described in previous reports. This follows destruction of the blood vessel and thrombus, which can be observed as blood vessel discontinuities in PA images. Microcapillaries whose dimensions are below the resolving capabilities of our imaging system were observed as cloudy structures. During PDT, destruction of these structures lost PA signals, leaving black areas in the PA images. However, it is interesting to note that in some areas, bright spots can be observed after the treatment. We believe this is micro-hemorrhaging due to damage of small blood vessels, but this still needs careful studies to verify. PA imaging has the capability of imaging oxygen saturation in blood vessels via assessing the relative concentration of oxy- and dexoyhemoglobin. To demonstrate that this can be utilized in monitoring PDT, we longitudinally measured level change in target vessels during the treatment. We observed a quick level decrease after the treatment was initiated, which we believe was a result of immediate consumption of oxygen due to generation of reactive species. This followed a graduated oxygenation recovery in the vessels afterward, which ended at a level that was lower than its original status. However, we would like to note that relatively big variations of levels were observed at the end of each treatment experiment. The inconsistence might be due to the complex status of blood vessels including blood vessel structural damages. This study, however, has several limitations. Structural information monitoring was not in real time. The treatment was stopped temporarily to perform the measurements as mechanical scanning of the target was required by our current imaging system. This limitation could be solved by development of a faster imaging system. Though only superficial vasculature parameters were imaged in the present report, PAM is scalable to deeper depths at the cost of sacrificing spatial resolution, so imaging to depths of 2 to 3 mm is anticipated.30 Whereas our system is immediately useful for medical conditions such as port wine stain,13 one can turn to micro-endoscopic PA imaging systems for imaging internal body structures. A number of directions can be enlisted as our future work. Examples include studying responses to PDT in terms of these parameters, such as blood flow velocity, PA imaging of PS distribution before PDT,31 PA-guided light dosimetry estimation, etc. These efforts will significantly benefit the PDT practices such as personal treatment planning, therapy monitoring, and prognosis. AcknowledgmentsWe gratefully acknowledge funding from the Terry-Fox Foundation and the Canadian Cancer Society (TFF 019237, TFF 019240, CCS 2011-700718, CCS 702032), NSERC (355544-2008, 375340-2009, STPGP 396444, RGPIN 355544), Prostate Cancer Canada (PCC MVBRDG D2013-40), Alberta Innovates Health Solutions (AIHS) CRIO Team Grants, the Canada Foundation for Innovation, Leaders Opportunity Fund (18472), and Alberta Advanced Education & Technology, Small Equipment Grants Program (URSI09007SEG). ReferencesT. J. Dougherty et al.,
“Photodynamic therapy,”
J. Natl. Cancer Inst., 90 889
–905
(1998). http://dx.doi.org/10.1093/jnci/90.12.889 JNCIEQ Google Scholar
D. E. Dolmans, D. Fukumura and R. K. Jain,
“Photodynamic therapy for cancer,”
Nat. Rev. Cancer, 3 380
–387
(2003). http://dx.doi.org/10.1038/nrc1071 NRCAC4 1474-175X Google Scholar
B. Li, Z. Qiu and Z. Huang,
“Advanced optical techniques for monitoring dosimetric parameters in photodynamic therapy,”
Proc. SPIE, 8553 85530F
(2012). http://dx.doi.org/10.1117/12.2001727 Google Scholar
J. P. Celli et al.,
“Imaging and photodynamic therapy: mechanisms, monitoring, and optimization,”
Chem. Rev., 110 2795
–2838
(2010). http://dx.doi.org/10.1021/cr900300p CHREAY 0009-2665 Google Scholar
B. Chen et al.,
“Vascular and cellular targeting for photodynamic therapy,”
Crit. Rev. Eukaryot. Gene Expr., 16 279
–306
(2006). http://dx.doi.org/10.1615/CritRevEukarGeneExpr.v16.i4.10 CRGEEJ 1045-4403 Google Scholar
M. P. Hartung, T. M. Grist and C. J. François,
“Magnetic resonance angiography: current status and future directions,”
J. Cardiovasc. Magn. Reson., 13
(19),
(2011). http://dx.doi.org/10.1186/1532-429X-13-19 Google Scholar
Z. Xiao et al.,
“Fractionated versus standard continuous light delivery in interstitial photodynamic therapy of dunning prostate carcinomas cancer therapy: preclinical fractionated versus standard continuous light delivery in interstitial photodynamic therapy of dunning,”
Clin. Cancer Res., 13 7496
–7505
(2007). http://dx.doi.org/10.1158/1078-0432.CCR-07-1561 Google Scholar
S. Valable et al.,
“Complementary information from magnetic resonance imaging and (18)F-fluoromisonidazole positron emission tomography in the assessment of the response to an antiangiogenic treatment in a rat brain tumor model,”
Nucl. Med. Biol., 38 781
–793
(2011). http://dx.doi.org/10.1016/j.nucmedbio.2011.01.010 Google Scholar
D. W. Chapman et al.,
“Detecting functional changes with [18F] FAZA in a renal cell carcinoma mouse model following sunitinib therapy,”
Eur. J. Nucl. Med. Mol. Imaging, 4 27
(2014). http://dx.doi.org/10.1186/s13550-014-0027-5 Google Scholar
R. S. C. Cobbold, Foundations of Biomedical Ultrasound, Oxford University Press, New York
(2006). Google Scholar
A. Major et al.,
“Microvascular photodynamic effects determined in vivo using optical Doppler tomography,”
IEEE J. Sel. Topics Quantum Electron., 5 1168
–1175
(1999). http://dx.doi.org/10.1109/2944.796343 IJSQEN 1077-260X Google Scholar
J. Tyrrell et al.,
“Oxygen saturation and perfusion changes during dermatological methylaminolaevulinate photodynamic therapy,”
Br. J. Dermatol., 165 1323
–1331
(2011). http://dx.doi.org/10.1111/j.1365-2133.2011.10554.x BJDEAZ 0007-0963 Google Scholar
H. Qiu et al.,
“Monitoring microcirculation changes in port wine stains during vascular targeted photodynamic therapy by laser speckle imaging,”
Photochem. Photobiol., 88 978
–984
(2012). http://dx.doi.org/10.1111/j.1751-1097.2012.01153.x PHCBAP 0031-8655 Google Scholar
M. C. Pierce et al.,
“Advances in optical coherence tomography imaging for dermatology,”
J. Invest. Dermatol., 123 458
–463
(2004). http://dx.doi.org/10.1111/j.0022-202X.2004.23404.x JIDEAE 0022-202X Google Scholar
Y. Jung et al.,
“Label-free, longitudinal visualization of PDT response in vitro with optical coherence tomography,”
Isr. J. Chem., 52 728
–744
(2012). http://dx.doi.org/10.1002/ijch.201200009 ISJCAT 0021-2148 Google Scholar
Z. Hamdoon et al.,
“Optical coherence tomography-guided photodynamic therapy for skin cancer: case study,”
Photodiagnosis Photodyn. Ther., 8 49
–52
(2011). http://dx.doi.org/10.1016/j.pdpdt.2010.08.004 Google Scholar
B. A. Standish et al.,
“Doppler optical coherence tomography monitoring of microvascular tissue response during photodynamic therapy in an animal model of Barrett’s esophagus,”
Gastrointest. Endosc., 66 326
–333
(2007). http://dx.doi.org/10.1016/j.gie.2007.02.040 Google Scholar
B. A. Standish et al.,
“Interstitial Doppler optical coherence tomography monitors microvascular changes during photodynamic therapy in a dunning prostate model under varying treatment conditions,”
J. Biomed. Opt., 12 034022
(2007). http://dx.doi.org/10.1117/1.2744068 JBOPFO 1083-3668 Google Scholar
B. Yin et al.,
“Dual-wavelength photothermal optical coherence tomography for imaging microvasculature blood oxygen saturation,”
J. Biomed. Opt., 18 056005
(2013). http://dx.doi.org/10.1117/1.JBO.18.5.056005 JBOPFO 1083-3668 Google Scholar
J. Yi et al.,
“In vivo functional microangiography by visible-light optical coherence tomography,”
Biomed. Opt. Express, 5 3603
–3612
(2014). http://dx.doi.org/10.1364/BOE.5.003603 BOEICL 2156-7085 Google Scholar
M. Xu and L. V. Wang,
“Photoacoustic imaging in biomedicine,”
Rev. Sci. Instrum., 77 041101
(2006). http://dx.doi.org/10.1063/1.2195024 RSINAK 0034-6748 Google Scholar
L. V. Wang and S. Hu,
“Photoacoustic tomography: in vivo imaging from organelles to organs,”
Science, 335 1458
–1462
(2012). http://dx.doi.org/10.1126/science.1216210 SCIEAS 0036-8075 Google Scholar
H. Fang, K. Maslov and L. Wang,
“Photoacoustic Doppler effect from flowing small light-absorbing particles,”
Phys. Rev. Lett., 99 184501
(2007). http://dx.doi.org/10.1103/PhysRevLett.99.184501 PRLTAO 0031-9007 Google Scholar
W. Shi et al.,
“In vivo dynamic process imaging using real-time optical-resolution photoacoustic microscopy,”
J. Biomed. Opt., 18 026001
(2013). http://dx.doi.org/10.1117/1.JBO.18.2.026001 JBOPFO 1083-3668 Google Scholar
L. Xiang et al.,
“Real-time optoacoustic monitoring of vascular damage during photodynamic therapy treatment of tumor,”
J. Biomed. Opt., 12 014001
(2007). http://dx.doi.org/10.1117/1.2437752 JBOPFO 1083-3668 Google Scholar
S. Mallidi et al.,
“Prediction of tumor recurrence and therapy monitoring using ultrasound-guided photoacoustic imaging,”
Theranostics, 5 289
–301
(2015). http://dx.doi.org/10.7150/thno.10155 Google Scholar
P. Shao et al.,
“Mosaic acquisition and processing for optical-resolution photoacoustic microscopy,”
J. Biomed. Opt., 17 080503
(2012). http://dx.doi.org/10.1117/1.JBO.17.8.080503 JBOPFO 1083-3668 Google Scholar
K. Kurohane et al.,
“Photodynamic therapy targeted to tumor-induced angiogenic vessels,”
Cancer Lett., 167 49
–56
(2001). http://dx.doi.org/10.1016/S0304-3835(01)00475-X CALEDQ 0304-3835 Google Scholar
H. F. Zhang et al.,
“Imaging of hemoglobin oxygen saturation variations in single vessels in vivo using photoacoustic microscopy,”
Appl. Phys. Lett., 90 053901
(2007). http://dx.doi.org/10.1063/1.2435697 APPLAB 0003-6951 Google Scholar
H. F. Zhang et al.,
“In vivo volumetric imaging of subcutaneous microvasculature by photoacoustic microscopy,”
Opt. Express, 14 9317
–9323
(2006). http://dx.doi.org/10.1364/OE.14.009317 OPEXFF 1094-4087 Google Scholar
A. Hirao et al.,
“In vivo photoacoustic monitoring of photosensitizer distribution in burned skin for antibacterial photodynamic therapy,”
Photochem. Photobiol., 86 426
–430
(2010). http://dx.doi.org/10.1111/j.1751-1097.2009.00683.x PHCBAP 0031-8655 Google Scholar
BiographyPeng Shao received his PhD in biomedical engineering from the University of Alberta in 2014, under the supervision of Dr. Roger J. Zemp. Currently, he is a postdoctoral research fellow at Harvard Medical School. His research interests include biomedical imaging, image processing, and physiological measurements. He is a member of SPIE. David W. Chapman: is a third-year medical school student at the University of Alberta, and he has a special interest in urological malignancy and reconstructive urology. He holds an MSc from the University of Alberta specializing in experimental surgery, investigating novel therapeutics and imaging modalities for renal cell carcinoma. Ronald B. Moore is a surgeon-scientist and professor of surgery and oncology at the University of Alberta. He completed his MD (1986) and PhD (1991) at the University of Alberta and then speciality training in urology and oncology. His research interests are in novel therapies for urological malignancies including photodynamic and other vascular targeted therapies. He holds the Mr. Lube chair in uro-oncology research and has authored over 95 journal publications and 180 conference abstracts. Roger J. Zemp is an associate professor of electrical and computer engineering and biomedical engineering at the University of Alberta. He earned his PhD in biomedical engineering at the University of California, Davis, in 2004. His research interests include biomedical optics and biomedical ultrasound. He has authored over 58 journal publications and 117 conference papers or abstracts. |