

|
|
1.IntroductionNear-infrared spectroscopy (NIRS) is extensively tested as an optical method for assessment of the brain oxygenation in adults. Continuous wave,1,2 frequency-domain,3,4 and time-domain5 measurement techniques were successfully applied in in vivo studies showing promising results. Functional NIRS (Ref. 6) allows for monitoring of oxygenation changes in the brain’s cortex during a variety of stimulations in analogy to functional magnetic resonance imaging technique. Furthermore, recent studies showed that connectivity on the cortex can be studied by the application of dense grids of sources and detectors positioned on the surface of the head.7–11 This advanced technique needs analysis of signals measured at multiple source-detector separations in order to minimize the influence of changes in oxygenation of the extracerebral tissue layers on the measured signals of changes in oxy- and deoxyhemoglobin.12–16 A different optical technique that can be potentially used for intraoperative mapping of the human cortex during neurosurgery is the imaging of intrinsic optical signals.17,18 This technique is based on measuring the intrinsic activity-related changes in tissue reflectance, caused by the functional physiological changes in blood volume, hemoglobin, or oximetry changes. Another path of development of optical techniques for assessment of the cerebral perfusion represent studies in which the diffuse reflectance NIRS measurements were carried out during inflow and washout of indocyanine green (ICG).19–21 Intravenous injection and monitoring of this optical contrast agent, which reveals strong absorption for near-infrared radiation, allows for assessment of brain perfusion, which is typically based on estimation of the time between injection and maximum of the dye concentration in the tissue under investigation.22–27 Recently, it was reported that time-resolved spectroscopy may be of benefit for such brain perfusion studies.28–30 It was shown that higher-order moments of the distributions of time of flight of photons (DTOFs) measured on the surface of the head (mean time of flight and variance of the DTOF) are more sensitive to the changes in absorption of the brain tissue related to the inflow of the ICG than total number of photons (zeroth-order moment of the DTOF), which reveals sensitivity to changes in absorption of the extracerebral tissue layers.31,32 However, higher-order statistical moments of the DTOFs are sensitive to noise. This effect is especially pronounced in measurements carried out at large source-detector separations in which the number of detected photons is limited.33,34 The aim of the study was to evaluate the dependence of the signals related to the inflow of the ICG on the source-detector separation. This analysis will be presented in the context of optimization of the source-detector separation used in the estimation of the brain perfusion parameters. Optimized selection of the statistical moments used in brain perfusion studies will also be discussed. Results of Monte Carlo (MC) simulations, phantom experiments, and in vivo tests carried out at multiple source-detector separations with the use of a time-resolved technique will be presented. 2.Methods2.1.Monte Carlo SimulationsThe MC code used for the study was described in detail earlier.35–37 The algorithm allows for efficient simulations of DTOFs at different source-detector separations for different combinations of absorption properties of the layered medium. The statistical moments of the DTOFs related to the absorption coefficient change resulting from simulated inflow and washout of the ICG to two layers of the model (lower and upper) mimicking intra and extracerebral tissue compartments were analyzed. The temporal changes in absorption of the dye, , were simulated independently for both layers of the medium according to the functions proposed by Leung et al.36,38 Initial optical properties of the medium were as follows: absorption coefficient of the medium , reduced scattering coefficient of the medium , and refractive index . Initially, the superficial layer was assumed to be 1 cm thick and the deeper layer was 1 m thick (which simulates semi-infinite medium). Amplitudes of the changes of the absorption coefficient in the upper and lower layers were chosen in the range from 0.002 to . The DTOFs were obtained at 67 source-detector separations (from 0.1 to 6.7 cm). Because at the largest source-detector separations only a small number of photons are re-emitted, the simulations were carried out for a large total number of photon packages . 2.2.InstrumentationTime-resolved laboratory system based on eight photomultiplier tubes (PMT, R7400U−02, Hamamatsu Photonics, Japan) and eight time-correlated single photon counting (TCSPC) cards (SPC-134, Becker and Hickl, Berlin, Germany)39–41 was used in combination with femtosecond MaiTai laser (Spectra Physics),33,42 allowing the measurement of 16 DTOFs simultaneously. Laser pulses were generated at a wavelength of 760 nm with a frequency of 80 MHz. The wavelength used in the experiments was selected close to the maximum of the absorption spectrum of ICG and with consideration of the properties of filters used in order to block the fluorescence light.21,36 The laser light was coupled into two fibers (1.5 and 3 m long, , ) used to deliver the light to the phantom or the head of the healthy volunteer. Two beam expanders (F810SMA-780 and F220SMA-B, Thorlabs, Sweden) were applied on the tips of the source fibers in order to distribute the laser light on large areas of the tissue (15 and 8 mm diameter). This solution allowed us to keep the laser power density on the surface of the head below the safety limits (). The laser light powers at the tips of the source fibers were 200 and 20 mW, respectively. Eight fiber bundles of diameter 7 mm with active area of diameter 4 mm (, Loptek, Germany) were used to deliver the light re-emitted for the phantom or tissue to the photodetectors. The short-pass filters (NT47−586, Edmund Optics) with cut-off wavelength of were mounted in front of the PMTs in order to block the fluorescence light. The combination of the two source positions and eight detection spots allowed for monitoring of optical signals for 16 source-detector separations in the range to 67.5 mm. The laser beam (output from MaiTai laser) was split into two light paths, which were coupled into two optical fibers. In this way, the laser pulses transmitted into the tissue or phantom using these two fibers were delayed by . 2.3.Phantom ExperimentsThe phantom consisted of a fish tank () filled with a mixture of milk (fat content 3.2%) and water with small amount of ink (Black Indian Ink, Winsor & Newton). The solution of milk, water, and ink was used to obtain optical properties corresponding to properties of human tissue ( and ). The optical properties of the medium were obtained by time-resolved measurements and by analysis of the statistical moments of the measured DTOFs.43 The measurements were carried out on the homogeneous phantom in which two transparent PVC tubes (inner diameter and outer diameter) were located at different depths (0 and 2 cm) with respect to the surface of the phantom. The measurements were carried out at 16 source-detector separations (see Fig. 1) by positioning the optodes holder equipped with two source fibers and eight detecting fiber bundles on the surface of the phantom. Fig. 1The optode holder used in the phantom and in vivo studies. Red rings mark the positions of the beam expanders (source positions) and blue rings reflect locations of the tips of the detection fiber bundles.  In order to mimic dynamic inflow of the dye through the tubes located deeper and more superficial, a laboratory setup equipped with a peristaltic pump44 was applied in order to pump through the tubes the same solution of milk, water, and ink that filled out the phantom. Furthermore, two independent boluses of ICG were injected into the two tubes located at different depths with a defined delay between them. First, the bolus was injected into the tube located deeper, which mimics realistic sequence of inflow of the bolus to the intra and extracerebral tissue compartments. 2.4.In Vivo MeasurementsThe in vivo measurements were carried out on three healthy volunteers (mean age 36, the coauthors of the paper). The measurements protocol was approved by the Ethics Committee of the Medical University of Warsaw. In each case, a written informed consent was obtained from the subject. The subjects were examined in supine position. The optodes were fixed on the surface of the head with the use of rubber foam and Velcro stripes. The optodes were positioned on the right frontal area of the head below the line of hairs. A dose of 10 mg of ICG (Pulsion, Germany) dissolved in 5 mL of aqua pro injectione was administrated into the left forearm vein. 2.5.Data AnalysisIn the preprocessing phase in the measured DTOFs, the background signal was subtracted and correction of nonlinearity of the TCSPC electronics was applied. The statistical moments of the simulated and measured DTOFs (number of photons , mean time of flight , and variance ) were derived from the parts of the distributions limited by 3% of their maxima.43 Time-courses of the statistical moments calculated for different source-detector separations were normalized and the time-to-peak (TTP) corresponding to the maximum of amplitude change caused by the ICG inflow was calculated. Typically the TTP values decrease with the order of the statistical moment () as shown in Fig. 2. Fig. 2Presentation of the data processing principle [time-to-peak (TTP) parameter calculation from the time-courses of the statistical moments of distribution of time of flights of photons (DTOFs)] on the data obtained by Monte Carlo (MC) simulations. 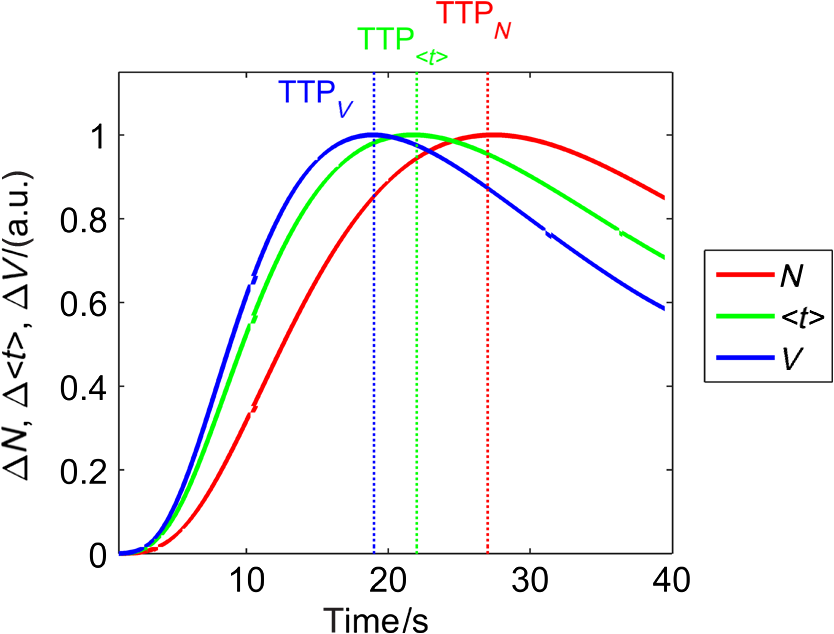 In the next step, values for each statistical moment were calculated. In the case of MC simulations, was estimated as the difference between the calculated TTP values and reference value, which was obtained for simulated inflow function for the lower layer of the model.38 In the phantom studies and in vivo measurements, the reference value was determined for each of the experiments as the minimal value of . In the case of MC simulations, was obtained by the analysis of the simulated inflow function for the upper layer of the model. In the phantom studies and in vivo measurements, the reference value was determined for each experiment as the maximal value of . 3.Results3.1.Monte Carlo SimulationsResults of the analysis of obtained for different statistical moments of DTOFs calculated by MC simulations for different thickness of the upper layer (from 6 to 12 mm) are presented in Fig. 3. In these simulations, the reduced scattering coefficient was assumed to be . It should be noted that approaches zero when the simulated signal perfectly reveals the inflow of the dye to the deeper layer of the model. It can be observed that for thin extracerebral tissue compartment, all statistical moments can provide information corresponding to the deeper tissue compartment even for source-detector separations . However, increase in the thickness of the upper layer causes the obtained from the signals of the total number of photons to be strongly overestimated. This effect, with lesser extent, can be observed for higher-order statistical moments. Only small discrepancy between the estimated and expected value of can be observed () for source-detector separations when the variance of the DTOF is analyzed. Fig. 3Analysis of the results of the MC simulations. Changes in obtained at different source-detector separations and different upper layer thickness for three moments of DTOFs: total number of photons , mean time of flight , and variance of the DTOF . The reduced scattering coefficient was assumed to be . 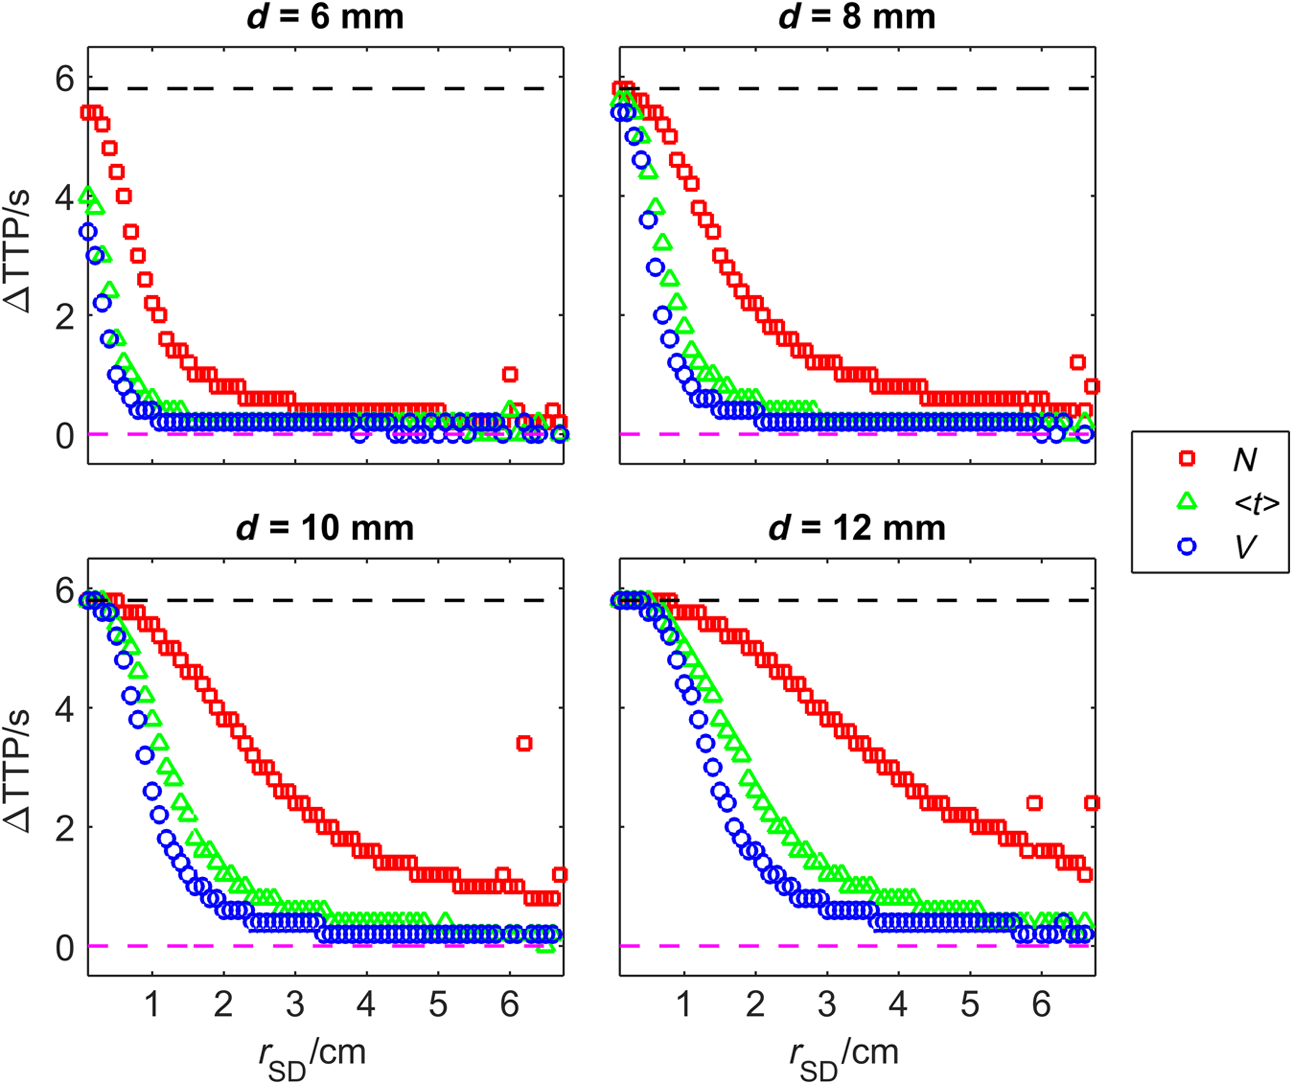 Results of the second series of MC simulations are presented in Fig. 4. Analysis of was carried out for media of different reduced scattering coefficient . It can be observed that scattering properties of the medium strongly influence the sensitivity of the moments to the inflow of the dye to the deeper layer of the model. The increase in leads to strong discrepancy between the estimated and expected value of when the total number of photons is analyzed. This effect can also be observed for higher-order statistical moments, but this discrepancy remains relatively small () for all values of and large source-detector separations () when the variance of the DTOF is analyzed. Fig. 4Analysis of the results of the MC simulations. Changes in obtained at different source-detector separations and different reduced scattering coefficient of the medium for three moments of DTOFs: total number of photons , mean time of flight , and variance of the DTOF . The thickness of the upper layer was assumed to be 10 mm.  Results of the last series of MC simulations are presented in Fig. 5. Analysis of was carried out for different relations between amplitudes of changes in absorption of the dye for both layers of the model. It can be observed that increase in the amplitude of change in the absorption coefficient in the upper layer of the model results in increase in discrepancy of estimation. When the amplitude of change in the upper layer of the model is two times larger than that in the lower layer, the uncertainty of estimation is only for signal obtained at source-detector separation . Fig. 5Analysis of results of the MC simulations obtained for different amplitudes of change in absorption coefficient in the upper layer of the model. (a) Dynamic changes in absorption coefficient in upper and lower layer of the model and (b) corresponding changes in at different source-detector separations calculated for: total number of photons , mean time of flight and variance of the DTOFs. The thickness of the upper layer was assumed to be 10 mm and the reduced scattering coefficient was assumed to be .  3.2.Phantom ExperimentsThe results of the phantom experiments are presented in Fig. 6. Obtained results show trends similar to those presented in the MC simulations. For larger delays between bolus appearance in the tubes located deeper and superficially, changes quickly with source-detector separation. Moreover, as expected, the uncertainty of estimation is lower when the delay in appearance of the boluses in the deeper and superficial tubes is larger. Fig. 6Results obtained during phantom experiments. Changes in obtained at different source-detector separations for three delays between the appearances of the boluses of indocyanine green (ICG) in the tubes located superficially and deeper in the medium. Results of the analysis of three moments of DTOFs: total number of photons , mean time of flight , and variance of the DTOF. 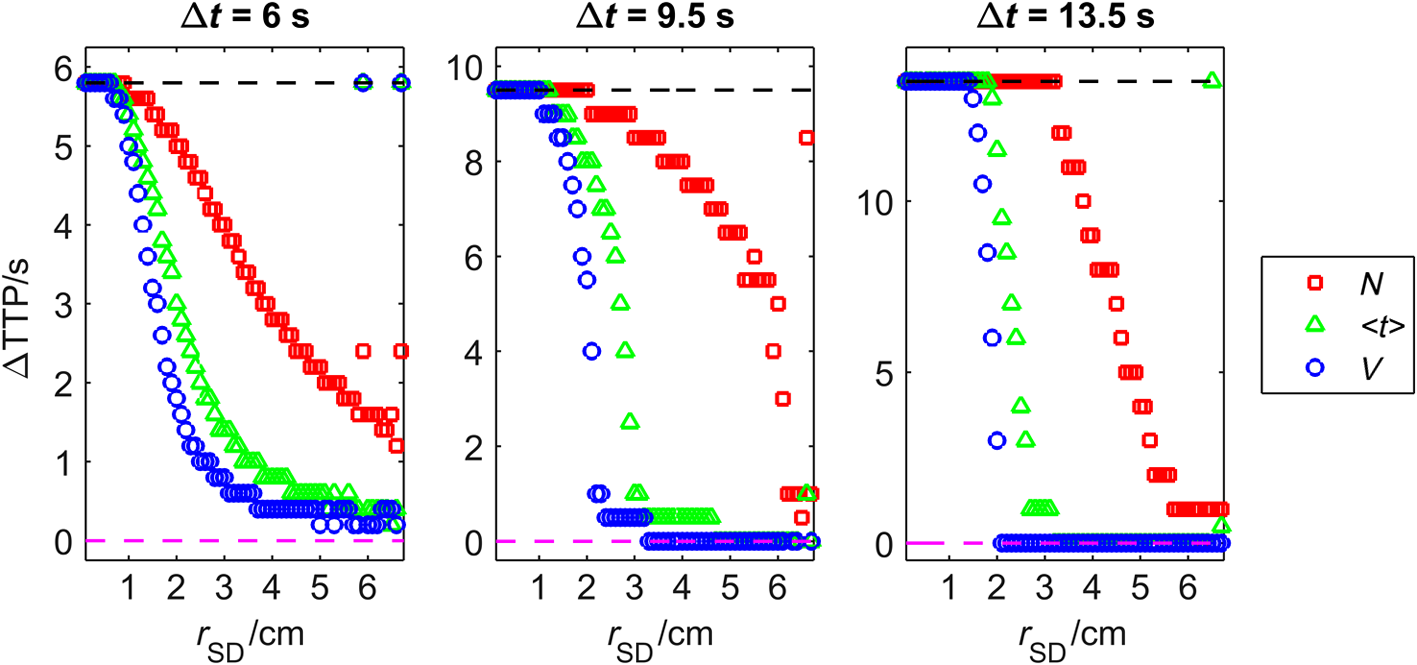 3.3.In Vivo MeasurementsThe DTOFs were obtained for 16 source-detector separations (from 1 to 6.75 cm) during in vivo (see Fig. 7) tests carried out in healthy volunteers. As presented in Fig. 7, results of these experiments confirm the trends that were observed in MC simulations and phantom experiments. Fig. 7Analysis of results of the in vivo experiments carried out on three healthy volunteers. Changes in obtained at different source-detector separations by analysis of three moments of DTOFs: total number of photons , mean time of flight , and variance of the DTOF . 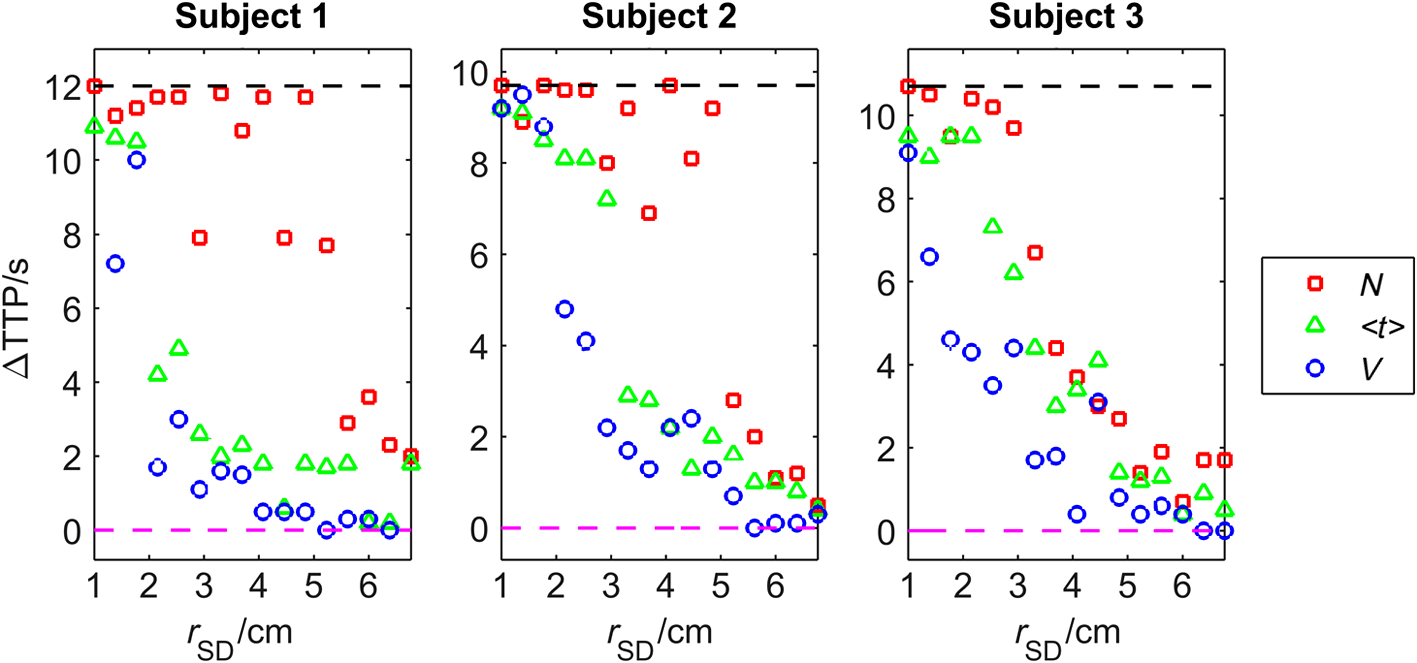 As expected, the uncertainty of estimation is lowest when the signal is analyzed. However, the decrease in the discrepancy observed in depends strongly on the subject measured. Additionally, in order to assess repeatability of the measurement, the analysis of moments of DTOFs obtained in consecutive injections in a single subject was performed (see Fig. 8). It can be observed that the pattern of changes in does not dependent significantly on the ICG concentration in the injected bolus (5, 8, and 10 mg of ICG dissolved in 5 mL of aqua pro injectione). Moreover, it can be observed that the largest delay between signals of moments obtained at different source-detector separations does not depend significantly on the dose of ICG injected. 4.DiscussionTTP is one of the mostly used parameters in perfusion CT and MRI techniques.45–47 The TTP value is related with changes in the cerebral blood flow. It was shown that the typical value of TTP in healthy subjects is .48 Number of studies showed that in patients with impaired cerebral perfusion, TTP is usually longer, and this prolongation may reach even 10 s.49–52 Optical measurements of the delay of the contrast agent bolus passage in patients with acute ischemic stroke were carried out by Steinkellner et al.20,21 It was shown that a small TTP prolongation () in stroke hemisphere can be observed. Analysis of dependence of TTP changes on source-detector separation was carried out by MC simulations. It shows that for the short source-detector separation, the TTP obtained from the signals representing total number of photons reflects the inflow of the ICG to the superficial layers of the studied medium. It can be observed that TTP decreases with source-detector separations and reaches value related to the change modeled in the lower (intracerebral) layer of the medium. However, can be derived from the data obtained at shorter source-detector separations when variance of the DTOF is analyzed. Results of the in vivo experiments carried out on healthy subjects show large differences (up to 12 s) between TTP calculated with the use of different statistical moments. It was noted that this variation in the TTP depends on the subject investigated. This effect can be explained by the influence of the nonhomogeneity of the extracerebral layer of the tissue on the measured DTOFs and effect of increased noise content on higher-order moments of DTOFs.43 Obtained results confirm once more that the higher-order statistical moments of DTOFs are more sensitive to the inflow of the dye to the deeper tissue compartments.32 Large variation of the TTP obtained from signals representing statistical moments of DTOFs suggests that the technical aspects of data acquisition, like (1) source-detector separation, (2) order of the moment of the DTOF analyzed, and (3) number of photons acquired in a single DTOF, may significantly influence discrepancies in the TTP values derived from inflow of the ICG. Results of this study may be useful in optimization of the measurement conditions considering the used measurement technology (available moments of the DTOFs). 5.ConclusionThe MC simulations and corresponding in vivo multidistance measurements show that the time-resolved monitoring during injection of the ICG may be useful in direct assessment of the intracerebral tissue hemodynamic parameters. Results of this study may be useful in optimization of the measurement conditions (source-detector distance) considering used measurement technology (available moments of the DTOFs). For continuous wave measurements (which can be modeled in time-resolved measurements by analysis of the total number of photons detected), source-detector separation at which the TTP related to the inflow of the dye to the brain can be effectively derived, and it should not be . For source-detector separations , the derived from the signals of total number of photons is related mainly to the inflow of the dye to the brain, whereas for shorter distances, high contamination from the extracerebral tissue compartments can be observed. In case of time-resolved technique in which higher-order moments of the DTOFs (mean time of flight, variance) are available, similar results can be obtained at source-detector distance as short as 4 cm. AcknowledgmentsThe studies were partly financed by the National Science Centre of Poland (NCN) in the framework of projects 2011/03/N/ST7/02598 and 2012/05/B/ST7/01162. ReferencesH. Ayaz et al.,
“Continuous monitoring of brain dynamics with functional near infrared spectroscopy as a tool for neuroergonomic research: empirical examples and a technological development,”
Front. Hum. Neurosci., 7 871
(2013). http://dx.doi.org/10.3389/fnhum.2013.00871 Google Scholar
F. Scholkmann et al.,
“A review on continuous wave functional near-infrared spectroscopy and imaging instrumentation and methodology,”
NeuroImage, 85
(Pt 1), 6
–27
(2014). http://dx.doi.org/10.1016/j.neuroimage.2013.05.004 NEIMEF 1053-8119 Google Scholar
M. Wolf et al.,
“Functional frequency-domain near-infrared spectroscopy detects fast neuronal signal in the motor cortex,”
NeuroImage, 17
(4), 1868
–1875
(2002). http://dx.doi.org/10.1006/nimg.2002.1261 NEIMEF 1053-8119 Google Scholar
H. E. D’Arceuil et al.,
“Near-infrared frequency-domain optical spectroscopy and magnetic resonance imaging: a combined approach to studying cerebral maturation in neonatal rabbits,”
J. Biomed. Opt., 10
(1), 011011
(2005). http://dx.doi.org/10.1117/1.1852554 Google Scholar
A. Torricelli et al.,
“Time domain functional NIRS imaging for human brain mapping,”
NeuroImage, 85
(Pt 1), 28
–50
(2014). http://dx.doi.org/10.1016/j.neuroimage.2013.05.106 NEIMEF 1053-8119 Google Scholar
M. Ferrari and V. Quaresima,
“A brief review on the history of human functional near-infrared spectroscopy (fNIRS) development and fields of application,”
NeuroImage, 63
(2), 921
–935
(2012). http://dx.doi.org/10.1016/j.neuroimage.2012.03.049 NEIMEF 1053-8119 Google Scholar
B. R. White and J. P. Culver,
“Quantitative evaluation of high-density diffuse optical tomography: in vivo resolution and mapping performance,”
J. Biomed. Opt., 15
(2), 026006
(2010). http://dx.doi.org/10.1117/1.3368999 Google Scholar
B. W. Zeff et al.,
“Retinotopic mapping of adult human visual cortex with high-density diffuse optical tomography,”
Proc. Natl. Acad. Sci., 104
(29), 12169
–12174
(2007). http://dx.doi.org/10.1073/pnas.0611266104 Google Scholar
A. T. Eggebrecht et al.,
“Mapping distributed brain function and networks with diffuse optical tomography,”
Nat. Photonics, 8
(6), 448
–454
(2014). http://dx.doi.org/10.1038/nphoton.2014.107 Google Scholar
C. Habermehl, C. H. Schmitz and J. Steinbrink,
“Contrast enhanced high-resolution diffuse optical tomography of the human brain using ICG,”
Opt. Express, 19
(19), 18636
–18644
(2011). http://dx.doi.org/10.1364/OE.19.018636 OPEXFF 1094-4087 Google Scholar
N. M. Gregg et al.,
“Brain specificity of diffuse optical imaging: improvements from superficial signal regression and tomography,”
Front. Neuroenergetics, 2 14
(2010). http://dx.doi.org/10.3389/fnene.2010.00014 Google Scholar
T. Funane et al.,
“Near-infrared spectroscopy system with non-contact source and detector for in vivo multi-distance measurement of deep biological tissue,”
Proc. SPIE, 8578 85782W
(2013). http://dx.doi.org/10.1117/12.2002254 Google Scholar
C. Habermehl et al.,
“Depth sensitivity in multi-distance NIRS measurements in humans,”
in Biomedical Optics and 3-D Imaging,
http://dx.doi.org/10.1364/BIOMED.2012.BSu3A.84 Google Scholar
M. Dehaes et al.,
“Assessment of the frequency-domain multi-distance method to evaluate the brain optical properties: Monte Carlo simulations from neonate to adult,”
Biomed. Opt. Express, 2
(3), 552
–567
(2011). http://dx.doi.org/10.1364/BOE.2.000552 Google Scholar
M. A. Franceschini et al.,
“Assessment of infant brain development with frequency-domain near-infrared spectroscopy,”
Pediatr. Res., 61
(5 Pt 1), 546
–551
(2007). http://dx.doi.org/10.1203/pdr.0b013e318045be99 Google Scholar
P. Y. Lin et al.,
“Non-invasive optical measurement of cerebral metabolism and hemodynamics in infants,”
J. Vis. Exp.,
(73), e4379
(2013). http://dx.doi.org/10.3791/4379 Google Scholar
S. A. Kim and S. B. Jun,
“In-vivo optical measurement of neural activity in the brain,”
Exp. Neurobiol., 22
(3), 158
–166
(2013). http://dx.doi.org/10.5607/en.2013.22.3.158 Google Scholar
V. Tsytsarev, C. Bernardelli and K. I. Maslov,
“Living brain optical imaging: technology, methods and applications,”
J. Neurosci. Neuroeng., 1
(2), 180
–192
(2012). http://dx.doi.org/10.1166/jnsne.2012.1020 Google Scholar
A. Liebert et al.,
“Bed-side assessment of cerebral perfusion in stroke patients based on optical monitoring of a dye bolus by time-resolved diffuse reflectance,”
NeuroImage, 24
(2), 426
–435
(2005). http://dx.doi.org/10.1016/j.neuroimage.2004.08.046 NEIMEF 1053-8119 Google Scholar
O. Steinkellner et al.,
“Optical bedside monitoring of cerebral perfusion: technological and methodological advances applied in a study on acute ischemic stroke,”
J. Biomed. Opt., 15
(6), 061708
(2010). http://dx.doi.org/10.1117/1.3505009 Google Scholar
O. Steinkellner et al.,
“Cerebral perfusion in acute stroke monitored by time-domain near-infrared reflectometry,”
Biocybern. Biomed. Eng., 32
(1), 3
–16
(2012). http://dx.doi.org/10.1016/S0208-5216(12)70028-1 Google Scholar
W. M. Kuebler et al.,
“Noninvasive measurement of regional cerebral blood flow by near-infrared spectroscopy and indocyanine green,”
J. Cereb. Blood Flow Metab., 18
(4), 445
–456
(1998). http://dx.doi.org/10.1097/00004647-199804000-00013 Google Scholar
C. Terborg et al.,
“Bedside assessment of cerebral perfusion reductions in patients with acute ischaemic stroke by near-infrared spectroscopy and indocyanine green,”
J. Neurol. Neurosurg. Psychiatry, 75
(1), 38
–42
(2004). Google Scholar
M. A. Kamp et al.,
“Microscope-integrated quantitative analysis of intraoperative indocyanine green fluorescence angiography for blood flow assessment: first experience in 30 patients,”
Neurosurgery, 70
(1 Suppl Operative), 65
–73
(2012). http://dx.doi.org/10.1227/NEU.0b013e31822f7d7c NEQUEB Google Scholar
Y. An, J. Lee and C. Choi,
“Symmetricity analysis of time to peak parameter of indocyanine green dynamics,”
Proc. SPIE, 8572 857202
(2013). http://dx.doi.org/10.1117/12.2002800 Google Scholar
A. Oldag et al.,
“Assessment of cortical hemodynamics by multichannel near-infrared spectroscopy in steno-occlusive disease of the middle cerebral artery,”
Stroke, 43
(11), 2980
–2985
(2012). http://dx.doi.org/10.1161/STROKEAHA.112.656710 SJCCA7 0039-2499 Google Scholar
C. Terborg et al.,
“Noninvasive assessment of cerebral perfusion and oxygenation in acute ischemic stroke by near-infrared spectroscopy,”
Eur. Neurol., 62
(6), 338
–343
(2009). http://dx.doi.org/10.1159/000239794 EUNEAP 0014-3022 Google Scholar
J. T. Elliott et al.,
“Quantifying cerebral blood flow in an adult pig ischemia model by a depth-resolved dynamic contrast-enhanced optical method,”
NeuroImage, 94
(0), 303
–311
(2014). http://dx.doi.org/10.1016/j.neuroimage.2014.03.023 NEIMEF 1053-8119 Google Scholar
R. Arora et al.,
“Preservation of the metabolic rate of oxygen in preterm infants during indomethacin therapy for closure of the ductus arteriosus,”
Pediatr. Res., 73
(6), 713
–718
(2013). http://dx.doi.org/10.1038/pr.2013.53 Google Scholar
W. Weigl et al.,
“Assessment of cerebral perfusion in post-traumatic brain injury patients with the use of ICG-bolus tracking method,”
NeuroImage, 85
(Pt 1), 555
–565
(2014). http://dx.doi.org/10.1016/j.neuroimage.2013.06.065 NEIMEF 1053-8119 Google Scholar
A. Liebert et al.,
“Time-resolved multidistance near-infrared spectroscopy of the adult head: intracerebral and extracerebral absorption changes from moments of distribution of times of flight of photons,”
Appl. Opt., 43
(15), 3037
–3047
(2004). http://dx.doi.org/10.1364/AO.43.003037 APOPAI 0003-6935 Google Scholar
J. T. Elliott et al.,
“Variance of time-of-flight distribution is sensitive to cerebral blood flow as demonstrated by ICG bolus-tracking measurements in adult pigs,”
Biomed. Opt. Express, 4
(2), 206
–218
(2013). http://dx.doi.org/10.1364/BOE.4.000206 Google Scholar
A. Liebert et al.,
“Assessment of inflow and washout of indocyanine green in the adult human brain by monitoring of diffuse reflectance at large source-detector separation,”
J. Biomed. Opt., 16
(4), 046011
(2011). http://dx.doi.org/10.1117/1.3574018 Google Scholar
A. Liebert, H. Wabnitz and C. Elster,
“Determination of absorption changes from moments of distributions of times of flight of photons: optimization of measurement conditions for a two-layered tissue model,”
J. Biomed. Opt., 17
(5), 057005
(2012). http://dx.doi.org/10.1117/1.JBO.17.5.057005 Google Scholar
A. Liebert et al.,
“Monte Carlo algorithm for efficient simulation of time-resolved fluorescence in layered turbid media,”
Opt. Express, 16
(17), 13188
–13202
(2008). http://dx.doi.org/10.1364/OE.16.013188 OPEXFF 1094-4087 Google Scholar
D. Milej et al.,
“Time-resolved detection of fluorescent light during inflow of ICG to the brain—a methodological study,”
Phys. Med. Biol., 57
(20), 6725
–6742
(2012). http://dx.doi.org/10.1088/0031-9155/57/20/6725 Google Scholar
D. Milej et al.,
“A Monte Carlo study of fluorescence generation probability in a two-layered tissue model,”
Phys. Med. Biol., 59
(6), 1407
–1424
(2014). http://dx.doi.org/10.1088/0031-9155/59/6/1407 Google Scholar
T. S. Leung et al.,
“Theoretical investigation of measuring cerebral blood flow in the adult human head using bolus indocyanine green injection and near-infrared spectroscopy,”
Appl. Opt., 46
(10), 1604
(2007). http://dx.doi.org/10.1364/AO.46.001604 APOPAI 0003-6935 Google Scholar
D. Milej et al.,
“Time-resolved multi-channel optical system for assessment of brain oxygenation and perfusion by monitoring of diffuse reflectance and fluorescence,”
Opto-Electron. Rev., 22
(1), 55
–67
(2014). http://dx.doi.org/10.2478/s11772-014-0178-y OELREM 1230-3402 Google Scholar
M. Kacprzak et al.,
“Time-resolved optical imager for assessment of cerebral oxygenation,”
J. Biomed. Opt., 12
(3), 034019
(2007). http://dx.doi.org/10.1117/1.2743964 Google Scholar
H. Wabnitz et al.,
“Performance assessment of time-domain optical brain imagers, part 1: basic instrumental performance protocol,”
J. Biomed. Opt., 19
(8), 086010
(2014). http://dx.doi.org/10.1117/1.JBO.19.8.086010 Google Scholar
A. Farina et al.,
“In-vivo multilaboratory investigation of the optical properties of the human head,”
Biomed. Opt. Express, 6
(7), 2609
–2623
(2015). http://dx.doi.org/10.1364/BOE.6.002609 Google Scholar
A. Liebert et al.,
“Evaluation of optical properties of highly scattering media by moments of distributions of times of flight of photons,”
Appl. Opt., 42
(28), 5785
–5792
(2003). http://dx.doi.org/10.1364/AO.42.005785 APOPAI 0003-6935 Google Scholar
D. Milej et al.,
“Advantages of fluorescence over diffuse reflectance measurements tested in phantom experiments with dynamic inflow of ICG,”
Opto-Electron. Rev., 18
(2), 208
–213
(2010). http://dx.doi.org/10.2478/s11772-010-0013-z OELREM 1230-3402 Google Scholar
J. R. Reichenbach et al.,
“Acute stroke evaluated by time-to-peak mapping during initial and early follow-up perfusion CT studies,”
Am. J. Neuroradiol., 20
(10), 1842
–1850
(1999). Google Scholar
A. Kheradmand, M. Fisher and D. Paydarfar,
“Ischemic stroke in evolution: predictive value of perfusion computed tomography,”
J. Stroke Cerebrovasc. Dis., 23
(5), 836
–843
(2014). http://dx.doi.org/10.1016/j.jstrokecerebrovasdis.2013.07.014 Google Scholar
B. C. Campbell et al.,
“Comparison of computed tomography perfusion and magnetic resonance imaging perfusion-diffusion mismatch in ischemic stroke,”
Stroke, 43
(10), 2648
–2653
(2012). http://dx.doi.org/10.1161/STROKEAHA.112.660548 SJCCA7 0039-2499 Google Scholar
B. F. Tomandl et al.,
“Comprehensive imaging of ischemic stroke with multisection CT,”
RadioGraphics, 23
(3), 565
–592
(2003). http://dx.doi.org/10.1148/rg.233025036 Google Scholar
K. Kajimoto et al.,
“Cerebral hemodynamic evaluation using perfusion-weighted magnetic resonance imaging: comparison with positron emission tomography values in chronic occlusive carotid disease,”
Stroke, 34
(7), 1662
–1666
(2003). http://dx.doi.org/10.1161/01.STR.0000076014.60026.45 SJCCA7 0039-2499 Google Scholar
J. M. Olivot et al.,
“Perfusion MRI (Tmax and MTT) correlation with xenon CT cerebral blood flow in stroke patients,”
Neurology, 72
(13), 1140
–1145
(2009). http://dx.doi.org/10.1212/01.wnl.0000345372.49233.e3 NEURAI 0028-3878 Google Scholar
J. Zhang et al.,
“Whole-brain CT perfusion and CT angiography assessment of moyamoya disease before and after surgical revascularization: preliminary study with 256-slice CT,”
PLoS One, 8
(2), e57595
(2013). http://dx.doi.org/10.1371/journal.pone.0057595 POLNCL 1932-6203 Google Scholar
J. W. Dankbaar et al.,
“Diagnostic threshold values of cerebral perfusion measured with computed tomography for delayed cerebral ischemia after aneurysmal subarachnoid hemorrhage,”
Stroke, 41
(9), 1927
–1932
(2010). http://dx.doi.org/10.1161/STROKEAHA.109.574392 SJCCA7 0039-2499 Google Scholar
BiographyDaniel Milej is a postdoctoral fellow at Western University in London, Canada, and a researcher at Lawson Health Research Institute in London, Canada. He received his MSc degree in optoelectronics from Military University of Technology, Warsaw, in 2008 and his PhD in biomedical engineering optics from the Nalecz Institute of Biocybernetics and Biomedical Engineering, Polish Academy of Sciences in 2014. He is the author and coauthor of 16 journal papers and two book chapters. His current research areas include time-domain optical brain imaging, functional near-infrared spectroscopy, fluorescence measurements, development of instrumentation, and clinical applications. |


