|
|
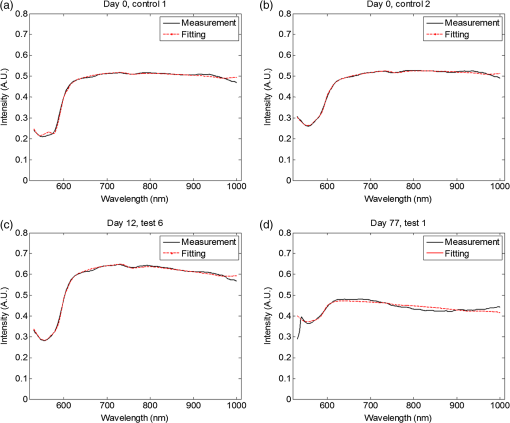
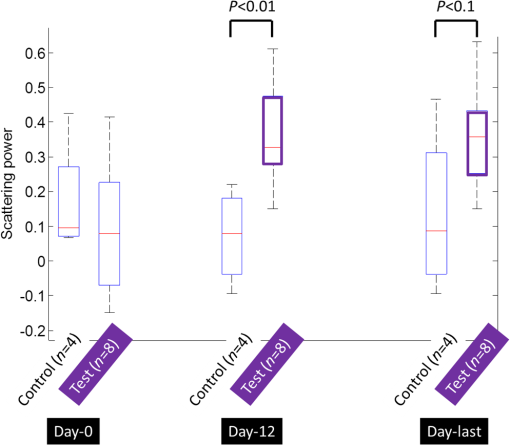
1.IntroductionLiver transplant is the second most common transplant in the United States, with transplants performed each year and an annual active waiting list of more than 12,000 patients.1 With the increase of the obese population in the United States, the donor organ shortage for transplantable livers can be expected to worsen. Discrepancies between the number of suitable liver donors and the increased demand for transplantation compels the need to expand liver donor acceptance criteria, including consideration of organs of “marginal” quality, such as fatty livers from living or deceased donors.2 Steatosis of the donor liver is a main risk factor for initial dysfunction or nonfunction of the graft after orthotopic liver transplant, because fatty livers are particularly susceptible to ischemia reperfusion injury.3 An accurate clinical assessment of hepatic steatosis prior to organ procurement is thus crucial for successful outcomes after liver transplantation.4 Histological evaluation of biopsied liver tissue using staining specific to lipid (i.e., Oil Red O staining) is the “gold standard” for the assessment of lipid infiltration in the liver, for which a semiquantitative grading metric is as follows:5 insignificant or no fatty change (), mild (5 to ), moderate (30 to ), or severe (). Logistically, histopathological analysis for assessment of fatty change takes precious time and has interobserver variability, and a pathologist is not always available at the time of procurement. As a result, many centers rely mainly upon the procurement surgeon for gross assessment of steatosis and organ quality.4,6 However, there is a poor association between macroscopic liver appearance and the presence of histological steatosis,6 and precise evaluation of fat accumulation by visual inspection and palpation during organ procurement remains challenging, even in experienced surgical hands.4 Conventional imaging technologies have limitations in quantification of hepatic steatosis.7 Ultrasound (US) diagnosis of fatty infiltration in liver based on changes of echogenicity is not readily quantitive, varies among observers, and degrades in sensitivity when applied to low levels of steatosis and obese donors. Other imaging modalities, such as computed tomography, magnetic resonance imaging (MRI), and magnetic resonance spectroscopy (MRS), may be relatively time-consuming and logistically difficult during organ collection.8 These limitations in the assessment have necessitated the search for tools capable of accurate and preferably real-time quantification of fatty content in liver tissue.8,9 Optical spectroscopic methods may be a useful alternative toward real-time and accurate assessment of fatty infiltration of liver tissue. Time-resolved near-infrared spectroscopy by Kitai et al.10 on excised livers of rats with different levels of fatty changes revealed that fatty liver presented a lower absorption coefficient () and higher reduced scattering coefficient () when compared to normal liver, and there was a positive correlation between and the lipid deposition. Lipid is a strong scatterer of light in the visible to near-infrared spectrum; therefore, the increased fatty infiltration of hepatic tissue was expected to increase the tissue spectral reflectance, as lipid would gradually dominate the scattering. Surface measurements on human liver specimens by McLaughlin et al. using diffuse reflectance spectroscopy (DRS) over a spectrum between 550 and 1040 nm with a 2-mm applicator probe containing three transmission fibers and one collection fiber11 also showed a correlation coefficient of 0.85 of the total diffuse reflectance intensity with the histologically identified lipid mass fraction of liver tissue. Recently, Evers et al.8 used a 15-gauge optical needle probe consisting of one transmitting fiber and two collecting fibers inserted into the liver to perform DRS in vivo in 17 patients during liver surgery and ex vivo on liver resection specimens from 41 patients. Evers’s system used one spectrometer in the visible/near-infrared range between 400 and 1100 nm and a second spectrometer sensitive to near-infrared wavelength from 800 nm to 1700 nm that covered the prominent absorption peak of lipid at 1210 nm. The sensitivity to the lipid absorption peak at 1210 nm was a major advantage for Evers’s study in demonstrating a correlation of 0.925 between in vivo and ex vivo DRS analyses of steatosis from the same liver tissue and a correlation of 0.854 between the ex vivo DRS analysis and histology. These studies have demonstrated that reflectance spectroscopy via either surface probing or interstitial measurement has the potential to enhance liver steatosis quantification in liver surgery.8 It should be noted that a spectrometer sensitive to the lipid absorption signature at 1210 nm as was used by Evers et al.8 is quite expensive when compared to other equipment typical to visible/near-infrared spectroscopy. The more widely accessible spectrometers (such as the first spectrometer used by Evers et al.8 and those used in Refs. 9 and 11) that typically operate within the visible/near-infrared spectrum up to 1100 nm have much less sensitivity to lipid absorption, making the spectral reflectance intensity a key indicator to rely upon for inferring lipid dominance in the scattering of hepatic tissue.11 While evaluating the level of lipid accumulation is important, a more challenging yet potentially more relevant aspect of hepatic steatosis to assess for a transplant regime is whether the steatosis is of the microvesicular or macrovesicular subtype. Microvesicular steatosis is the condition of deposition of many lipid droplets that are much smaller than the nucleus of the host hepatocyte, whereas macrovesicular steatosis refers to the formation of a single large lipid droplet occupying nearly the entire hepatocyte, causing distortion of the subcellular morphology and subsequently loss of the hepatocyte’s functionality. Between the two subtypes, it is macrovesicular steatosis that poses a risk for graft success and functionality after transplantation.12 Histology of biopsied specimens is currently the only method to assess the subtype of steatosis, as none of the standard imaging modalities, including US, CT, MRI, and MRS, has the physical sensitivity to differentiate subtypes of steatosis; whereas reflectance spectroscopy using the lipid absorption signatures such as the one at 1210 nm in Ref. 8 could render reliable estimation of the lipid fraction, the absorption features will be insensitive to the subtypes of steatosis. The scattering properties, on the other hand, may become the vehicle for differentiating the subtypes of steatosis in addition to quantitating the level of steatosis, as was hypothesized by Evers et al.,8 because the wavelength dependence of scattering (i.e., the shape of the spectral reflectance in the absence of absorption) is sensitive to the sizes of scatterers. As the lipid droplets constituting microvesicular and macrovesicular subtypes of steatosis could differ significantly in size, analysis of the wavelength dependence of the scattering might allow finding some features of the measurable spectral reflectance that may be used as the markers for differentiating microvesicular-dominant steatosis from macrovesicular-dominant steatosis. Additionally, it would be beneficial to most users of visible/near-infrared spectroscopy to examine if the change of the steatosis level in the same subject will reveal any spectral reflectance features other than the change in spectral reflectance intensity when the spectral response for tissue probing lacks the sensitivity at 1210 nm to the lipid absorption as in the study by Evers et al.8 One condition common to previous optical spectroscopy studies, including that of Evers et al.,8 was that the evaluations were performed on exposed or resected livers or hepatic tissue specimens, so what was revealed were the differences among different liver tissues at the time of measurement, but not of the same liver at different times in steatosis development. Because steatosis development in liver is reported to undergo different stages with differences in not only the amount but also the size of lipid droplets,13 evaluating temporal development of steatosis could enhance the understanding of the spectral characteristics of lipid droplets of different sizes and different levels of fatty infiltration. Evaluation over the course of steatosis development entails an optical spectroscopy technique that can be repeatedly applied to the same subject with minimal invasiveness. Percutaneous evaluation using a small fiber-probe that can pass through a small-gauge hypodermic needle could be a viable approach. Percutaneous assessment of tissue-scattering characteristics using a polyamide fiber-probe has been applied by our group to investigate the potential of quantifying mineral degeneration of intervertebral discs to improve the outcomes of laser-based treatment.14,15 Reflectance spectroscopy using a single-fiber probe or a fiber-probe of small profile allowing insertion through a needle or an endoscopic port has demonstrated clinical potential for many applications, including staging of lung cancer through examination of mediastinal lymph nodes,16 brain tumor detection,17 intraoperative differentiation of healthy and demyelinated peripheral nerves,18 prediction of cervical squamous intraepithelial lesions,19 etc. Recently, van Leeuwen-van Zaane et al.20 applied reflectance spectroscopy using a single probe with cocentric fibers of multiple sizes for in vivo quantification of the scattering properties of tissue, including exposed liver, by contact measurement. The present study used a single fiber-probe to percutaneously measure the reflectance spectrum of the liver tissue over the duration of fatty liver development. The assessment in this present study of lipid-induced light scattering within the liver at different levels of fatty infiltration could provide additional insights regarding which feature of the reflectance spectroscopy at limited sensitivity to lipid absorption may be useful in discriminating microvesicular from macrovesicular steatosis. 2.Materials and Methods2.1.Diet and Animal ProtocolThe animal protocol of this study was approved by the Institutional Animal Care and Use Committee of Oklahoma State University (protocol # VM-11-20). Twelve male Sprague–Dawley rats weighing 250 to 280 grams (Harlan Labs, Inc. Madison, Wisconsin) were housed individually in the university’s Lab Animal Resources facility and allowed food (control or test diet) and water ad libitum. All rats were acclimated to laboratory conditions for a minimum of 7 days and fed a standard rodent chow ad libitum (Laboratory Rodent Diet 5001, LabDiet, St. Louis, Missouri). The 12 rats were then randomly grouped to eight test rats and four control rats. The test rats were fed a methionine-choline-deficient (MCD) diet (Harlan Telkad—TD.90262) ad libitum, and the control rats were fed an amino acid control diet ad libitum (Harlan Telkad—TD.130936). Percutaneous single-fiber spectroscopy (SfS) measurements of the rat livers were performed on day 0, day 12, day 28, day 49, and day 77 using transabdominal US guidance (more details of the experimental procedures are given in the following section in association with Fig. 1). The time intervals of the days for evaluation were randomized. On each day of evaluation (12, 28, 49, and 77 days) after initiation of the MCD diet, two test rats and one control rat were euthanized after evaluating the liver by US and SfS measurements. The identification of each animal was blinded to both the US specialist and the SfS operator. Necropsies of the three euthanized rats were performed and the hepatic tissue samples were harvested for histopathology. By day 77, at the completion of the study, when all animals had undergone in vivo measurements and been euthanized and necropsied, the identifications of all animals were revealed for the SfS operator to compare the postprocessed spectroscopy results as well as the ultrasonography readings with the histopathology observations. Fig. 1The configuration for percutaneous single-fiber spectroscopy (SfS) of rat liver. Light source and spectrometer were coupled to a bifurcated fiber bundle (shown at top left) to which a single-fiber probe was connected. The single fiber probed into liver through a 22- (or 20-) gauge needle (schematic of angle polished fiber in needle shown at left) by ultrasound (US) guidance (see the photograph in the middle panel). From the pneumatic pillow (covered by the rat and the small air tubing shadowed by the US cable), respiration of the rat was detected by a gating module for triggering the SfS data acquisition (the triggering sequence is shown at the top right). 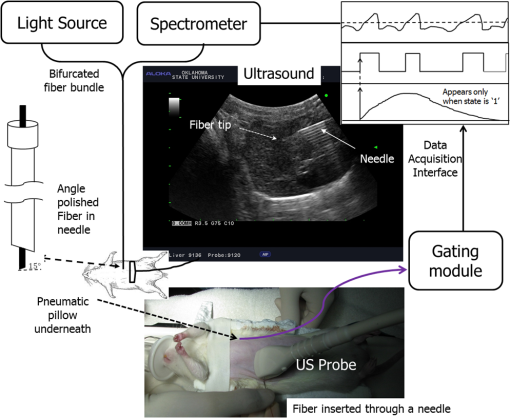 The experimental procedures for percutaneous SfS of the rat liver are illustrated in Fig. 1. At the time of examination, the rat was anesthetized using intraperitoneal administration ( g b.w.) of a “cocktail” of xylazine (1.5 ml of )/ketamine (10 ml of ) and a pre-emptive subcutaneous dose of g b.w. of buprenorphine (buprenorphine diluted 1:5 with sterile saline). This anesthetic regime was supplemented with oxygen and isofluorane as necessary via a face mask. The rat was placed in a supine position on an in-house–prepared U-shaped foam bed. A pneumatic pillow sensor (SA Instruments, Stony Brook, New York) was inserted under the caudal and left-lateral aspect of the thoracic area of the rat for respiration gating for SfS data acquisition. The ventral abdomen extending cranial from the brim of the pelvis to the xiphoid was clipped of hair and surgically prepped with an antiseptic solution (chlorhexidine scrub—Vetco, St. Joseph, Missouri). Using US guidance (Aloka Prosound Alpha 6 console and 9120 transducer at 8 MHz, sectional field-of-view of radius 3.5 cm, gain setting of 75, and contrast setting of 10), a sterile 22- or 20-gauge (depending on availability) 1.5-in. myelographic needle was introduced through the skin, abdominal musculature, and peritoneum into the liver. The liver parenchyma in which the needle was placed was absent of apparent vasculature in the vicinity of the needle tip as evaluated by grayscale US and cross-checked by Doppler US when needed. The US probe was held in position using an adaptable tripod with a cable holder to maintain continuous stabilized visualization of the needle within the intraparenchymal field during SfS measurements. After retracting the stylet of the needle, a sterile single-fiber probe (low-OH quartz fiber, H320R, New Star Lasers, Roseville, California)14,15 was inserted through the needle. Placement of the fiber-probe in the needle was monitored by US until the fiber tip extended beyond the beveled needle tip a few millimeters, as indicated by the arrows in Fig. 1. Five repeated measurements, each with a 100-ms time of integration of the signal after it was triggered by the respiration gating output, were acquired from each subject. In the offline processing, the five spectroscopy measurements were averaged for subsequent scattering spectral analyses, to be detailed in the subsequent section. After the percutaneous SfS measurements, the rats to continue in the study were recovered and returned to their cages for observation, and the anesthetized rats to be euthanized underwent a ventral midline incision extending cranially through the xiphoid and diaphragmatic reflection into the thoracic cavity using a #10 scalpel blade and metzenbaum surgical scissors. A 20-gauge needle with a 3-cc syringe was then used to collect of whole blood by direct intracardiac puncture for laboratory analysis. Immediately following blood collection, direct intracardiac injection of 1 cc (390 mg) of pentobarbital sodium (Beuthansia D, Schering Plough, Union, New Jersey) was administered for euthanasia. Necropsy was performed immediately, followed by fixation of the hepatic tissue specimens in 10% neutral buffered formalin. The liver specimens were trimmed, weighed, and keyed for identification. Histologic evaluation of the hematoxylin/eosin (H&E) stained and Oil Red O stained (performed off frozen sections for lipid determination) tissues was made by a pathologist blinded to the groups, who ranked the sections based upon the amount of lipid accumulation. After ranking as reported in the Results section, the animal identifications were correlated with the degree of lipid accumulation. 2.2.Percutaneous Single-Fiber Spectroscopy MeasurementA deuterium tungsten halogen light source (model DH2000-FHS, Ocean Optics, Dunedin, FL) was coupled to one branch of a diameter bifurcated fiber bundle (BIF 200-VIS/NIR, Ocean Optics, Inc.). Only the halogen source was used after evaluating the spectral spikes of the deuterium source and the overall spectral response of the system. The other end of the bifurcated fiber bundle was connected to a spectrometer (USB4000-VIS-NIR, Ocean Optics) with a custom slit and sensor configuration. The combined end of the bifurcated fiber bundle was connected to the H320R diameter fiber for light delivery and collection. The tip of the fiber probe was polished in-house to an angle of to reduce specular back reflection. When the fiber was placed in the needle and the position in the liver parenchyma was confirmed by US, the spectroscopy measurements were taken after being triggered by a respiration gating signal. The respiration gating signal was originated from a pneumatic pillow (the long dashed arrow in Fig. 1 points to the position of the pillow underneath the rat), computer interfaced by a small animal monitoring and gating module (Model 1025T, SA Instruments, Inc., Stony Brook, New York), and signal conditioned in a graphical user interface (GUI) to produce a clean and stable trigger signal with adjustable thresholds for starting the spectroscopy data acquisition. The GUI for conditioning of the respiration gating signal and the subsequent spectroscopy measurements was programmed in LabVIEW (National Instruments, Austin, Texas). The GUI also output different pitches of sounds according to the condition of the gating input and the intensity level of the SfS signal, providing an audio cue to the operational sequences. 2.3.Single-Fiber Spectroscopy AnalysisDue to the signal cutoff at shorter wavelengths and limits of the system sensitivity at longer wavelengths, the SfS system used in this study had a useful spectral range of only 540 to 1000 nm. After normalization to remove the effect of the source spectral variation, the postprocessing performed spectral analysis based on reported models of single-fiber–based spectroscopy. By fitting to the amount of chromophores, including oxygenated and deoxygenated hemoglobin, water, and lipid compositions, the scattering spectral contribution to the single-fiber measurement was isolated for evaluation of locally sampled tissue scattering in the absence of absorption contamination. The methods of analyses are detailed in the following. We denote as the raw SfS measurements from the tissue that contains the source spectral variation. Normalization of according to the following formula:14,15 where and are, respectively, the baseline SfS signals from air and within water, gives rise to the following normalized form of14 that is free of the source spectral variation, where and represents the specular reflection at the interface between the fiber and the respective medium “.” In Eq. (2), represents the contribution of tissue scattering to the SfS signal in the absence of absorption and represents the average pathlength of the photons detected by the fiber-probe [for a single-fiber probe of in liver tissue, the spectral-dependent photon pathlength was to 1 mm as estimated by the following Eq. (4), indicating a sampling volume of a few hundreds of micrometers in cross-section]. Recent Monte Carlo simulations with experimental validations21–23 have suggested the following semiempirical representations of and as applying to single-fiber probe of a diameter of : where is determined by the acceptance angle of the fiber and the refractive index difference between the medium and the fiber, and to are constants that may depend upon the scattering phase function of the medium. For liver tissue, the following set of parameters was suggested by previous multidiameter SfS studies:24,25 , , , , , , where is a parameter describing the effect of large-angle scattering events on the reflectance signal collected by single-fiber probe. Four chromophores, including oxygenated hemoglobin, deoxygenated hemoglobin, water, and lipid, are modeled into the absorption coefficient as where and are, respectively, the absorption coefficients of oxyhemoglobin and deoxyhemoglobin (values exported from the spectral panel of VirtualPhotonics26); is the hemoglobin oxygen saturation; is the total hemoglobin concentration (in ); and are, respectively, the absorption coefficients of lipid and water at 1% volume fraction (values also exported from the spectral panel of VirtualPhotonics26); is the fraction of lipid in the water–lipid body; and is the total fraction of water and lipid in tissue, which was assumed to have a constant value of 93% following studies specific to liver.27 The pigment packaging effect20,28 was also implemented in the model but was found insensitive on the results, as the Soret band of hemoglobin was distant from the lower cutoff of the spectral response of the system. The spectral dependence of in Eq. (3) is represented by the widely adopted power-law expression of , where is the scattering amplitude and is the scattering power; the substitution of Eq. (3) into Eq. (2) leads to a new constant of , and becomes an effective index of scattering intensity in the absence of absorption. Integrating Eqs. (3)–(5) to Eq. (2) and substituting available numerical values leads to the following form of where all symbols containing are known through measurement and literature databases. A nonlinear least-squares fitting of the measurement data with Eq. (6) then gives the estimation of the following parameters of interest: hemoglobin oxygen saturation, total hemoglobin concentration, lipid fraction in the water–lipid body, scattering power, and effective scattering intensity. Four examples of the goodness-of-fit of the spectral fitting involved in the analyses are presented in Fig. 2, where the one at the bottom right exemplifies an overall less desirable fit. The strong hemoglobin absorption signature at the sub–600-nm band and the relatively weaker absorption feature at 760 nm were fitted accurately for the majority of the spectral profiles. However, the fitting over 900 to 1000 nm was generally poor due to the limited spectral response of the system and the overlapping of absorption peaks of lipid and water within that range.2.4.Statistical AnalysisIndependent two sample -test applying to different sample sizes was used to determine whether there was a difference of a specific parameter between the test group () and the control group () at the same time point. Paired -test applying to the same sample size was used to analyze whether a specific parameter of the group ( for test rats or for control rats) changed over time. The following statistical inferences were used: a value of indicates a strong evidence of a difference, a value of weak evidence of a difference, a value of evidence of a difference, and a value of little or no evidence of a difference.28 3.Results3.1.Histopathology of Fatty Infiltration in the Livers of Euthanized RatsThe histological findings of fatty infiltration of livers of the rats were available for each set of three rats, two from the test group fed MCD diet and one from the control group, which were euthanized respectively on days 12, 28, 49, and 77 after the initiation of the diets. Among the three rats euthanized on day 12, both of the two test rats had mild lipid accumulation, and the control rat had insignificant lipid accumulation in the liver as revealed by both H&E staining and Oil Red O staining. Among the three rats euthanized on day 28, the two test rats had, respectively, moderate and severe lipid accumulations, and the control rat had insignificant lipid accumulation. Among the three rats euthanized on day 49, the two test rats had, respectively, severe and mild (upper in the mild range) lipid accumulations, and the control rat had insignificant lipid accumulation. Among the three rats euthanized on day 77, the two test rats had, respectively, moderate and mild lipid accumulations. The control rat euthanized on day 77 had unremarkable lipid accumulation seen by H&E staining but slight lipid accumulation by Oil Red O staining; however, lipid accumulation was less than found in the test rat euthanized on the same day. 3.2.Representative Percutaneous Single-Fiber-Spectroscopy Features of Different Levels of Lipid Accumulation when Compared to Histopathology and UltrasonographyThe representative results including US, percutaneous SfS, and histology of the livers identified to have respectively insignificant, mild, moderate, and severe lipid accumulations are presented in Fig. 3. The top row corresponds to the baseline US images of the rat on day 0. The second row displays the US images taken on the day of euthanasia. The third row is the plot of the percutaneous SfS measurement for the test rat with respect to that of the control rat euthanized on the same day. Shown in the fourth row are the H&E stained images, and the bottom row are the Oil Red O stained images. Because the H&E staining and Oil Red O staining were performed on two tissue specimens of the same liver, the two images shown of the same rat were not expected to match in the morphology. Fig. 3Column (1): The one marked as “insignificant” was from a control rat sacrificed on day 12. Column (2): The one marked as “mild” was from a test rat sacrificed on day 12 (the same set of euthanasia including the control rat shown here as “insignificant”). Column (3): The one marked as “moderate” was from a test rat sacrificed on day 28. Column (4): The one marked as “severe” was from a test rat sacrificed on day 49. . 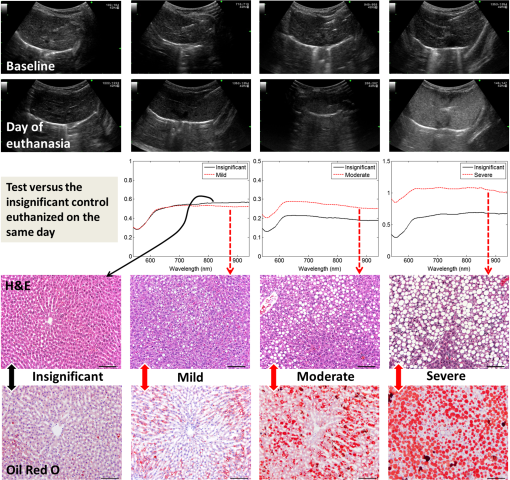 The first column, with a mark of “insignificant,” was from a control rat sacrificed on day 12. The second column, with a mark of “mild,” was from a test rat sacrificed on day 12 (the control rat shown in the first column was euthanized on the same day as this test rat, so the spectral profiles of these two rats were plotted together). The third column, with a mark of “moderate,” was from a test rat euthanized on day 28. The fourth column, with a mark of “severe,” was from a test rat euthanized on day 49. For the control rat in the first column, which was euthanized on day 12, its sonographic features appeared normal on day 12, as on day 0. For the test rat in the second column that had a histologically mild lipid accumulation on day 12, its sonographic features on day 12 showed unremarkable changes over the normal-appearing ones on day 0. A comparison of the percutaneous SfS results of this test rat and the control rat (the one in the first column) indicates that the two spectral profiles were different only at wavelengths longer than , with the spectral intensity of the test rat decreasing with respect to that of the control rat as the wavelength increased. For the test rat in the third column, which had a histologically moderate lipid accumulation on day 28, its sonographic features on day 28 did not unambiguously reveal hyperechoic and diffused change that would support a fatty liver diagnosis compared to day 0. The percutaneous SfS results of this test rat and its corresponding control rat were similar in terms of the overall spectral variation, with a clear difference in the spectral intensity, as that of the test rat was higher than that of the control rat. For the test rat in the fourth column, which had a histologically severe lipid accumulation on day 45, the sonographic features of this rat presented strongly diffused hyperechoic appearances of the liver that were clearly indicative of fatty infiltration. The percutaneous SfS results of this test rat and its corresponding control rat of histologically lean liver were similar in terms of the global spectral variation, with a clear difference in the spectral intensity, as that of the test rat was substantially higher than that of the control rat, and the spectral intensity of the test rat slightly decreased when compared to that of the control rat as the wavelength increased. 3.3.Percutaneous Single-Fiber Spectral Measurements of the Livers of the 12 Rats In Vivo on Day 12 and Day of Euthanasia as Compared to That on Day 0On day 12, the livers of all 12 rats were ultrasonically unremarkable when compared to their respective normal-appearing baselines on day 0. Among these 12 rats, only the three rats euthanized that day were of known histological conditions of liver (two test livers with mild lipid accumulation and one control lean liver). The percutaneous SfS profiles averaged, respectively, for the four control rats and eight test rats on day 12 in comparison to those on day 0 are presented in Fig. 4. The spectral reflectance profile of the control group is plotted as the solid black line with the error bar indicating the standard deviation, and the test group as a dashed red line with similar error-bar metrics. The spectral profile averaged for the test rats on day 0 was generally very close to but slightly higher than that for the control rats of the same day over the entire spectral range. The spectral profile of the test rats on day 0 was observed with slightly smaller hemoglobin absorption, as indicated by the relatively shallower dip (with respect to the overall spectral intensity) at around 550 nm when compared to its control counterpart. This relatively smaller hemoglobin absorption was in concordance with the slightly higher spectral intensity of the test rats over that of the control rats on day 0. In comparison, the spectral profile of the test rats on day 12 was noticeably different from that of the control rat on day 12. The spectral profile of the control rats on day 12 was similar to its baseline on day 0 in the global spectral patterns, including the relative level of hemoglobin absorption at around 550 nm and the approximately horizontally running profile elsewhere. The spectral profile of the test rats on day 12, despite the level of hemoglobin absorption dip around 550 nm being nearly identical to that of its own baseline on day 0 and similar to that of the control rats on the same day 12, was registered elsewhere with a pattern of reduced spectral intensity at longer wavelengths when compared to either its control counterparts on the same day 12 or its own baseline on day 0. This change of the spectral profile as observed from the test rats on day 12 indicated a change of the tissue scattering spectrum. Fig. 4(a) The spectral reflectance of livers of all 12 rats from the baseline to (b) day 12. The spectral profile averaged for the four rats in the control group is plotted as a solid black line and that of the eight rats in the test group in a dashed red line. 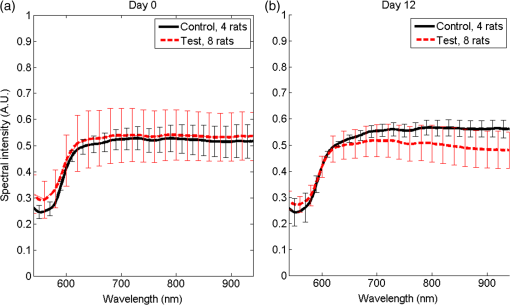 The single-fiber spectral profiles of the livers of all 12 rats euthanized, respectively, on four different days (12, 28, 49, and 77) are presented in Fig. 5, according to the set of day of euthanasia. The histopathological grading of the hepatic lipid accumulation of these euthanized rats is also marked according to the scales described in the inset. The spectral profile of the control rat is plotted as a solid black line, and the measurements of the two rats fed the MCD diet are plotted, respectively, as the dotted and dashed lines. The measurements of each set of three rats on day 0 are also presented. The spectral profiles of the two MCD-fed rats euthanized on day 12 (mild and mild) did not present an unambiguous difference with respect to that of the control rat (lean). The profiles of these three rats on day 0 or day 12 are part of the profiles for day 0 or day 12 presented in Fig. 4. The spectral profiles of the two MCD-fed rats euthanized on day 28 (moderate and severe) were observed with higher spectral reflectance than the control rat (lean). The spectral profiles of the two MCD-fed rats euthanized on day 49 (severe and mild) were observed with substantially higher spectral reflectance than the control rat (lean). However, the spectral profiles of the two MCD-fed rats euthanized on day 77 (moderate and mild) were close to that of the control rat, which had slight lipid accumulation on Oil Red O staining. Fig. 5Comparison of the single-fiber spectral reflectance of the 12 rats from the baseline (left panel) to the respective days of euthanasia. The measurement from the control rat is plotted as a solid black line. The measurements from the two rats fed MCD diet are plotted as, respectively, dotted and dashed lines. The first row corresponds to the three rats euthanized on day 12. The second row corresponds to the three rats euthanized on day 28. The third row corresponds to the three rats euthanized on day 49. The fourth row corresponds to the three rats euthanized on day 77. The histological results of the lipid accumulation in liver are marked with the small circle or rectangle. The orange circle represents histological confirmation of lipid accumulation, with one circle representing mild accumulation, two circles moderate, and three circles severe. The rectangle represents control lean liver, but the one with a superscript * for day 77 represents the histological finding of slight accumulation of lipid in the control liver when evaluated by Oil Red O staining. 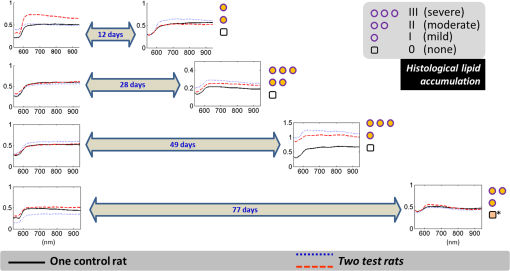 3.4.Spectral Analysis: The Change of Scattering Power as an Indicator of the Fatty InfiltrationThe total hemoglobin concentrations of the four control rats and the eight test rats on day 0 were and , respectively (). The total hemoglobin concentrations of the four control rats and the eight test rats on day 12 were and , respectively (). The total hemoglobin concentrations of the four control rats and eight test rats on the day of euthanasia were and , respectively (). The changes (reduction) of the total hemoglobin of the eight test rats and four control rats on the day of euthanasia in comparison to their respective baselines on day 0 was not significant ( and ). These values of the total hemoglobin are plotted as the upper row in Fig. 6. When compared to the counterpart of the control group, the scattering intensity of the test group was similar on day 0 (), slightly reduced on day 12 (), and somewhat increased on day of euthanasia (). These values of the relative scattering intensity are plotted as the lower row in Fig. 6. Fig. 6Total hemoglobin and relative scattering intensity of the control group (bar at the left) and test group (bar at the right) on day 0, day 12, and the day of euthanasia. 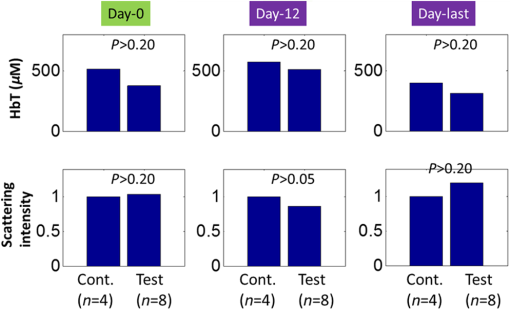 The scattering power, however, revealed a pattern of difference between the test rats and control rats on day 12 and the day of euthanasia, as shown in Fig. 7. On day 0, the scattering power of the eight rats in the test group was (), and that of the four rats in the control group was () (). On day 12, the scattering power of the eight rats in the test group () was significantly higher () than that of the control rats (). The change of the scattering power of the control group from day 0 to day 12 was not evident (), but that of the test group was significant (). On the day of euthanasia, the scattering power of the eight rats in the test group () was higher (, indicating evidence of a difference) than that of the control rats (). The change of the scattering power of the test rats between day 0 and day of euthanasia, an increase, was statistically significant (). 4.DiscussionIn this study, we have observed that the hepatic lipid accumulations of the MCD-fed rats were higher on day 28 compared to day 12, but lower on day 77 compared to day 49. This indicated a temporal course of increasing-then-decreasing fatty infiltration in the liver induced by MCD diet in agreement with previous reports. Itagaki et al.29 studied hepatic steatosis in mice induced by MCD diet for 2, 4, 8, 16, or 30 weeks. Oil Red O staining of the livers revealed fat deposition in hepatocytes after 2 weeks, increasing in concentration until 16 weeks but decreasing by week 30. The increasing-then-decreasing pattern of lipid infiltration in liver was also observed in other models of hepatic steatosis. In a bile duct ligation rat model, Lin et al.30 showed that accumulations of hepatic lipid droplets reached a maximum in week 4 and then appeared to stop growing in week 6, as compared to normal liver tissue. This study also observed that the spectral reflectance intensities of the livers of MCD-fed rats relative to those of the control rats increased from day 12 to day 28 and from day 28 to day 49 but decreased from day 49 to day 77. This increasing-then-decreasing pattern of relative spectral reflectance intensity of the livers of MCD-fed rats seems to correlate with the levels of histological fatty infiltration. With the removal of the absorption contribution to the scattering spectrum, the scattering intensities of the three rats euthanized on the same day (relative to that of the control rat) are presented in Fig. 8 for all sets of rats. The scattering intensity of the test rats relative to that of the control rats increased from day 12 to day 28 and from day 28 to day 49 but reduced from day 49 to day 77. It should be noted that the two MCD-fed rats on day 12 had lower-range mild lipid accumulation, and the control rat on day 77 had a slight level of lipid accumulation. The relative scattering intensities of the MCD-fed rats had been shown to vary over a large range, causing the average of those values for the day of euthanasia not to be significantly different from that of the control rats, as illustrated in the lower row of Fig. 6. Fig. 8Scattering intensities of the three test (T) rats on the respective days of euthanasia. The orange circle represents histological confirmation of lipid accumulation, with one circle representing mild accumulation, two circles moderate, and three circles severe. The rectangle represents control (C) lean liver, but the one with a superscript * for day 77 represents the histological finding of slight accumulation of lipid in the control liver when evaluated by Oil Red O staining. 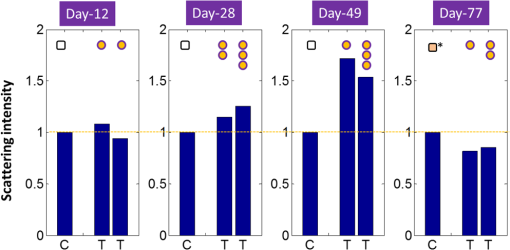 Among the eight test rats, four had mild lipid accumulation, two moderate, and two severe. The scattering powers of these test rats corresponding to each level of lipid accumulation and of the control rats are compared in Fig. 9. The scattering power was shown to increase from mild to moderate but decreased from moderate to severe levels of lipid accumulation. We postulate that this change of the scattering power may be the result of initial accumulation of primarily small lipid droplets prior to the lipid droplets increasing in size. Veteläinen et al.31 compared time courses and the lipid vacuole morphology in steatosis induced by choline-deficient or MCD diets in a rat model. After 1 week of diet intake, the MCD-fed rats initially developed mainly microvesicular steatosis with a macrovesicular component. At 3 weeks, macrovesicular steatosis was the main feature of steatosis, showing scattered foci of inflammatory cells. After 5 weeks of diet intake, the MCD-fed rats showed a diffuse and extensive macrovesicular steatosis. At 7 weeks, extensive macrovesicular steatosis throughout the section was observed. This present study of hepatic steatosis induced by the MCD diet observed that the two test rats euthanized on day 12 (or close to 2 weeks) had mild lipid accumulation that was mainly of the microvesicular type, the two test rats euthanized on day 28 (4 weeks) had moderate and severe lipid accumulations with macrovesicular dominance, and the severely infiltrated liver of the one test rat euthanized on day 49 (7 weeks) had large lipid droplets of in diameter. Fig. 9Scattering powers (mean values) corresponding to control rats (), rats with mild lipid accumulation (), moderate lipid accumulation (), and severe lipid accumulation (). 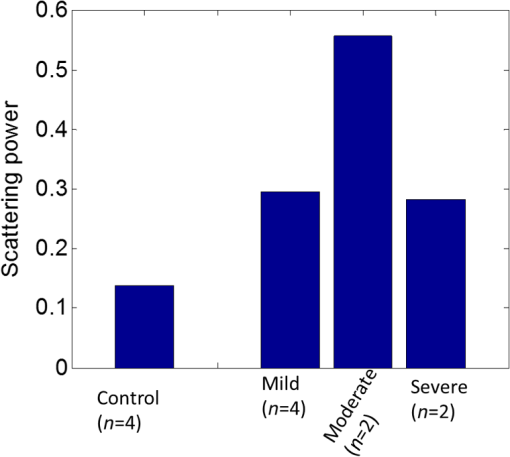 A simulation based on Mie theory may be useful to examining the patterns of scattering power changes in association with the lipid accumulation. We estimated the reduced scattering spectral profiles associated with different concentrations of spherical lipid particles in a background scattering medium mimicking the lean liver. The reduced scattering profile of the background medium was assumed to be , where and . The scattering power of 0.1 was chosen for the background medium, as it is between the scattering power of 0.17 of the four control rats on day 0 and 0.09 of the eight test rats on day 0. The total reduced scattering coefficient of the medium is assumed to be a linear combination of the reduced scattering coefficients of the background medium and the lipid content. Thus, at a lipid concentration of , the total reduced scattering coefficient of the lipid-containing medium is , where , is the number density, is the scattering efficiency, is the radius of the sphere, and is the scattering anisotropy. The computation of was based on the codes adapted from Wang and Wu,32 with the following parameters: the refractive index of the lipid is 1.46,33 the specific weight of the lipid is , and the specific weight of the fat-free mass is .34 The computed profile of was then fitted by to resolve an effective scattering power . The simulation was first conducted for lipid spheres at concentrations of 1%, 5%, and 15%, giving an effective scattering power of 0.13, 0.21, and 0.31, respectively, as illustrated in Fig. 10(a). The simulation was then conducted for 33% lipid concentration consisting of lipid spheres of 2, 10, and in diameter, giving an effective scattering power of 0.30, 0.20, and 0.19, respectively, as illustrated in Fig. 10(b). Despite the assumptions being very specific, the simulations indicated a pattern of scattering power increasing when small lipid particles built up in concentration, and the scattering power decreasing when the lipid particles at the same volume concentration of 33% increased in size from 2 to . Fig. 10(a) Effective scattering powers of the medium with lipid droplets increasing in concentration from 1% to 5% to 15% in comparison to that of the baseline. (b) Effective scattering powers of the medium at 33% concentration of lipid droplets with the size of the droplets increasing from to to in comparison to that of the baseline. 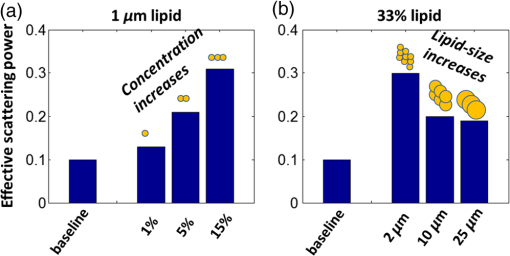 This study indicated that as the lipid droplets started to appear in the liver tissue, there was initially an increase of the scattering power; and as the lipid accumulation increased, there was an increase of the scattering intensity. Such changes of the scattering spectral characteristics may be in agreement with the development of fatty liver condition in this specific diet-induced animal model.35 In another study by Croce et al.36 that characterized in vivo autofluorescence properties of exposed rat livers modeled for lipid accumulation induced by hypercaloric MCD diet, changes of autofluorescence at 1 week of MCD diet reflected alterations both in tissue composition and organization. The changes of hepatocyte morphology at the earlier development of steatosis, however, were usually poorly detectable by sonography. As reported by van Werven et al.,7 although there was acceptable correlation of US with histopathologic analysis, US showed poor diagnostic performance in detecting hepatic steatosis in earlier development, as was observed in this present study for the changes occurring between day 0 and day 12. The relatively rapid development of the steatosis induced by the MCD diet appeared to alter the light scattering, as may be expected when considering the course of lipid droplets developing in the liver. As small lipid droplets start to appear in the liver, the small number of these lipid droplets might not be able to increase the overall scattering intensity compared to the tissue when the lipid droplets are absent; however, the locally different refractive index of the small lipid droplets compared to other hepatocyte constituents may cause a modulation of the scattering power. As the number of lipid droplets increases, the scattering intensity due to lipid will increase, which is interplayed by less significant changes of the scattering power compared to the initial stage of small lipid droplets increasing in concentration as the size of the lipid droplets increases. Therefore, the initial increase of the scattering power and a later increase of the scattering intensity in the mild to moderate fatty infiltration imply an initial appearance of smaller lipid droplets and later increase of the total number of the lipid droplets. The results also indicated that the spectral intensity of the liver with a higher level of lipid infiltration is not always greater than that with a lower level of lipid infiltration. This might relate to heterogeneity of the lipid accumulation. It could also be possible that as the size of the lipid droplets increases, that will increase the total lipid volume fraction and the total number of lipid droplets may decrease, thereby reducing the overall scattering intensity. Although the changes of the spectral profile of rats fed MCD diets longer than 49 days were less explicit when compared to the control rat, the initial increase of the scattering power among the test rats over the control rats as observed at 12 days after initiation of the diet demonstrates the expected spectroscopic response to the initial accumulation of primarily small lipid droplets prior to the lipid droplets increasing in size. This study is limited in the sample size and several other aspects. One limitation is associated with the useful spectral range of 540 to 1000 nm that barely covers the not-so-sharp absorption peak of lipid at 930 nm and becomes noisy around the water absorption peak at 980 nm. As a result, there is an interplay between the lipid absorption and water absorption spectra in the 900 to 1000 nm range, and the data analysis did not find a difference of the estimated lipid consistent with the histopathology results. Should the spectrometer-source configuration have provided sufficient sensitivity beyond 1000 nm to make it adequately responsive to the lipid8 and water absorption peaks,37 the estimated lipid composition to absorption could have been more consistent with the histopathology result. In estimating the chromophore contributions to the absorption, the exclusion of bile27 due to unavailability of the absorption spectra over the range of spectral measurement might have introduced some errors, even though the fitting used in this study had shown a near-ideal match of the absorption features at the 540 to 600 nm range wherein the hemoglobin absorption unquestionably dominates. Another limitation is associated with the use of a single fiber, which, in spite of the convenience and compatibility with a fine-needle-probing clinical protocol, cannot accurately extract the scattering coefficient without prior knowledge of the phase function of the tissue. This limitation resulted in a subtle interplay between scattering phase function and scattering coefficient on reflectance collected by a single fiber, and the interpretation of reflectance in terms of reduced scattering coefficient (and hence in scattering power ) is heuristic, but perhaps not definitive unless the measurements were performed using fiber probes with multiple fibers with different diameters.24,25 A fourth limitation is associated with the variability of the measurement itself. The respiration gating was useful in suppressing the measurement variability but insufficient to completely eliminate the variation of the measurement. Many operational factors could influence the measurements, including the quality of the fiber-tip polishing, the probe orientation, the length of the probe extruding from the needle, etc. The variations in the measurements protocol would interfere with the estimated optical parameters. With the variations of the measurement, one could expect that although differences of the optical parameters are shown in aggregate between rats of different diet groups and the optical parameters seem to match certain physiological rationale for the changes between the groups, the error or uncertainties on the optical parameters suggest that individual measurements could be less informative for the classification of individual subjects. This concern cannot be fully addressed without user-independent data acquisition, which may require automatic fixation of the fiber within the needle or a fixed needle-fiber probe,8 much faster data acquisition enabled by stronger light source and triggered by the cardiac signal, and more accurate calibration and quality control methods. The heterogeneity of liver disease, including locally heterogeneous lipid infiltration, may impose spatial heterogeneities in optical properties that require thoughtful sampling strategies in evaluating the steatosis conditions of the liver. A minimally invasive fine-fiber evaluation procedure like the single-fiber approach that does not remove the tissue can in principle be used for multiple sampling of tissue across different lobes of the liver or continuous evaluation along the track of insertion. A very fine fiber-needle probe that is less than 22 gauge may be directed to sample small suspicious foci in liver under US guidance of the needle/fiber trajectory to evaluate the tissue characteristics, including malignancy in addition to fatty components. Such potentials would be beneficial for a priori determination of the candidacy for procurement procedure, and a quantitative metric that may differentiate microvesicular steatosis from macrovesicular steatosis will be useful in improving the outcomes of procurement. 5.ConclusionIn conclusion, this explorative in vivo study evaluated how percutaneous SfS responded to the onset of hepatic steatosis in rats induced by an established diet-based model. Twelve rats were separated to four as the control group that were fed a normal diet and eight as the test group that were fed an MCD diet. In addition to the baseline test, percutaneous SfS of the rat livers was performed under transabdominal US guidance and respiration gated data acquisition on day 12, day 28, day 49, and day 77 after initiation of the diets. On each of these days, one control rat and two test rats were euthanized after SfS for histopathologic evaluation. Oil Red O staining of the livers determined that four test rats had mild lipid accumulation, two test rats had moderate lipid accumulation, and two test rats had severe lipid accumulation. The SfS measurements were model-fitted to isolate the contribution by scattering from absorption, by which the scattering power and the overall scattering intensity of the locally sampled liver parenchyma were evaluated. There appears to have been an earlier increase of the scattering power and a later increase of the scattering intensity of the livers of test rats when compared to those of their matched control rats. The results may have implications in the differentiation of microvesicular from macrovesicular steatosis for liver transplantation. AcknowledgmentsThis work was supported by a health research Grant No. HR11-043 from the Oklahoma Center for the Advancement of Science and Technology (OCAST) and partially by the Kerr foundation with an endowment to Bartels. ReferencesW. R. Kim et al.,
“OPTN/SRTR 2013 annual data report: liver,”
Am. J. Transplant., 15
(Suppl 2), 1
–28
(2015). http://dx.doi.org/10.1111/ajt.13197 Google Scholar
L. De Carlis,
“Is the use of marginal donors justified in liver transplantation? Analysis of results and proposal of modern criteria,”
Transpl. Int., 9 S414
–S417
(1996). http://dx.doi.org/10.1111/j.1432-2277.1996.tb01664.x Google Scholar
T. M. Fishbein et al.,
“Use of livers with microvesicular fat safely expands the donor pool,”
Transplantation, 64 248
–251
(1997). http://dx.doi.org/10.1097/00007890-199707270-00012 TRPLAU 0041-1337 Google Scholar
H. Yersiz et al.,
“Assessment of hepatic steatosis by transplant surgeon and expert pathologist: a prospective, double-blind evaluation of 201 donor livers,”
Liver Transpl., 19
(4), 437
–449
(2013). http://dx.doi.org/10.1002/lt.23615 Google Scholar
A. R. Hall et al.,
“Hepatic steatosis estimated microscopically versus digital image analysis,”
Liver Int., 33
(6), 926
–935
(2013). http://dx.doi.org/10.1111/liv.12162 Google Scholar
A. R. Teixeira et al.,
“The incapacity of the surgeon to identify NASH in bariatric surgery makes biopsy mandatory,”
Obes. Surg., 19
(12), 1678
–1684
(2009). http://dx.doi.org/10.1007/s11695-009-9980-x OBSUEB 0960-8923 Google Scholar
J. R. van Werven et al.,
“Assessment of hepatic steatosis in patients undergoing liver resection: comparison of US, CT, T1-weighted dual-echo MR imaging, and point-resolved 1H MR spectroscopy,”
Radiology, 256
(1), 159
–168
(2010). http://dx.doi.org/10.1148/radiol.10091790 RADLAX 0033-8419 Google Scholar
D. J. Evers et al.,
“Diffuse reflectance spectroscopy: toward real-time quantification of steatosis in liver,”
Transpl. Int., 28
(4), 465
–474
(2015). http://dx.doi.org/10.1111/tri.12517 Google Scholar
Y. Fudaba et al.,
“Intrahepatic triglyceride measurement and estimation of viability in rat fatty livers by near-infrared spectroscopy,”
Hepatol. Res., 45
(4), 470
–479
(2015). http://dx.doi.org/10.1111/hepr.12364 Google Scholar
T. Kitai, B. Beauvoit and B. Chance,
“Optical determination of fatty change of the graft liver with near-infrared time-resolved spectroscopy,”
Transplantation, 62 642
–647
(1996). http://dx.doi.org/10.1097/00007890-199609150-00018 TRPLAU 0041-1337 Google Scholar
B. L. McLaughlin et al.,
“Electrical and optical spectroscopy for quantitative screening of hepatic steatosis in donor livers,”
Phys. Med. Biol., 55
(22), 6867
–6879
(2010). http://dx.doi.org/10.1088/0031-9155/55/22/017 PHMBA7 0031-9155 Google Scholar
F. Zamboni et al.,
“Effect of macrovescicular steatosis and other donor and recipient characteristics on the outcome of liver transplantation,”
Clin. Transplant., 15
(1), 53
–57
(2001). http://dx.doi.org/10.1034/j.1399-0012.2001.150109.x Google Scholar
M. J. Lee et al.,
“Liver steatosis assessment: correlations among pathology, radiology, clinical data and automated image analysis software,”
Pathol. Res. Pract., 209
(6), 371
–379
(2013). http://dx.doi.org/10.1016/j.prp.2013.04.001 PARPDS Google Scholar
D. Piao et al.,
“A low-cost needle-based single-fiber spectroscopy method to probe scattering changes associated with mineralization in canine intervertebral disc,”
Photonics Lasers Med., 1
(2), 103
–115
(2012). http://dx.doi.org/10.1515/plm-2012-0006 Google Scholar
D. Piao et al.,
“Percutaneous single-fiber reflectance spectroscopy of canine intervertebral disc: Is there a potential for in situ probing of mineral degeneration?,”
Lasers Surg. Med., 46
(6), 508
–519
(2014). http://dx.doi.org/10.1002/lsm.22261 LSMEDI 0196-8092 Google Scholar
S. C. Kanick et al.,
“Integration of single-fiber reflectance spectroscopy into ultrasound-guided endoscopic lung cancer staging of mediastinal lymph nodes,”
J. Biomed. Opt., 15
(1), 017004
(2010). http://dx.doi.org/10.1117/1.3290822 Google Scholar
M. Canpolat et al.,
“Intra-operative brain tumor detection using elastic light single-scattering spectroscopy: a feasibility study,”
J. Biomed. Opt., 14
(5), 054021
(2009). http://dx.doi.org/10.1117/1.3247151 JBOPFO 1083-3668 Google Scholar
H. Radhakrishnan et al.,
“Light scattering from rat nervous system measured intraoperatively by near-infrared reflectance spectroscopy,”
J. Biomed. Opt., 10
(5), 051405
(2005). http://dx.doi.org/10.1117/1.2098487 JBOPFO 1083-3668 Google Scholar
S. Hariri Tabrizi et al.,
“Single fiber reflectance spectroscopy on cervical premalignancies: the potential for reduction of the number of unnecessary biopsies,”
J. Biomed. Opt., 18
(1), 017002
(2013). http://dx.doi.org/10.1117/1.JBO.18.1.017002 JBOPFO 1083-3668 Google Scholar
F. van Leeuwen-van Zaane et al.,
“In vivo quantification of the scattering properties of tissue using multi-diameter single fiber reflectance spectroscopy,”
Biomed. Opt. Express, 4
(5), 696
–708
(2013). http://dx.doi.org/10.1364/BOE.4.000696 BOEICL 2156-7085 Google Scholar
S. C. Kanick, H. J. C. M. Sterenborg and A. Amelink,
“Empirical model of the photon path length for a single fiber reflectance spectroscopy device,”
Opt. Express, 17
(2), 860
–871
(2009). http://dx.doi.org/10.1364/OE.17.000860 OPEXFF 1094-4087 Google Scholar
S. C. Kanick et al.,
“Monte Carlo analysis of single fiber reflectance spectroscopy: photon path length and sampling depth,”
Phys. Med. Biol., 54
(22), 6991
–7008
(2009). http://dx.doi.org/10.1088/0031-9155/54/22/016 PHMBA7 0031-9155 Google Scholar
S. C. Kanick et al.,
“Measurement of the reduced scattering coefficient of turbid media using single fiber reflectance spectroscopy: fiber diameter and phase function dependence,”
Biomed. Opt. Express, 2 1687
–1702
(2011). http://dx.doi.org/10.1364/BOE.2.001687 BOEICL 2156-7085 Google Scholar
S. C. Kanick et al.,
“Method to quantitatively estimate wavelength-dependent scattering properties from multidiameter single fiber reflectance spectra measured in a turbid medium,”
Opt. Lett., 36 2997
–2999
(2011). http://dx.doi.org/10.1364/OL.36.002997 OPLEDP 0146-9592 Google Scholar
U. A. Gamm et al.,
“Quantification of the reduced scattering coefficient and phase-function-dependent parameter of turbid media using multidiameter single fiber reflectance spectroscopy: experimental validation,”
Opt. Lett., 37 1838
–1840
(2012). http://dx.doi.org/10.1364/OL.37.001838 OPLEDP 0146-9592 Google Scholar
VirtualPhotonics Technology Initiative, “Virtual tissue simulator,”
(2015) http://www.virtualphotonics.org/software May ). 2015). Google Scholar
R. Nachabé et al.,
“Effect of bile absorption coefficients on the estimation of liver tissue optical properties and related implications in discriminating healthy and tumorous samples,”
Biomed. Opt. Express, 2 600
–614
(2011). http://dx.doi.org/10.1364/BOE.2.000600 BOEICL 2156-7085 Google Scholar
D. G. Altman and J. M. Bland,
“Absence of evidence is not evidence of absence,”
Br. Med. J., 311
(7003), 485
(1995). http://dx.doi.org/10.1136/bmj.311.7003.485 Google Scholar
H. Itagaki et al.,
“Morphological and functional characterization of non-alcoholic fatty liver disease induced by a methionine-choline-deficient diet in C57BL/6 mice,”
Int. J. Clin. Exp. Pathol., 6
(12), 2683
–2696
(2013). Google Scholar
J. Lin et al.,
“Assessment of liver steatosis and fibrosis in rats using integrated coherent anti-Stokes Raman scattering and multiphoton imaging technique,”
J. Biomed. Opt., 16
(11), 116024
(2011). http://dx.doi.org/10.1117/1.3655353 JBOPFO 1083-3668 Google Scholar
R. Veteläinen, A. van Vliet and T. M. van Gulik,
“Essential pathogenic and metabolic differences in steatosis induced by choline or methione-choline deficient diets in a rat model,”
J. Gastroenterol. Hepatol., 22
(9), 1526
–1533
(2007). http://dx.doi.org/10.1111/j.1440-1746.2006.04701.x JGHEEO 1440-1746 Google Scholar
L. V. Wang and H. Wu, Biomedical Optics: Principles and Imaging, John Wiley & Sons, Inc., Hoboken, New Jersey
(2007). Google Scholar
M. Ardhammar, P. Lincoln and B. Nordén,
“Invisible liposomes: refractive index matching with sucrose enables flow dichroism assessment of peptide orientation in lipid vesicle membrane,”
Proc. Natl. Acad. Sci. U. S. A., 99
(24), 15313
–15317
(2002). http://dx.doi.org/10.1073/pnas.192583499 Google Scholar
B. M. Prior et al.,
“Muscularity and the density of the fat-free mass in athletes,”
J. Appl. Physiol., 90
(4), 1523
–1531
(2001). Google Scholar
M. S. Gauthier, R. Favier and J. M. Lavoie,
“Time course of the development of non-alcoholic hepatic steatosis in response to high-fat diet-induced obesity in rats,”
Br. J. Nutr., 95
(2), 273
–281
(2006). http://dx.doi.org/10.1079/BJN20051635 BSJSE4 1057-6606 Google Scholar
A. C. Croce et al.,
“Integrated autofluorescence characterization of a modified-diet liver model with accumulation of lipids and oxidative stress,”
Biomed. Res. Int., 2014 803491
(2014). http://dx.doi.org/10.1155/2014/803491 Google Scholar
A. Cerussi et al.,
“Predicting response to breast cancer neoadjuvant chemotherapy using diffuse optical spectroscopy,”
Proc. Natl. Acad. Sci. U. S. A., 104
(10), 4014
–4019
(2007). http://dx.doi.org/10.1073/pnas.0611058104 Google Scholar
|


