|
|
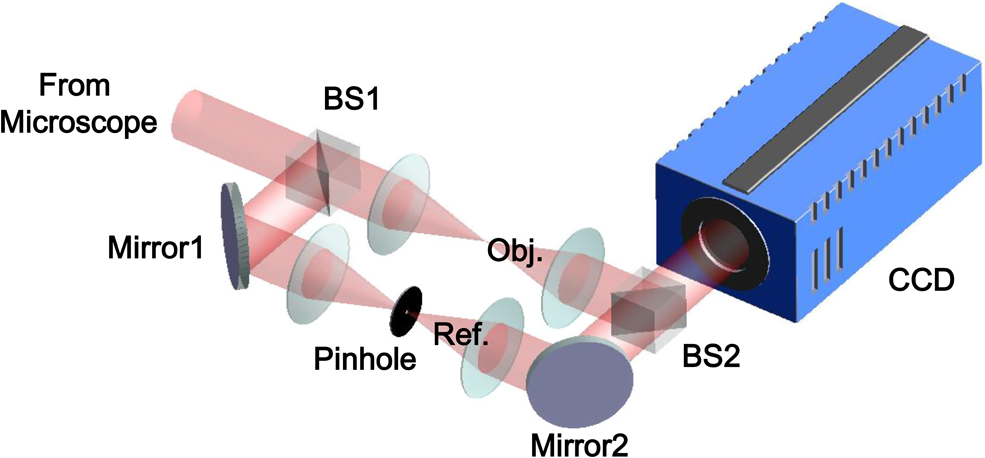
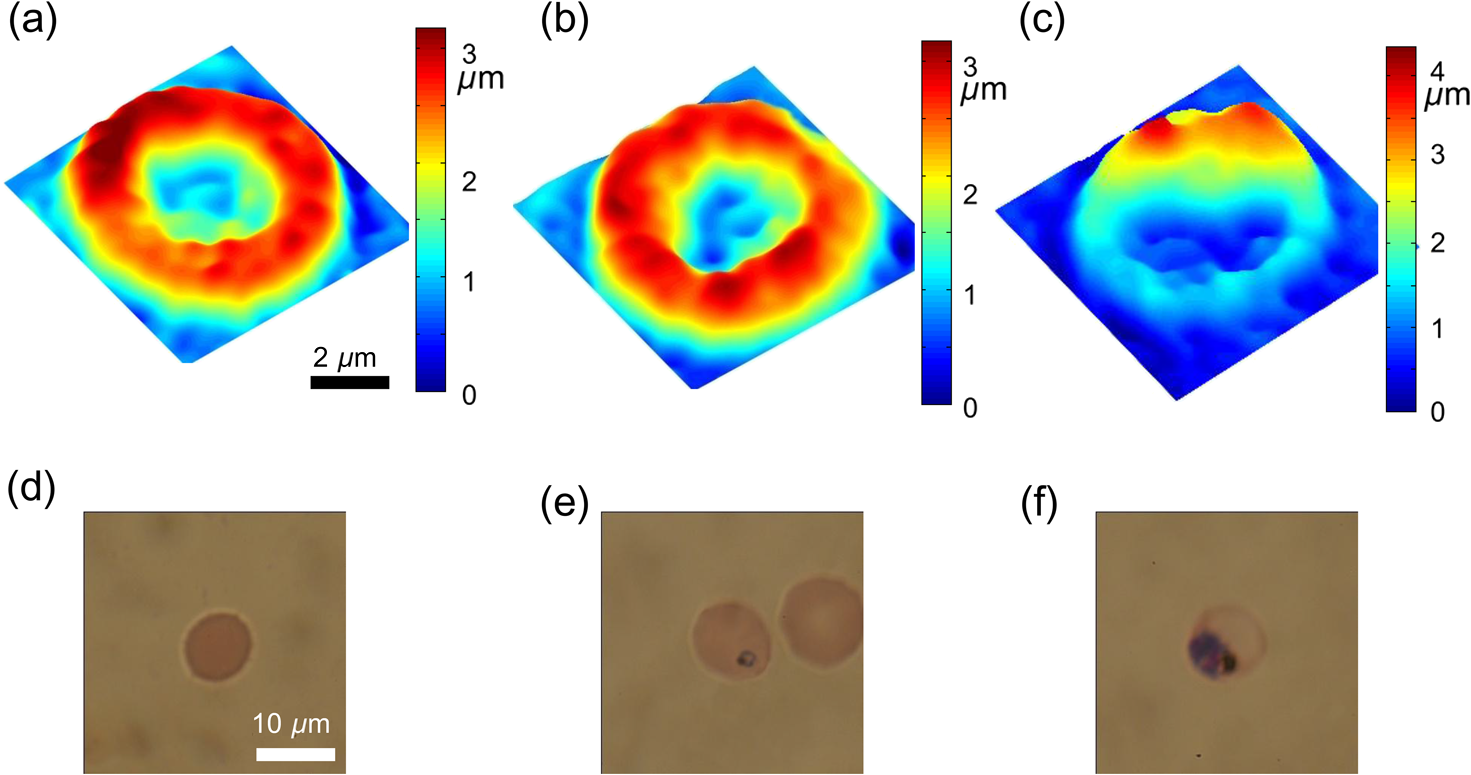
1.IntroductionPlasmodium falciparum is a malaria parasite that causes morphological, biochemical, and mechanical changes in red blood cells (RBCs). The major morphological changes in infected RBCs (iRBCs) include loss of cell volume and appearance of protrusions called “knobs.”1 Biochemical changes include hemoglobin digestion by malaria parasites and consequent production of insoluble hemozoin.2 Hemozoin is a brown crystal located in the vacuoles of parasites and appears in the developmental stages of P. falciparum. The major mechanical change is the loss of RBC deformability.3,4 The deformability of single RBCs has been estimated by using various methods. Micropipette aspiration was extensively utilized to measure the mechanical properties of RBC membranes.5–8 Atomic force microscopy was also employed to evaluate Young’s modulus of RBCs.9,10 Optical tweezers with a highly focused laser beam were used to optically manipulate spherical particles attached to an RBC. They were used to measure the deformability of single RBCs. Optical trapping was also utilized to measure RBC deformability.11,12 In addition, membrane fluctuations was used.13–15 The fluctuating characteristics of the phospholipid bilayer and the corresponding spectrin network are affected by internal and external conditions, such as cytoskeletal defects and stress caused by malaria parasites.16–18 These alterations are used to obtain mechanical insights about the pathology of malaria. Malaria has been investigated using various imaging techniques. Optical microscopy is applied with staining, particularly Giemsa staining, to observe the abnormal shape and existence of malaria parasites. A variety of fluorescence imaging techniques, including near-field fluorescence and fluorescent fusion protein, are also utilized to discern the submicron-scale phenomenon.19,20 In addition, electron microscopy techniques are used to study the structural variation of malaria-infected RBCs.21,22 Soft x-rays are introduced to investigate the internal structure of iRBCs by using the transmissivity of the x-ray beams.23,24 Furthermore, digital holographic microscopy has been recently used to identify and monitor morphological changes in iRBCs.25 This method has been adopted in smartphones, and its usefulness has greatly increased.26 The quantitative phase imaging (QPI) technique has received considerable attention due to its usefulness in imaging biological cells.13–15,27–30 QPI utilizes interferometry to quantitatively reconstruct the optical field information of cells, particularly the optical phase delay caused by biological cells. This technique allows the noninvasive and label-free investigation of biological cells because external sources, such as fluorescence, are not needed. Therefore, live cells can be observed directly. The dynamic behavior of live cells can be further monitored on the millisecond time scale through high-speed imaging techniques. Various antimalarial drugs, including quinine, chloroquine, and artemisinin, have been used to treat malaria. Among those drugs, chloroquine is still frequently prescribed.31,32 It is relatively effective, safe, and water soluble compared to the artemisinin combination therapies, which impose financial, logistical, and safety burdens on patients. In addition, the prescription of chloroquine is getting attention in these days because chloroquine-sensitive malaria has appeared again.33–35 Chloroquine has been known to be accumulated in acidic food vacuoles, thereby preventing the degradation of hemoglobin. Although there are many previous studies about the inhibition effects of antimalarial drugs on malaria growth, the deformability of drug-treated iRBCs was rarely studied. Zhang et al.36 reported that chloroquine and artesunate did not directly affect the shear modulus of iRBC, although detailed analysis was not provided. In addition, there are several researchers who studied the effect of antimalarial drugs on the deformability and membrane of iRBCs. However, those studies did not focus on the deformability of the RBC membrane. Although the effect of artesunate on cell deformability was studied, the deformability of the cell rather than the membrane itself was the focus.37 The effect of pentoxifylline used as an ancillary drug to improve cell deformability was also studied. However, its effectiveness on malaria treatment is still controversial.3,38 Although these previous studies mainly investigated the effect of antimalarial drugs on iRBCs, the study on mechanical properties of the membrane of drug-treated iRBCs is another important topic that has to be investigated for reliable diagnosis of therapeutic effect of antimalarial drugs on the iRBC membrane. In addition, more than 50% of RBCs in the blood stream are infected in the case of severe malaria infection.39–41 Once an RBC is infected, its basic abilities, such as oxygen transportation, are diminished.3,42 Therefore, in the recovery process of the infectious disease, the biophysical properties of drug-treated infected cells are important factors. Among various biophysical properties, cell deformability is a critical issue in the microcirculation of iRBCs. Therefore, the study on membrane deformability of drug-treated iRBCs is essentially important. It would be helpful to understand the drug-disease relation at the cell level. In this study, the deformabilities of RBCs at various states were estimated by measuring their membrane fluctuations through holographic QPI. The deformabilities of healthy RBCs (hRBCs), iRBCs, and drug-treated iRBCs were compared, and the effect of an antimalarial drug (chloroquine) on iRBC restoration was experimentally investigated. This study would be useful for elucidating the pathology of malaria and the drug-related interaction with iRBCs. 2.Materials and MethodsThe overall experimental setup is a modified version of common-path diffraction phase microscopy,13,27 as depicted in Fig. 1. An He–Ne laser () was used as the light source. The laser beam passes through a test sample and is then divided into two beams by a beam splitter. One beam is used as the objective beam, and the other beam, which passes through a pinhole, is used as the reference beam. By tilting the angle of a mirror in the reference beam path, the location of a real image in the frequency domain can be adjusted. The location of the real image is important in the determination of the spatial resolution of an off-axis type of holographic microscopy.43 By locating the real image far away from the DC term in the frequency domain, spatial resolution can be obtained at a specific diffraction limit. A microscope objective with magnification (0.75 NA) was mounted on an upright microscope (Eclipse i50, Nikon). Additional relay optics were used to provide an overall magnification of approximately . A charge-coupled device (CCD) camera (PCO 2000, , ) was utilized to capture digital hologram images. Holograms were consecutively captured by a CCD camera at a frame rate of 10 fps in this study. A hologram image was numerically reconstructed by employing an angular spectrum algorithm. Angular spectrum can be obtained by derivation from the wave field at the hologram plane as follows: where and denote the spatial frequencies of and , respectively. and represent the in-plane coordinates.Zero-order, virtual, and real images in the frequency domain were separately observed. Spatial filtering was applied in the Fourier domain to eliminate zero-order and virtual images by cropping real images. The cropped image was relocated at the center of the Fourier domain. The complex wavefield at a certain plane can be reconstructed as follows: where represents the angular spectrum. and denote the Fourier transform and the inverse Fourier transform, respectively. An amplitude image was obtained from the intensity distribution of the complex wavefield. In addition, the corresponding phase-contrast image can be acquired through the following equation:From instantaneous phase information, the instantaneous thickness of the test cell was obtained by the following equation: where is the wavelength, , are the refractive indices of the cell and surrounding medium, and is the reconstructed phase information.44 The refractive indices of RBCs were already determined by a previous study.13 The standard deviation of the optical path length measured for a background area is . This value demonstrates the path length stability of the microscopic system employed in this study.Human blood was centrifuged at 1500 rpm for 5 min at 10°C to separate RBCs from plasma. RBCs were resuspended in plasma to make a hematocrit of . Malaria-infected RBCs were prepared as follows: P. falciparum (isolate 3D7) was maintained in an RPMI 1640 medium [buffered with 25 mM 4-(2-hydroxyethyl)-1-piperazineethanesulfonic acid (HEPES) and 25 mM ] containing human erythrocytes and supplemented with gentamicin and hypoxanthine under a gas mixture containing 5% , 5% , and 90% at 37°C in an incubator. All experimental procedures were approved by the Institutional Biosafety Committee of Pohang University of Science and Technology. For drug treatments, the cultured iRBCs were individually distributed to 96 wells to monitor the effect of the drug on individual cells when iRBCs were in the ring stage. The wells were divided into two groups. The first group was injected with the RPMI solution without the chloroquine solution as the control group. The second group was injected with the 200 nM chloroquine solution. The two groups were incubated for 72 h to inhibit the growth of malaria more than 99%.45,46 The infection rate of P. falciparum was to 2.0%. After the infected RBCs were introduced to the drug treatment, they were resuspended in the RPMI 1640 solution before the experimental measurement. Droplets of RBC suspension were sandwiched between a slide glass and a cover slip, and the environmental temperature was maintained at 36.7°C. Hologram images of hRBCs, iRBCs at the ring and trophozoite stages, drug-treated iRBCs, and drug-treated hRBCs were captured. All samples were stained with Giemsa solution after their measurements to confirm the infection by malaria parasites and to check the antimalarial drug effect. For each experimental condition of RBCs, 15 cells were collected and their phase information was measured. Statistical analysis was carried out using one-way analysis of variance (ANOVA). 3.Results3.1.Modified Common-Path Diffraction Phase MicroscopyThe thickness of the biological cells was calculated from their reconstructed phase image. Figure 2(a) shows the typical phase image of an hRBC. The image presents the topographic shape of an RBC with the surrounding rim and dimple inside. The shape of each cell was determined by averaging the consecutive thickness maps of the cells. The topographic shape of RBCs can be utilized as the first criterion to discriminate iRBCs from blood samples in the diagnosis of malaria infection. Fig. 2(a) A typical instantaneous topographic image. (b) Instantaneous fluctuation map of healthy red blood cells (hRBC). (c) Temporal variations of cell thickness at two points located at empty space (A) and inner cell (B) marked as red spots in (a) and (b).  The phase fluctuations of RBCs are caused by the vibration of the cell membrane and the instability of the experimental condition. The phase fluctuations caused by the instability of the experimental condition may result in inconsistent analysis of the phenomenon. The common-path type diffraction phase microscopy demonstrates strong points in the phase stability. The stability in phase images was estimated by measuring the fluctuations of an empty space without any sample. Figure 2(b) shows an instantaneous fluctuation map of an hRBC. Instantaneous fluctuations at an empty space (A) and an inner cell (B) appear quite different. The detailed temporal variations of cell thickness at certain points of the empty space and inner cell are depicted in Fig. 2(c). The fluctuation signal extracted at the inner cell shows large variation with a standard deviation of 94.04 nm. On the other hand, the fluctuation at the empty background space exhibits a small variation. The thickness variation at the empty space (A) presents a small standard deviation value of 1.98 nm. This finding indicates that fluctuations caused by the instability of the experimental condition are lower than a few nanometers. By contrast, point (B) in the rim region exhibits a large deviation of 94.04 nm with a mean thickness of . This deviation is consistent with the result of a previous study and the rim thickness of the RBC rim (2 to ).27 Therefore, the fluctuations at the empty space and inner cells are clearly distinguished. This indicates that the modified common-path diffraction phase microscopy employed in this study is suitable for analysis of cell membrane fluctuations. 3.2.Topographic Images of Infected Red Blood CellsFigures 3(a)–3(c) show the representative topographic images of RBCs at various stages. hRBCs and iRBCs at the early ring stage exhibit a similar topographic configuration with a clear biconcave rim and dimple. Conversely, iRBCs at the trophozoite stage exhibit an unexpected peculiar topographic shape compared to the shape of the optical image. This feature is caused by the presence of hemozoin and parasites inside the cell. Since it has different refractive indices, the thickness measurements may contain errors. Figures 3(d)–3(f) show the corresponding images of Giemsa-stained RBCs in the same RBC group. No stained region is detected in the hRBCs. On the other hand, iRBCs at the early ring stage demonstrate stained points inside the cell, and those at the trophozoite stage exhibit an enlarged stained region inside the cell. All these images are consistent with the standard Giemsa staining image of malaria-infected RBCs. 3.3.Fluctuation and Deformability AnalysisThe membrane fluctuations of various cells are shown in Fig. 4(a). iRBCs and drug-treated iRBCs have a narrower range in the probability density profiles of membrane fluctuations compared to that of hRBCs. This implies that the standard deviation of membrane fluctuations in hRBC is larger than that of the others. In addition, with the progression of malaria, the profiles become narrower. This decreased range of membrane fluctuations is clearly depicted in the variation of full-width at half-maximum (FWHM), as shown in Fig. 4(b). The FWHM value of the ring-stage iRBC is decreased by more than 30% compared to that of hRBC. For the case of the trophozoite-stage iRBC, it is decreased by 50% from that of hRBC. However, there is no noticeable difference between FWHM values of ring-stage iRBC and drug-treated iRBC. Fig. 4(a) Probability density profiles of cell membrane fluctuations. (b) Comparison of full-width at half- maximum values of probability density profiles of RBCs at different infection states. 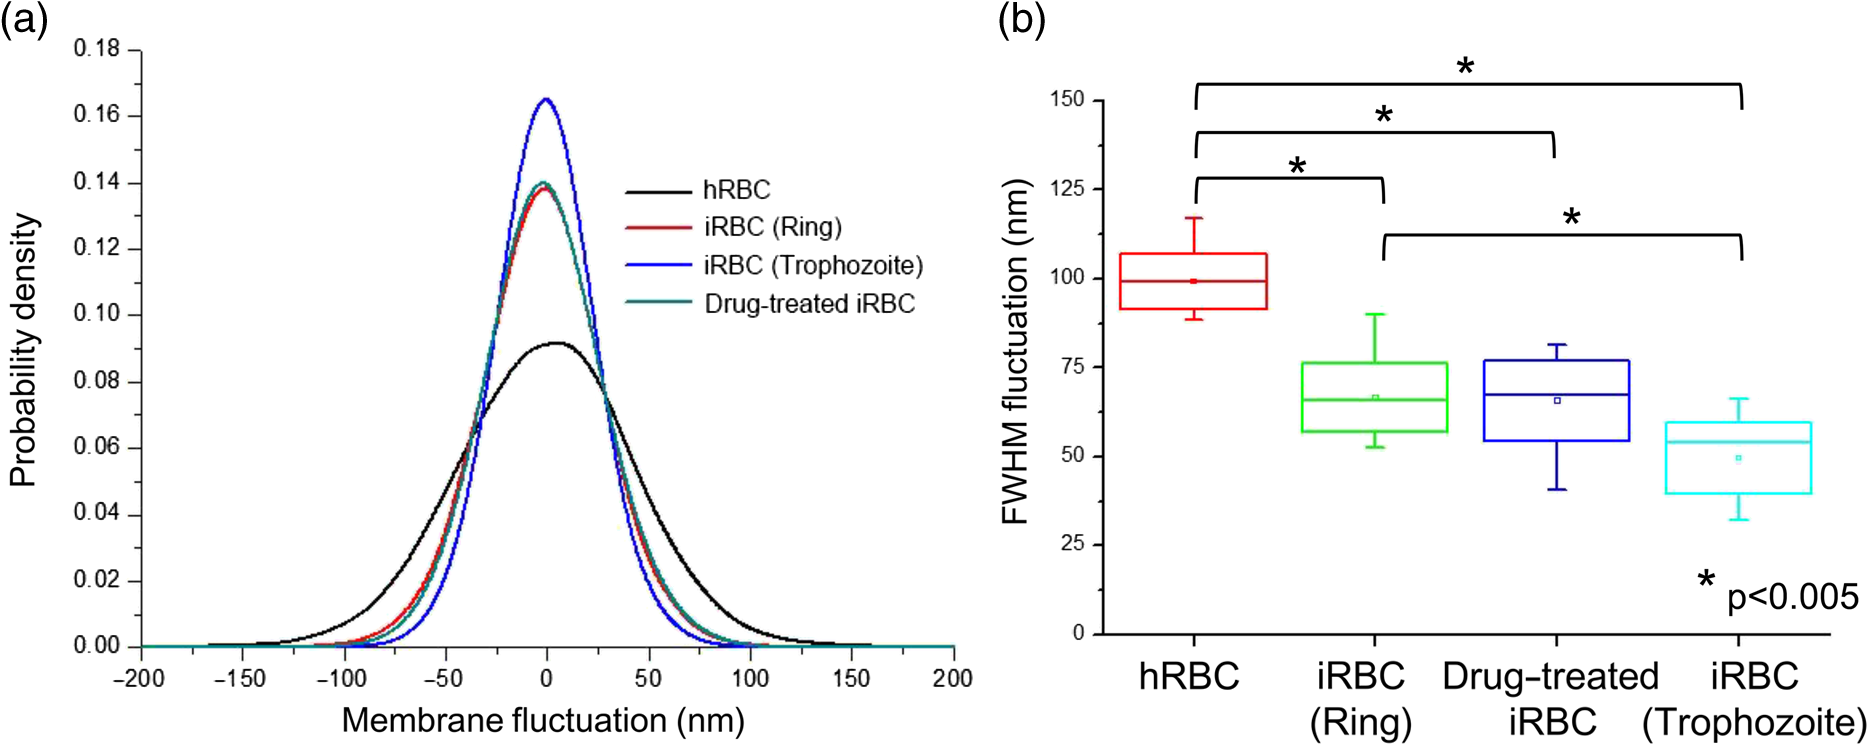 The deformability of RBCs is related to the stiffness of the cell membrane. The in-plane shear modulus of the RBC membrane can be estimated from the temporal variations of instantaneous thickness and topographic cell shape of each RBC. The in-plane shear modulus was calculated using the Fourier-transformed Hamiltonina and equipartition theorem47 as follows: where is the Boltzmann constant, is the absolute temperature, is the diameter of the RBCs, and is the spatial wavelength of the microscopy system. The axial variation can be obtained by subtracting the time-averaged cell thickness value from each instantaneous thickness value. The tangential component of the variation was obtained by separating the axial variation with the angle between the surface normal vector of the cell and the axial direction. The average value of was statistically evaluated in the cell region, and the in-plane shear modulus was quantitatively estimated.Because the refractive indices of malaria parasite and hemozoin are different from that of the hemoglobin solution, their existence can cause artifacts in the analysis of membrane fluctuation. Although the location of a malaria parasite is detectable from its continuous movement in a bright microscopy image, hemozoin is difficult to observe. However, hemozoin is usually observed near the location of parasites. Excluding the cell region whose radius is two times larger than that of the parasite minimized the effect of parasite and hemozoin in the analysis of membrane fluctuations. Figure 5 presents the shear moduli of RBCs at various stages. hRBCs exhibit a shear modulus of about . The modulus of iRBCs at the early ring stage () and trophozoite stage () is consistent with previous results measured with optical tweezers and diffraction phase microscopy.4,13 The modulus of drug-treated iRBCs is , which is similar to that of iRBCs at the early ring stage. However, this value clearly differs from that of iRBCs (trophozoite stage) without drug treatment. In addition, the modulus of drug-treated hRBCs is , which is not statistically different from that of the hRBCs. 4.DiscussionThe topographic shapes of single RBCs significantly change from a normal discocyte to an abnormal shape after the trophozoite stage. The modifications in the internal and membrane structures caused by invasion of malaria parasites are represented by their morphological changes. The measured thickness image of iRBCs may provide inconsistent information because the refractive indices of the parasite and hemozoin in the inner cell differ from those of the surrounding hemoglobin solution. Therefore, the present topographic image of iRBCs presents an eccentric shape compared with that observed through optical microscopy. This finding indicates that morphological alterations caused by parasite infection and development of malaria are clearly detected. Therefore, the morphological changes in the topographic phase image of RBCs can be used as the first criterion to detect abnormal cells, including malaria-infected cells. As depicted in Fig. 4(b), FWHM values are continuously decreased after the malaria infection. This indicates that the overall level of membrane thickness fluctuations of iRBCs is decreased with the progression of malaria. These results are consistent with the previous studies.13 Fluctuations of the cell membrane are related to the stiffness of the biological cell. In addition, the stiffness of the cell membrane is also directly related to the shear modulus of the cell and its deformability. Hence, the decreased fluctuation in the membrane thickness of an iRBC indicates its increased shear modulus and decreased deformability under the same temperature conditions. RBCs at different malaria stages exhibit different shear moduli, and the values gradually increase as the disease progresses [Fig. 5, hRBCs, iRBCs (ring), iRBCs (trophozoite)]. This finding indicates that RBCs become stiffer and gradually lose their deformability. The shear modulus of iRBCs presents a larger deviation than that of hRBCs. This result is attributed to the varied invasion time of parasites in different cells. In addition, the development of malaria disease is dependent on the condition of individual cells. The effect of an antimalarial drug on the deformation and restoration of iRBCs was also examined. After treatment with an antimalarial drug, inhibition of malaria growth was confirmed through topographic and optical images. The drug effect on iRBCs was detected by comparing the shear moduli of iRBCs and drug-treated iRBCs. The shear modulus of iRBCs does not significantly change after drug treatment. This finding indicates that an antimalarial drug can effectively maintain cell deformability. It also implies that malaria parasites become ineffective because the stiff membrane is mainly caused by protein exported by the parasites. In addition, malarial parasites are considered to be dead after 72 h of drug treatment because the drug concentration used in this study is sufficient to inhibit their growth.45,46 Even though a few parasites survive after treating with an antimalarial drug, the surviving iRBCs disappear after 72 h because the intraerythrocytic cycle is already over and the cells have burst. Therefore, the drug-treated iRBCs would contain dead parasites. The antimalarial drug was also used to treat hRBCs for a control group. As a result, it is found to be ineffective for hRBCs. The shear modulus of drug-treated hRBCs is not significantly different from that of hRBCs. A previous study reported that chloroquine was not absorbed by hRBCs,48,49 therefore, it does not significantly influence the modulus of hRBCs but affects that of iRBCs. The comparison of the shear moduli of iRBCs and drug-treated iRBCs shows that the membrane deformability of RBCs is not restored even after drug treatment. This finding implies that the cell membrane of iRBCs undergoes irreversible changes. These irreversible changes of iRBCs were reported for various conditions, such as high temperature or activation of related proteins.13 Because other conditions are fixed in this study, only parasite-related factors affect the modification of the cell membrane. By killing malaria parasites, those parasite-related factors can be neutralized. In detail, parasite-exported proteins cause changes to the deformability of iRBC.16–18 In the (early) ring stage of the intraerythrocytic cycle, various proteins, such as the P. falciparum erythrocyte membrane protein 1 and 3, as well as the ring-infected erythrocyte surface antigen (RESA), are detected. These proteins bind to the cytoskeleton of the RBCs and then decrease the deformability of the RBC membrane when the parasite is alive. In addition, the fast release of RESA after the invasion explains the decreased shear modulus of the early ring-stage malaria. However, after the parasite is dead, these proteins are no longer exported. Therefore, the membrane damage caused by these proteins is stopped. Although the secretion of membrane proteins is stopped, the shear modulus of the drug-treated iRBCs is not recovered but is maintained. This implies that some of these proteins may cause irreversible changes in the cell membrane. This irreversible change can also be explained because the tetrameric state of the membrane spectrin is stabilized by RESA, which prevents the dissociation of spectrin tetramers.15 This irreversible variation may also appear in other antimalarial drugs because the effects of parasite-exported proteins are common for similar types of malaria. However, the unchanged shear modulus of drug-treated iRBCs may vary depending on the type of drug, because the pharmacological mechanisms differ for each drug. For example, artemisinin, another well-known antimalarial drug, is known to be toxic because it causes membrane damage.50 On the contrary, chloroquine is regarded as harmless to the cell membrane because it is accumulated only at acidic food vacuoles of the parasite.48 This explanation is in accordance with the measured shear moduli of hRBCs and drug-treated hRBCs. 5.ConclusionIn this study, the effect of an antimalarial drug on malaria-infected RBCs was examined using modified common-path type diffraction phase microscopy. With the help of a nanometer-scale path length stability, the topographic images of various RBCs were obtained and their membrane fluctuation was quantitatively analyzed. The shear moduli of RBCs were estimated using the fluctuations of the cell membrane. The topographic phase images provide information regarding the abnormal thickness of iRBCs compared with the normal cells. This abnormal configuration of iRBCs can be used as the first criterion for screening iRBCs from blood samples. The shear modulus of iRBCs increases as malaria grows. It exhibits a higher value than that of hRBCs. The effect of chloroquine as a representative antimalarial drug on the RBC membrane was also experimentally investigated. The drug effectively suppressed malarial growth and inhibited the aggravation of RBC deformability. However, the deformability of RBCs was not restored even after the malaria parasites died. This finding indicates that the membrane alteration caused by parasite-exported proteins is irreversible. Further detailed investigation on the protein-related membrane alteration in RBCs is required. The obtained results are useful to elucidate the pathology of the malaria disease and the effectiveness of antimalarial drugs. AcknowledgmentsThis work was supported by the National Research Foundation of Korea (NRF) grant funded by the Korea government (MSIP) (Grant No. 2008-0061991). ReferencesB. S. Crabb et al.,
“Targeted gene disruption shows that knobs enable malaria-infected red cells to cytoadhere under physiological shear stress,”
Cell, 89 287
–296
(1997). http://dx.doi.org/10.1016/S0092-8674(00)80207-X CELLB5 0092-8674 Google Scholar
S. E. Francis, D. J. Sullivan and D. E. Goldberg,
“Hemoglobin metabolism in the malaria parasite Plasmodium falciparum,”
Ann. Rev. Microbiol., 51 97
–123
(1997). http://dx.doi.org/10.1146/annurev.micro.51.1.97 Google Scholar
A. M. Dondorp et al.,
“Abnormal blood flow and red blood cell deformability in severe malaria,”
Parasitol. Today, 16 228
–232
(2000). http://dx.doi.org/10.1016/S0169-4758(00)01666-5 Google Scholar
S. Suresh et al.,
“Connections between single-cell biomechanics and human disease states: gastrointestinal cancer and malaria,”
Acta Biomater., 1 15
–30
(2005). http://dx.doi.org/10.1016/j.actbio.2004.09.001 Google Scholar
E. A. Evans and P. L. La Celle,
“Intrinsic material properties of the erythrocyte membrane indicated by mechanical analysis of deformation,”
Blood, 45 29
–43
(1975). Google Scholar
R. M. Hochmuth,
“Micropipette aspiration of living cells,”
J. Biomech., 33 15
–22
(2000). http://dx.doi.org/10.1016/S0021-9290(99)00175-X Google Scholar
C. Lim et al.,
“Experimental techniques for single cell and single molecule biomechanics,”
Mater. Sci. Eng. C, 26 1278
–1288
(2006). http://dx.doi.org/10.1016/j.msec.2005.08.022 Google Scholar
A. Sinha et al.,
“Single-cell evaluation of red blood cell bio-mechanical and nano-structural alterations upon chemically induced oxidative stress,”
Sci. Rep., 5 9768
(2015). http://dx.doi.org/10.1038/srep09768 Google Scholar
I. Dulińska et al.,
“Stiffness of normal and pathological erythrocytes studied by means of atomic force microscopy,”
J. Biochem. Biophys. Method, 66 1
–11
(2006). http://dx.doi.org/10.1016/j.jbbm.2005.11.003 Google Scholar
J. L. Maciaszek and G. Lykotrafitis,
“Sickle cell trait human erythrocytes are significantly stiffer than normal,”
J. Biomech., 44 657
–661
(2011). http://dx.doi.org/10.1016/j.jbiomech.2010.11.008 Google Scholar
C. Lim et al.,
“Large deformation of living cells using laser traps,”
Acta Mater., 52 1837
–1845
(2004). http://dx.doi.org/10.1016/j.actamat.2003.12.028 ACMAFD 1359-6454 Google Scholar
K. Bambardekar et al.,
“Measuring erythrocyte deformability with fluorescence, fluid forces, and optical trapping,”
J. Biomed. Opt., 13 064021
(2008). http://dx.doi.org/10.1117/1.3037342 Google Scholar
Y. K. Park et al.,
“Refractive index maps and membrane dynamics of human red blood cells parasitized by Plasmodium falciparum,”
Proc. Natl. Acad. Sci. U. S. A., 105 13730
–13735
(2008). http://dx.doi.org/10.1073/pnas.0806100105 Google Scholar
R. Chandramohanadas et al.,
“Biophysics of malarial parasite exit from infected erythrocytes,”
Plos One, 6 e20869
(2011). http://dx.doi.org/10.1371/journal.pone.0020869 POLNCL 1932-6203 Google Scholar
M. Diez-Silva et al.,
“Pf155/RESA protein influences the dynamic microcirculatory behavior of ring-stage Plasmodium falciparum infected red blood cells,”
Sci. Rep., 2 614
(2012). http://dx.doi.org/10.1038/srep00614 Google Scholar
F. K. Glenister et al.,
“Contribution of parasite proteins to altered mechanical properties of malaria-infected red blood cells,”
Blood, 99 1060
–1063
(2002). http://dx.doi.org/10.1182/blood.V99.3.1060 BLOOAW 0006-4971 Google Scholar
E. Knuepfer et al.,
“Trafficking determinants for PfEMP3 export and assembly under the Plasmodium falciparum-infected red blood cell membrane,”
Mol. Microbiol., 58 1039
–1053
(2005). http://dx.doi.org/10.1111/j.1365-2958.2005.04895.x Google Scholar
J. P. Mills et al.,
“Effect of plasmodial RESA protein on deformability of human red blood cells harboring Plasmodium falciparum,”
Proc. Natl. Acad. Sci. U. S. A., 104 9213
–9217
(2007). http://dx.doi.org/10.1073/pnas.0703433104 Google Scholar
T. Enderle et al.,
“Near-field fluorescence microscopy of cells,”
Ultramicroscopy, 71 303
–309
(1998). http://dx.doi.org/10.1016/S0304-3991(97)00075-2 ULTRD6 0304-3991 Google Scholar
S. Cho et al.,
“Optical imaging techniques for the study of malaria,”
Trends Biotechnol., 30 71
–79
(2012). http://dx.doi.org/10.1016/j.tibtech.2011.08.004 Google Scholar
D. T. Riglar et al.,
“Super-resolution dissection of coordinated events during malaria parasite invasion of the human erythrocyte,”
Cell Host Microbiol., 9 9
–20
(2011). http://dx.doi.org/10.1016/j.chom.2010.12.003 Google Scholar
L. Tilley, M. W. A. Dixon and K. Kirk,
“The Plasmodium falciparum-infected red blood cell,”
Int. J. Biochem. Cell B, 43 839
–842
(2011). http://dx.doi.org/10.1016/j.biocel.2011.03.012 Google Scholar
C. Magowan et al.,
“Intracellular structures of normal and aberrant Plasmodium falciparum malaria parasites imaged by soft x-ray microscopy,”
Proc. Natl. Acad. Sci. U. S. A., 94 6222
–6227
(1997). http://dx.doi.org/10.1073/pnas.94.12.6222 Google Scholar
M. W. M. Jones et al.,
“Rapid, low dose X-ray diffractive imaging of the malaria parasite Plasmodium falciparum,”
Ultramicroscopy, 143 88
–92
(2014). http://dx.doi.org/10.1016/j.ultramic.2013.09.003 ULTRD6 0304-3991 Google Scholar
A. Anand et al.,
“Automatic identification of malaria-infected RBC with digital holographic microscopy using correlation algorithms,”
IEEE Photonics J., 4 1456
–1464
(2012). http://dx.doi.org/10.1109/JPHOT.2012.2210199 Google Scholar
W. Bishara et al.,
“Holographic pixel super-resolution in portable lensless on-chip microscopy using a fiber-optic array,”
Lab Chip, 11 1276
–1279
(2011). http://dx.doi.org/10.1039/c0lc00684j LCAHAM 1473-0197 Google Scholar
G. Popescu et al.,
“Diffraction phase microscopy for quantifying cell structure and dynamics,”
Opt. Lett., 31 775
–777
(2006). http://dx.doi.org/10.1364/OL.31.000775 Google Scholar
W. Choi et al.,
“Tomographic phase microscopy,”
Nat. Methods, 4 717
–719
(2007). http://dx.doi.org/10.1038/nmeth1078 Google Scholar
F. Merola et al.,
“Driving and analysis of micro-objects by digital holographic microscope in microfluidics,”
Opt. Lett., 36 3079
–3081
(2011). http://dx.doi.org/10.1364/OL.36.003079 Google Scholar
M. H. Jericho et al.,
“Quantitative phase and refractive index measurements with point-source digital in-line holographic microscopy,”
Appl. Opt., 51 1503
–1515
(2012). http://dx.doi.org/10.1364/AO.51.001503 Google Scholar
C. Amaratunga et al.,
“Chloroquine remains effective for treating Plasmodium vivax malaria in pursat province, western Cambodia,”
Antimicrob. Agents Chemother., 58 6270
–6272
(2014). http://dx.doi.org/10.1128/AAC.03026-14 Google Scholar
L. L. Yuan et al.,
“Therapeutic responses of Plasmodium vivax malaria to chloroquine and primaquine treatment in northeastern Myanmar,”
Antimicrob. Agents Chemother., 59 1230
–1235
(2015). http://dx.doi.org/10.1128/AAC.04270-14 Google Scholar
A. E. Frosch et al.,
“Return of widespread chloroquine-sensitive Plasmodium falciparum to Malawi,”
J. Infect. Dis., 210 1110
–1114
(2014). http://dx.doi.org/10.1093/infdis/jiu216 Google Scholar
N. W. Lucchi et al.,
“In vitro and molecular surveillance for antimalarial drug resistance in Plasmodium falciparum parasites in western Kenya reveals sustained artemisinin sensitivity and increased chloroquine sensitivity,”
Antimicrob. Agents Chemother., 01894
(2015). Google Scholar
S. Pelleau et al.,
“Adaptive evolution of malaria parasites in French Guiana: Reversal of chloroquine resistance by acquisition of a mutation in pfcrt,”
Proc. Natl. Acad. Sci. U. S. A., 112 11672
–11677
(2015). http://dx.doi.org/10.1073/pnas.1507142112 Google Scholar
R. Zhang et al.,
“Therapeutic disruption of Plasmodium vivax infected red cell deformability,”
Malaria J., 13 1
(2014). http://dx.doi.org/10.1186/1475-2875-13-1 Google Scholar
S. Huang et al.,
“Dynamic deformability of Plasmodium falciparum-infected erythrocytes exposed to artesunate in vitro,”
Integr. Biol., 5 414
–422
(2013). http://dx.doi.org/10.1039/C2IB20161E Google Scholar
H. Leonhardt and H.-G. Grigoleit,
“Effects of pentoxifylline on red blood cell deformability and blood viscosity under hyperosmolar conditions,”
Naunyn Schmiedebergs Arch. Pharmacol., 299 197
–200
(1977). http://dx.doi.org/10.1007/BF00498562 Google Scholar
C. J. F. Fontes and S. Munhoz,
“Severe falciparum malaria with hyperparasitaemia: Management without exchange blood transfusion,”
Trop. Med. Int. Health, 1 820
–823
(1996). http://dx.doi.org/10.1111/j.1365-3156.1996.tb00117.x Google Scholar
K. Chotivanich et al.,
“Parasite multiplication potential and the severity of Falciparum malaria,”
J. Inf. Dis., 181 1206
–1209
(2000). http://dx.doi.org/10.1086/315353 Google Scholar
B. Carme and M. Demar,
“Hyperparasitaemia during bouts of malaria in French Guiana,”
Malaria J., 12 20
(2013). http://dx.doi.org/10.1186/1475-2875-12-20 Google Scholar
R. D. M. Netto et al.,
“Influence of Plasmodium vivax malaria on the relations between the osmotic stability of human erythrocyte membrane and hematological and biochemical variables,”
Parasitol. Res., 113 863
–874
(2014). http://dx.doi.org/10.1007/s00436-013-3717-4 Google Scholar
E. Sanchez-Ortiga et al.,
“Off-axis digital holographic microscopy: practical design parameters for operating at diffraction limit,”
Appl. Opt., 53 2058
–2066
(2014). http://dx.doi.org/10.1364/AO.53.002058 Google Scholar
K. W. Seo et al.,
“Aberration compensation for objective phase curvature in phase holographic microscopy,”
Opt. Lett., 37 4976
–4978
(2012). http://dx.doi.org/10.1364/OL.37.004976 Google Scholar
A. Kreidenweiss, P. G. Kremsner and B. Mordmuller,
“Comprehensive study of proteasome inhibitors against Plasmodium falciparum laboratory strains and field isolates from Gabon,”
Malaria J., 7 187
(2008). http://dx.doi.org/10.1186/1475-2875-7-187 Google Scholar
S. G. Valderramos et al.,
“Identification of a mutant PfCRT-mediated chloroquine tolerance phenotype in Plasmodium falciparum,”
Plos Pathog., 6 e1000887
(2010). http://dx.doi.org/10.1371/journal.ppat.1000887 1553-7374 Google Scholar
J. C. M. Lee and D. E. Discher,
“Deformation-enhanced fluctuations in the red cell skeleton with theoretical relations to elasticity, connectivity, and spectrin unfolding,”
Biophys. J., 81 3178
–3192
(2001). http://dx.doi.org/10.1016/S0006-3495(01)75954-1 Google Scholar
A. F. Slater,
“Chloroquine: mechanism of drug action and resistance in Plasmodium falciparum,”
Pharmacol. Ther., 57 203
–235
(1993). http://dx.doi.org/10.1016/0163-7258(93)90056-J Google Scholar
M. Cabrera et al.,
“Reduced digestive vacuolar accumulation of chloroquine is not linked to resistance to chloroquine toxicity,”
Biochemistry, 48 11152
–11154
(2009). http://dx.doi.org/10.1021/bi901765v Google Scholar
N. Wei and S. M. Sadrzadeh,
“Enhancement of hemin-induced membrane damage by artemisinin,”
Biochem. Pharmacol., 48 737
–741
(1994). http://dx.doi.org/10.1016/0006-2952(94)90102-3 Google Scholar
|