|
|
|
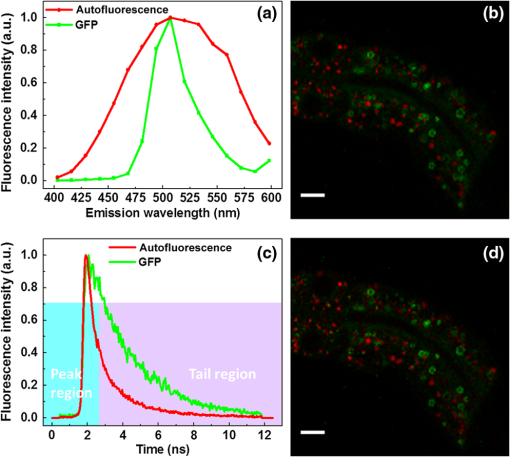
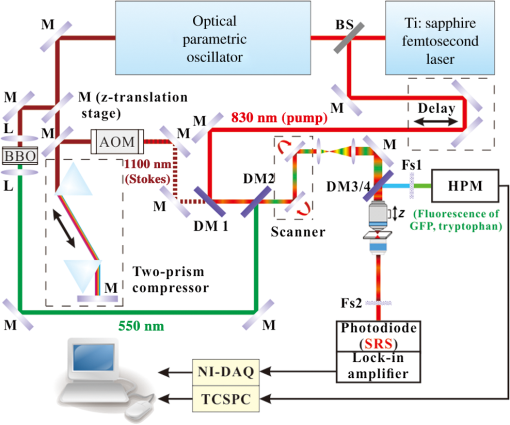
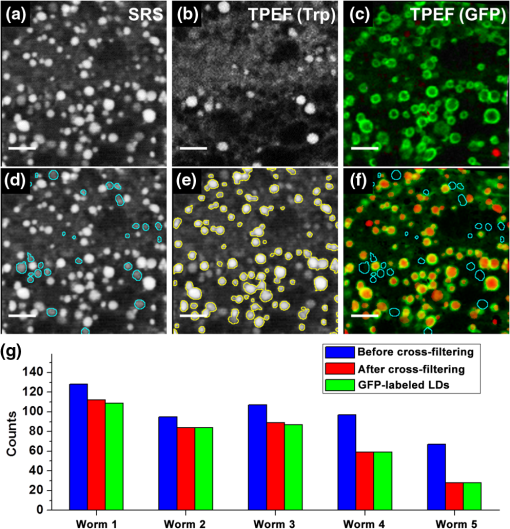
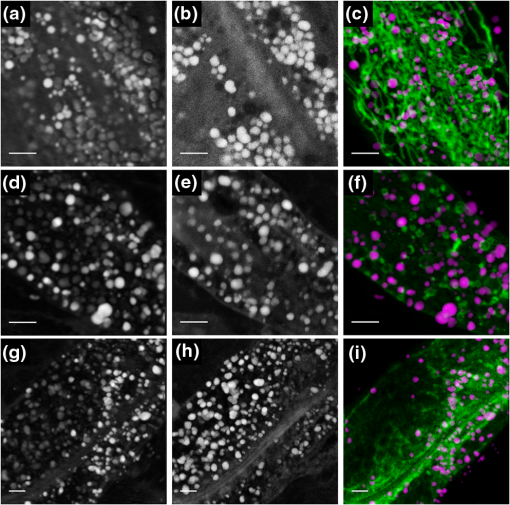
Lipid droplets (LDs) are highly conserved organelles where fat storage and metabolism are regulated. Quantitative measurement of LDs’ distribution and content is critical for understanding how cellular fat storage is regulated under physiological and pathological conditions, including obesity and related metabolic diseases, such as type 2 diabetes, hypertension, and cardiovascular diseases.1,2 Coherent Raman scattering microscopy has been demonstrated as a powerful label-free method for quantitative imaging of subcellular lipid and vesicular structures based on the vibration of carbon-hydrogen (C─H) bonds.3 Specifically, stimulated Raman scattering (SRS) microscopy provides a straightforward way to quantitatively interpret the optical signal because it is free from nonresonant background and nonlinear concentration dependence.4 A typical picosecond (ps) SRS takes advantage of the narrow bandwidth () to achieve high spectral resolution of specific molecules. More recently, a chirped or spectrally tailored broadband femtosecond (fs) laser, essentially equivalent to a ps laser, has also been demonstrated to achieve spectral imaging and detect multiple components.5–8 However, ps sources, with their relatively low peak power, are less suitable than fs sources for multimodal nonlinear optical (NLO) imaging. This is because the efficiency of the two-photon excitation process is inversely proportional to the excitation pulse duration.9 The ps sources are less efficient in exciting the commonly used NLO signals, such as two-photon excited fluorescence (TPEF) and second harmonic generation. Despite the increasing popularity of SRS for label-free and quantitative lipid imaging, systems based on fs excitation suffer from the detection of false positive signals from protein interference due to poor spectral resolution of the fs sources.10 This confounds the use of fs SRS as an optical method for accurate measurements of lipids in living biological systems though it is a more desirable excitation source for multimodal NLO imaging. In this study, we developed a unique fs NLO microscope system for characterizing LDs at the subcellular level in C. elegans. The system can sequentially excite and probe the SRS signals from the stretching vibrations for lipids/proteins and the TPEF signals of tryptophan and fluorescent proteins, respectively. The cross-filtering of label-free signals from the multimodal system allowed precise identification of LDs. The accuracy of LD identification is further validated by colocalization of the LD marker short-chain dehydrogenase (DHS-3)::green fluorescent protein (GFP). Using the single-copy transgene technology, we generated a transgenic C. elegans strain that expressed a DHS-3::GFP fusion protein in the intestine at physiological levels.11 DHS-3 was originally identified from proteomic studies as one of the most abundant LD associated proteins in C. elegans.12 All C. elegans strains were cultured on nematode growth media plates seeded with OP50 Escherichia coli at 20°C. Worms were paralyzed in 0.2 mM levamisole prior to mounting on microscope slides immediately before SRS and TPEF imaging. We first conducted time- and spectral-resolved measurements of emissions from GFP and autofluorescent entities in lysosome-related organelles (LROs). The two-photon microscope was described in the previous study.13 Briefly, the standard TPEF microscope was equipped with a spectrograph and a multichannel time-correlated single photon counting (TCSPC) module (PML-16-C-0 and SPC-150, Becker & Hickl GmbH). The detection system provided the capability of time- and spectral-resolved measurements at each pixel of a TPEF image from 400 to 600 nm. Throughout this study, we used one-day-old adult C. elegans for imaging. As shown in Figs. 1(a) and 1(c), the long-lifetime GFP of C. elegans peaks at , while the short-lifetime autofluorescence covers a wide range from 450 to 600 nm. The lifetime of GFP and autofluorescence calculated from a dual exponential decay model was 2610 and 970 ps, respectively, indicating that the two fluorescence signals can be well separated in the time domain. In Fig. 1(b), the TPEF signals of each pixel in the wavelength region from 490 to 540 nm, dominated by GFP, were displayed in green, whereas the signals in the regions from 400 to 490 nm and 540 to 600 nm, dominated by the autofluorescence of LROs, were presented in red. In Fig. 1(d), we used a simple nonfitting method based on the ratio of the fluorescence signals in the peak region and the tail region shown in Fig. 1(c) to differentiate the GFP signal and the autofluorescence.14 As can be seen, both time- and spectral-resolved imaging methods yielded identically accurate separation of GFP signals from LROs. In the following study, genuine signals derived from GFP labeled LDs will serve as the reference for assigning the subcellular origins of SRS signals. It should be emphasized that the GFP signals, localized exclusively on the LD surface, can only be used to identify LDs, but not detect the concentration of lipid in LDs. Fig. 1Two-photon excited fluorescence (TPEF) characteristics and images of GFP and autofluorescence [lysosome-related organelles (LROs)] at 830 nm excitation. (a) GFP and autofluorescence spectra, (b) color-coded TPEF spectral image of C. elegans (green: GFP; red: autofluorescence), (c) TPEF time-decays for GFP (lifetime ) and autofluorescence (lifetime ), and (d) color-coded TPEF lifetime image (green: GFP; red: autofluorescence). Scale bar: .  It has always been a challenge to distinguish between lipid and protein because their Raman spectra overlap in the and bonds region.15 Though spectral SRS imaging based on the tuning of narrowband ps excitation and the multivariate spectral analysis has enabled accurate measurements of different chemicals, these techniques cannot be directly adopted to a multimodal NLO microscope system based on broadband fs excitations that cover both and bonds. However, we previously demonstrated that the TPEF of tryptophan, an essential amino acid serving as one of the building blocks in many proteins, conveys the information on protein content.16 The TPEF of tryptophan can be efficiently excited by short-wavelength fs source and the signal can be potentially used as a filter to exclude the interfering protein-rich structures subsequent to fs SRS imaging of LDs. The schematic of the multimodal NLO microscope is shown in Fig. 2. Briefly, an fs Ti:sapphire laser with 80 MHz repetition rate (Chameleon Ultra II, Coherent, Inc.) was tuned at 830 nm. Twenty percent of its output was used as the pump beam for SRS and the excitation for TPEF signals of GFP and LROs, respectively. The rest of the output was used to pump an optical parametric oscillator (OPO) (Chameleon OPO, Coherent, Inc.) to generate 1100 nm as the Stokes beam for SRS. The frequency difference between 830 nm (pump) and 1100 nm (Stokes) matches the center of the bond at of lipids and proteins.5 The spectral widths of pump and Stokes beams are 8 and 13 nm, respectively, significantly broader than the spectral separation between lipid and protein.6 We found that spectral imaging could not resolve the lipids and proteins by tuning the laser wavelength as in ps SRS systems.5–8 A pair of prisms introduced precompensation of dispersion to the Stokes beam before passing through a 10.7 MHz acousto-optic modulator (AOMO 3080-122, Crystal Technology). When exciting the TPEF signal of tryptophan, a mirror was inserted to reflect the Stokes beam to a beta barium borate crystal and generate an fs short-wavelength excitation. The excitation beams were combined by dichroic mirrors (DM1: 900DCXR and DM2: 710DCXR, Chroma) and scanned laterally by a pair of galvo mirrors (6210H, Cambridge Technology). A water immersion objective (UAPO40XW3/340, 1.15 NA, Olympus) was driven by an actuator (Z625B, Thorlabs) to achieve the axial scanning. The backward-scattered TPEF signals of GFP, LROs, and tryptophan were recorded by a single channel hybrid detector and TCSPC module (HPM-100-40 and SPC-150, Becker & Hickl GmbH). Two sets of dichroic mirrors and bandpass filters (DM3/4 and Fs1: FF665-Di02, Semrock and ET510/30m, Chroma; FF510-Di01 and FF01-357/44, Semrock) were interchangeable by driving a pair of motorized filter flippers (MFF101/M, Thorlabs) for the measurements of TPEF signals excited at 830 and 550 nm sequentially. At 830 nm excitation, the TPEF signals of GFP and LROs were recorded simultaneously and separated in the time-domain as described previously based on their lifetime difference. Signals derived from tryptophan containing proteins were obtained at 550 nm excitation. In the forward detection, both of the pump and Stokes beams were collected by a condenser (U-AAC, Achromat/aplanat condenser, NA 1.4, Olympus). The pump beam was further selected by another pair of filters (Fs2: 64335 shortpass at 900 nm, Edmund and FF01-794/160, Semrock) and recorded by a photodiode (FDS 100, Thorlabs). The SRS signal was demodulated by a high-frequency lock-in amplifier (SR844, Stanford Research Systems). The excitation powers of 550, 830, and 1100 nm beams at samples were , 6.9, and 10.6 mW, respectively. The image acquisition time was 4 s for each of the three images. Fig. 2Schematic of multimodal nonlinear optical (NLO) microscope. L, lens; M, mirror; BS, beam splitter; DM, dichroic mirror; BBO, beta barium borate crystal; AOM, acousto-optic modulator; SP, short pass filter; Fs, filter set; TCSPC, time-correlated single photon counting; HPM, high-speed hybrid detector for TCSPC.  To improve the veracity of LDs’ detection using fs SRS, we examined one-day-old adult transgenic C. elegans that expressed the lipid droplet marker DHS-3::GFP. The representative raw SRS image of aliphatic C–H bonds, raw TPEF image of tryptophan, and color-coded TPEF lifetime image of GFP/LROs acquired at the same site are shown in Figs. 3(a)–3(c), respectively. All raw images were sequentially acquired from a small area of () to ensure high-quality detection of LDs with minimal dwell time. The fs SRS provides information of both lipids and proteins, while the tryptophan fluorescence is derived exclusively from proteins. Therefore, we used the tryptophan fluorescence as a label-free filter to decompose the SRS signals into lipid and protein components. Finally, the filtering accuracy was validated by the GFP signals, which were localized exclusively on the LD surface. The processed images after the decomposition of protein-rich vesicles and LDs are shown in Figs. 3(d) and 3(e), respectively. A standard MATLAB®-based blob detection code was used to identify the vesicular structures in the figures. The false positive signals arising from protein-rich vesicles were subtracted in Fig. 3(e). The TPEF image of GFP labeled LDs is shown in Fig. 3(c), in which the signal of LROs with a short lifetime was coded in red and excluded from the GFP labeled LDs. Figure 3(f) is the merged image of Figs. 3(c)–3(e). As can be seen, the overwhelming majority of LD-like structures in the SRS image overlap with the GFP labeled LDs after filtering of tryptophan TPEF signals. More detailed results based on measurements of 20 SRS and TPEF images from five animals are displayed in Fig. 3(g). Statistically, we found that the colocalization of raw SRS with LD associated GFP signals was only . However, after applying the tryptophan fluorescence filtering, the colocalization was improved to . This result demonstrates that the false positive features in fs SRS can be effectively eliminated by the cross-filtering technique. It has been reported that the protein droplets largely coincide with LROs and other lysosomal compartments for the breakdown of unwanted polypeptide and lipid species and for protein degradation.17,18 Therefore, lysosomes should have a relatively high level of tryptophan and SRS signals. Fig. 3Representative multimodal NLO images of hjSi224 C. elegans. (a) Raw stimulated Raman scattering (SRS) image of lipid droplets (LDs) and protein, (b) raw TPEF image of tryptophan, (c) color-coded TPEF lifetime image (green: GFP; red: autofluorescence), (d) SRS image of protein-rich vesicles (false LDs) localized by tryptophan signals, (e) SRS image after false LDs subtraction, (f) merged image (GFP and SRS signals of LDs are colored in green and red, respectively; false LDs are circled in cyan), and (g) the counts of the LD-like structures in SRS images before and after filtering. Scale bar: .  To demonstrate the multimodal imaging capability, we extended the use of our integrated fs SRS and two-photon fluorescence microscope system for sequential imaging of subcellular lipid structures and lipid metabolism related organelles based on SRS and TPEF signals, respectively. We chose transgenic C. elegans animals in which mitochondria, lysosomes, or the endoplasmic reticulum (ER) was labeled with fluorescent proteins for the study. This was because physical contacts between lipid droplets and the ER and mitochondria are important for the storage and utilization of cellular fat content, respectively.19,20 In addition, mobilized fatty acids may in part be channeled to the LRO, which links aging and metabolic activity.21 The representative results are shown in Fig. 4. The tryptophan TPEF images were used to identify the false positive structures in the SRS images. The cross-filtered LD signals were then merged with the TPEF images of subcellular organelles labeled with fluorescent proteins. Our results clearly demonstrate that the multimodal SRS and TPEF microscope can not only image the LDs with the critical information on their fat content, but also reveal their engagement with different subcellular organelles. It should be emphasized that with a Ti:sapphire laser of 140 fs pulse duration used in this study, the excitation power for the TPEF imaging of fluorescent protein labeled organelles was always . The excitation efficiency is about a factor of 40 higher than the sources of 5 to 7 ps pulse duration that were commonly used for ps SRS imaging.3,4,9,15 Therefore, the fs system may cause significantly less photodamage to biological samples. Fig. 4Multimodal NLO images of C. elegans. (a) and (b) Raw SRS and tryptophan TPEF images of transgenic C. elegans expressing GFP targeted to mitochondria, (c) merged image (TPEF signals of mitochondria and cross-filtered SRS signals of LDs are colored in green and magenta, respectively), (d) and (e) raw SRS and tryptophan TPEF images of transgenic C. elegans expressing GFP targeted to LROs, (f) merged image (TPEF signals of lysosomes and cross-filtered SRS signals of LDs are colored in green and magenta, respectively), (g) and (h) raw SRS and tryptophan TPEF images of transgenic C. elegans expressing red fluorescent protein targeted to the endoplasmic reticulum (ER), and (i) merged image (TPEF signals of ER and cross-filtered SRS signals of LDs are colored in green and magenta, respectively). Scale bar: .  In summary, our fs NLO microscope system is capable of highly specific assignment of LDs by cross-filtering signals from multiple imaging modalities. We showed that false positive signals of SRS are derived from a partially overlapping set of structures which are rich in protein entities. We demonstrated that the multimodal imaging system can sequentially produce quantitative SRS image of lipid structures and the TPEF images of important organelles related to lipid metabolism. Finally, it should be pointed out that the cross-filtering technique may eliminate genuine LDs whose size falls under the diffraction limit. This is because tryptophan signals from proteins on the LD surface will not be optically separated from SRS signals that originate from the lipid core of LDs. Such a concurrence of tryptophan and SRS signals will cause the misassignment of small LDs. In addition, the technique cannot identify protein droplets that do not contain tryptophan. AcknowledgmentsThis work was supported by the Hong Kong Research Grants Council through grants 662513, 662711, 662013, 16103215, N_HKUST631/11, T13-607/12R, and T13-706/11-1, AOE/M-09/12, and Hong Kong University of Science & Technology through grant RPC10EG33 and IGN12SC04. We thank Ningyi Xu for generating hjSi224. ReferencesB. M. Spiegelman and J. S. Flier,
“Obesity and the regulation of energy balance,”
Cell, 104 531
–543
(2001). http://dx.doi.org/10.1016/S0092-8674(01)00240-9 CELLB5 0092-8674 Google Scholar
T. C. Walther and Jr. R. V. Farese,
“Lipid droplets and cellular lipid metabolism,”
Annu. Rev. Biochem., 81 687
–714
(2012). http://dx.doi.org/10.1146/annurev-biochem-061009-102430 ARBOAW 0066-4154 Google Scholar
J. Cheng and X. S. Xie, Coherent Raman Scattering Microscopy, Taylor & Francis, New York
(2012). Google Scholar
C. W. Freudiger et al.,
“Label-free biomedical imaging with high sensitivity by stimulated Raman scattering microscopy,”
Science, 322 1857
–1861
(2008). http://dx.doi.org/10.1126/science.1165758 Google Scholar
Y. Ozeki et al.,
“High-speed molecular spectral imaging of tissue with stimulated Raman scattering,”
Nat. Photonics, 6 845
–851
(2012). http://dx.doi.org/10.1038/nphoton.2012.263 Google Scholar
D. Zhang et al.,
“Quantitative vibrational imaging by hyperspectral stimulated Raman scattering microscopy and multivariate curve resolution analysis,”
Anal. Chem., 85 98
–106
(2013). http://dx.doi.org/10.1021/ac3019119 ANCHAM 0003-2700 Google Scholar
D. Fu et al.,
“Imaging the intracellular distribution of tyrosine kinase inhibitors in living cells with quantitative hyperspectral stimulated Raman scattering,”
Nat. Chem., 6 614
–622
(2014). http://dx.doi.org/10.1038/nchem.1961 NCAHBB 1755-4330 Google Scholar
D. Zhang et al.,
“Fast vibrational imaging of single cells and tissues by stimulated Raman scattering microscopy,”
Acc. Chem. Res., 47 2282
–2290
(2014). http://dx.doi.org/10.1021/ar400331q ACHRE4 0001-4842 Google Scholar
W. R. Zipfel, R. M. Williams and W. W. Webb,
“Nonlinear magic: multiphoton microscopy in the biosciences,”
Nat. Biotechnol., 21 1369
–1377
(2003). http://dx.doi.org/10.1038/nbt899 NABIF9 1087-0156 Google Scholar
D. Zhang, M. N. Slipchenko and J. Cheng,
“Highly sensitive vibrational imaging by femtosecond pulse stimulated Raman loss,”
J. Phys. Chem. Lett., 2 1248
–1253
(2011). http://dx.doi.org/10.1021/jz200516n Google Scholar
C. Frøkjær-Jensen et al.,
“Single-copy insertion of transgenes in Caenorhabditis elegans,”
Nat. Genet., 40 1375
–1383
(2008). http://dx.doi.org/10.1038/ng.248 NGENEC 1061-4036 Google Scholar
P. Zhang et al.,
“Proteomic study and marker protein identification of Caenorhabditis elegans lipid droplets,”
Mol. Cell. Proteomics, 11 317
–328
(2012). http://dx.doi.org/10.1074/mcp.M111.016345 Google Scholar
W. Zheng et al.,
“Two-photon excited hemoglobin fluorescence,”
Biomed. Opt. Express, 2 71
–79
(2011). http://dx.doi.org/10.1364/BOE.2.000071 BOEICL 2156-7085 Google Scholar
D. Li et al.,
“Two-photon excited hemoglobin fluorescence provides contrast mechanism for label-free imaging of microvasculature in vivo,”
Opt. Lett., 36 834
–836
(2011). http://dx.doi.org/10.1364/OL.36.000834 OPLEDP 0146-9592 Google Scholar
C. W. Freudiger et al.,
“Highly specific label-free molecular imaging with spectrally tailored excitation-stimulated Raman scattering (STE-SRS) microscopy,”
Nat. Photonics, 5 103
–109
(2011). http://dx.doi.org/10.1038/nphoton.2010.294 NPAHBY 1749-4885 Google Scholar
D. Li, W. Zheng and J. Y. Qu,
“Two-photon autofluorescence microscopy of multicolor excitation,”
Opt. Lett., 34 202
–204
(2009). http://dx.doi.org/10.1364/OL.34.000202 OPLEDP 0146-9592 Google Scholar
W. L. Miller and H. S. Bose,
“Early steps in steroidogenesis: intracellular cholesterol trafficking,”
J. Lipid Res., 52 2111
–2135
(2011). http://dx.doi.org/10.1194/jlr.R016675 JLPRAW 0022-2275 Google Scholar
C. Settembre et al.,
“Signals from the lysosome: a control centre for cellular clearance and energy metabolism,”
Nat. Rev. Mol. Cell Biol., 14 283
–296
(2013). http://dx.doi.org/10.1038/nrm3565 NRMCBP 1471-0072 Google Scholar
N. Xu et al.,
“The FATP1-DGAT2 complex facilitates lipid droplet expansion at the ER-lipid droplet interface,”
J. Cell Biol., 198 895
–911
(2012). http://dx.doi.org/10.1083/jcb.201201139 JCLBA3 0021-9525 Google Scholar
J. Yu et al.,
“Lipid droplet remodeling and interaction with mitochondria in mouse brown adipose tissue during cold treatment,”
Biochim. Biophys. Acta, 1853 918
–928
(2015). http://dx.doi.org/10.1016/j.bbamcr.2015.01.020 Google Scholar
A. Berdichevsky et al.,
“3-Ketoacyl thiolase delays aging of Caenorhabditis elegans and is required for lifespan extension mediated by sir-2.1,”
Proc. Natl. Acad. Sci. U. S. A., 107 18927
–18932
(2010). http://dx.doi.org/10.1073/pnas.1013854107 Google Scholar
|

