|
|
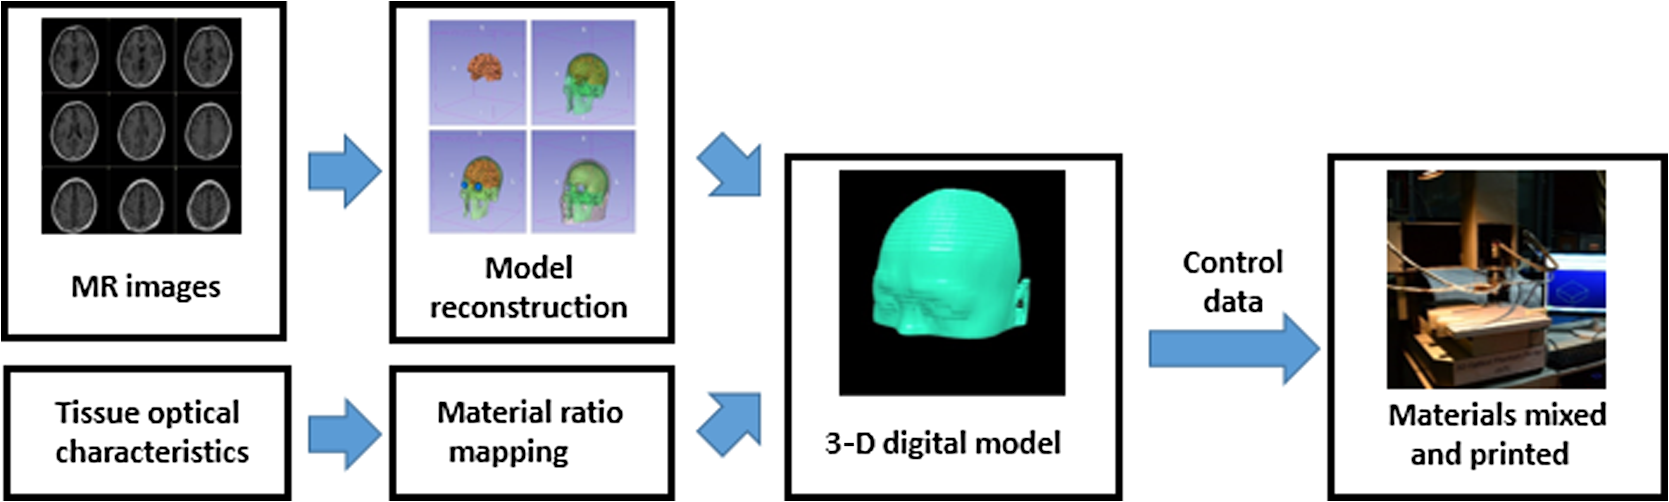
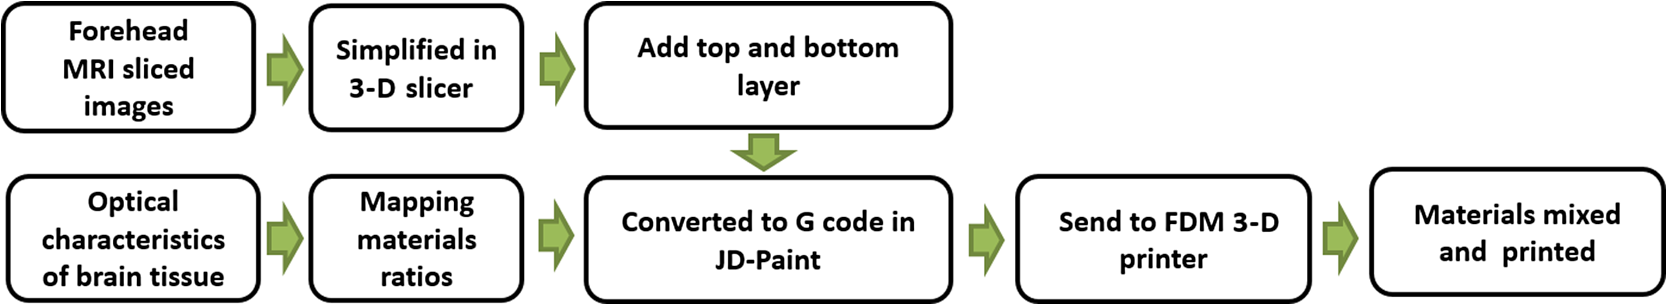
1.IntroductionBiological optical imaging technique has the capability of detecting biological structure, function, and molecular characteristics in real-time based on the photon interactions with biological tissue. In the wavelength range from ultraviolet to infrared, the primary absorption components in biological tissue include water, hemoglobin, blood sugar, pigment, and lipid; while the primary scattering components include protein, fat, and mitochondria.1,2 It has been shown that optical phantoms are able to simulate important optical parameters of biological tissues, such as refractive index, absorption coefficient, scattering coefficient, and anisotropy.3 A typical optical phantom is composed of the base, the scattering, and the absorption materials. On some occasions, fluorophores and other contrast enhancement agents are also added in the phantoms.4 Optical phantoms have been developed and widely used in various clinical applications, such as medical device calibration, validation, and clinical education. One example is to use brain-simulating phantoms to simulate brain structural and physiological properties to calibrate spectrophotometric devices for brain functional studies.5,6 Existing optical phantoms are based on homogenous materials without considering the multilayered heterogeneous structures observed in biological tissue. Optical measurements calibrated by such a phantom may have limited accuracy and traceability. To simulate actual tissue conditions, multilayered phantoms have been fabricated recently using various methods, such as multilayered curing,7 integration after mold casting,8 and spin coating.9 However, these methods have their own limitations and can hardly simulate both structure and optical heterogeneities observed in various biological tissue types.10,11 For example, multilayered curing and mold casting methods are able to produce large phantoms, but can hardly simulate tissue structural heterogeneity. Spin coating method is able to produce thin phantoms that simulate human skin, but cannot simulate large tissues with embedded anomalies. Since these phantoms cannot effectively simulate tissue heterogeneity, using them to calibrate spectral optical devices may not improve the measurement reliability in biologic tissue. In recent years, three-dimensional (3-D) printing has been used broadly in biomanufacturing applications.12–14 It is a material additive process that converts digital information into a 3-D object by adding solid material layer-by-layer. In comparison with conventional manufacturing processes, 3-D printing has multiple advantages, such as a short production cycle and freeform fabrication of objects with complex geometric characteristics and internal structures.15 It is suitable for fabricating tissue-simulating phantoms for various biomedical and clinical applications, such as curvature correction in spatial frequency domain imaging, cardiovascular surgical training, and imaging performance validation.15–18 Despite these advances, it is still very challenging to produce optical phantoms that simulate both optical and morphologic heterogeneities of real biologic tissue, such as brain tissue.19 We have developed a fuse deposition modeling (FDM) system for 3-D printing of tissue-simulating phantoms with multilayered heterogeneous structure. The system consists of a heated printer head that mixes the absorption and the scattering materials at different ratios and a motion module that precisely piles up the mixture layer-by-layer. The materials’ systems used in our FDM device are the gel wax mixtures of different scattering and absorption ingredients. To evaluate the accuracy for simulating tissue optical properties, we use a commercial oximeter (OxiplexTS, ISS Inc., Champaign, Illinois) to characterize the optical properties of the multilayered phantom and compare the results with those of a Monte Carlo simulation.20 To demonstrate the clinical utility of simulating heterogeneous tissue structure, we process the clinical magnetic resonance (MR) images of a human brain and printed multiple sections with the FDM system. Our experiment results demonstrate the technical feasibility of using the FDM technique for freeform fabrication of phantoms that simulate tissue structural and optical heterogeneities. Such a tissue-simulating phantom may be used for calibrating spectral optical medical devices, coregistration between different imaging modalities, and validating new optical imaging techniques. 2.Materials and Methods2.1.Materials2.1.1.Phantom material selectionThe material system for the proposed FDM technique consists of a mixture of the base ingredient, the absorption ingredient, and the scattering ingredient. The selection of these phantom materials should consider the following requirements: (1) the absorption characteristics of the phantom should be finely tunable within the range of biologic tissue without affecting the scattering characteristics, (2) the scattering characteristics of the phantom should be finely tunable within the range of biologic tissue without affecting the absorption characteristics, (3) the base component should be transparent and present minimal interferences to the overall absorption and scattering characteristics of the printed phantom, and (4) the physical dimensions, the chemical properties, and the optical characteristics of the fabricated phantom should be stable for a relatively long shelf life. Gel wax, with a density of , a melting point of 68°C, and a refractive index of 1.469 (Shanghai Joule Wax Industry, China), is used as the base material. Gel wax is used because of the following reasons: (1) it is stable, colorless, transparent, and easily available, (2) various absorption and scattering ingredients can be uniformly dispersed in gel wax to reach the designated optical properties, (3) since the gel wax phantom fabrication process does not involve any chemical reactions, the produced phantoms have relatively stable properties, and (4) in comparison with other materials, gel wax has a relatively low-thermal expansion coefficient (), enabling phantom fabrication with geometric fidelity. The designated optical properties of the printed phantom, such as the absorption coefficient and the scattering coefficient , can be achieved by mixing the based material, the absorption material, and the scattering material at a specific mixing ratio as shown by the following equations where is the volume of the base material, is the mass of the absorption material, is the mass of the scattering material, is the flow speed of the pure transparent synthetic wax, is the flow speed of the prior preparation synthetic wax containing high concentrations of absorption material, is the flow speed of the prior preparation synthetic wax containing a high concentration of scattering material, is the content ratio of the absorption material of , is the content ratio of the scattering material of , and is the feature constant of the print-head.2.1.2.Absorption material characterizationThe overall absorption of the phantom can be estimated by Beer–Lambert’s law where is the initial light intensity incident to the medium, is the measured transmitted light intensity, is the length of the absorption medium, is the concentration of the absorbent material, is the molar absorptivity, is the overall absorption, and is the absorption coefficient.For multiple absorption materials dispersed in a transparent medium, the overall absorption coefficient of the phantom can be represented as the weighted summation of individual absorption ingredients, assuming no interference between these ingredients: where are the extinction coefficients of individual absorption ingredients and are the material concentrations.Experimentally, the graphite powder material with a particle size of 8000 mesh and a purity of 99.95% (Shanghai Jingchun Biochemical Technologies, China) is used as the absorption ingredient. The absorption spectra of the graphite phantoms at different concentrations are tested by a UV/VIS spectrophotometer (Shimadzu, Japan). The tests are triplicated, and the standard deviations are calculated. As shown in Fig. 1, the absorption coefficient levels are linearly proportional to the graphite powder concentration levels, with a linear correlation coefficient of 0.997. 2.1.3.Scattering material characterizationThe scattering coefficient of the phantom is defined as the production of the number of the scattering particles dispersed in unit volume and the averaged scattering cross-section of the particles Similarly, for multiple scattering ingredients dispersed in a transparent medium, the overall scattering coefficient can be expressed as the linear superimposition of individual scattering ingredients, assuming no interference between these ingredients: Experimentally, the titanium dioxide () powder material (Guangfu Fine Chemical Research Institute, China) is used as the scattering ingredient. Slab phantoms at five different levels of powder concentrations are cast. Considering that precipitation and aggregation of powder may induce scattering heterogeneity in the phantom, we measure the bulk reduced scattering coefficient at six locations on the top surface and six locations on the bottom surface of the phantom, respectively, using the OxiplexTS™ tissue spectrophotometer. To reduce the systemic error, one maximal and one minimal measurement on each surface are excluded and the remaining eight data points are averaged to represent the averaged scattering properties of the phantom. The measured reduced scattering coefficient correlates with the scattering coefficient by the following equation: where is the anisotropy factor. Figure 2 shows the bulk reduced scattering coefficient of the phantoms at different powder concentrations. According to the figure, the reduced scattering coefficient is linearly correlated with the powder concentration, with a linear correlation coefficient of 0.994.2.1.4.Mixed material characterizationPhantoms that mix graphite powder and powder at different ratios are fabricated. Optical properties of these phantoms are measured to determine if crosstalk exists between the absorption and the reduced scattering ingredients. In the first set of experiments, the graphite powder concentration is increased gradually while the powder concentration is kept at . In the second set of experiments, the powder concentration is increased gradually while the graphite powder concentration is kept at . For each combination of graphite and concentrations, scattering and absorption properties are measured at six locations on the phantom to calculate the averaged optical characteristics and their deviations as shown in Fig. 3. Fig. 3Interference between the scattering and the absorption properties as different material components are added in the phantom: (a) the scattering coefficient of the phantom does not change significantly as the concentration of the graphite powder increases gradually while the powder concentration remains at ; () the absorption coefficient of the phantom does not change significantly as the concentration of the powder increases gradually while the graphite powder concentration remains at . 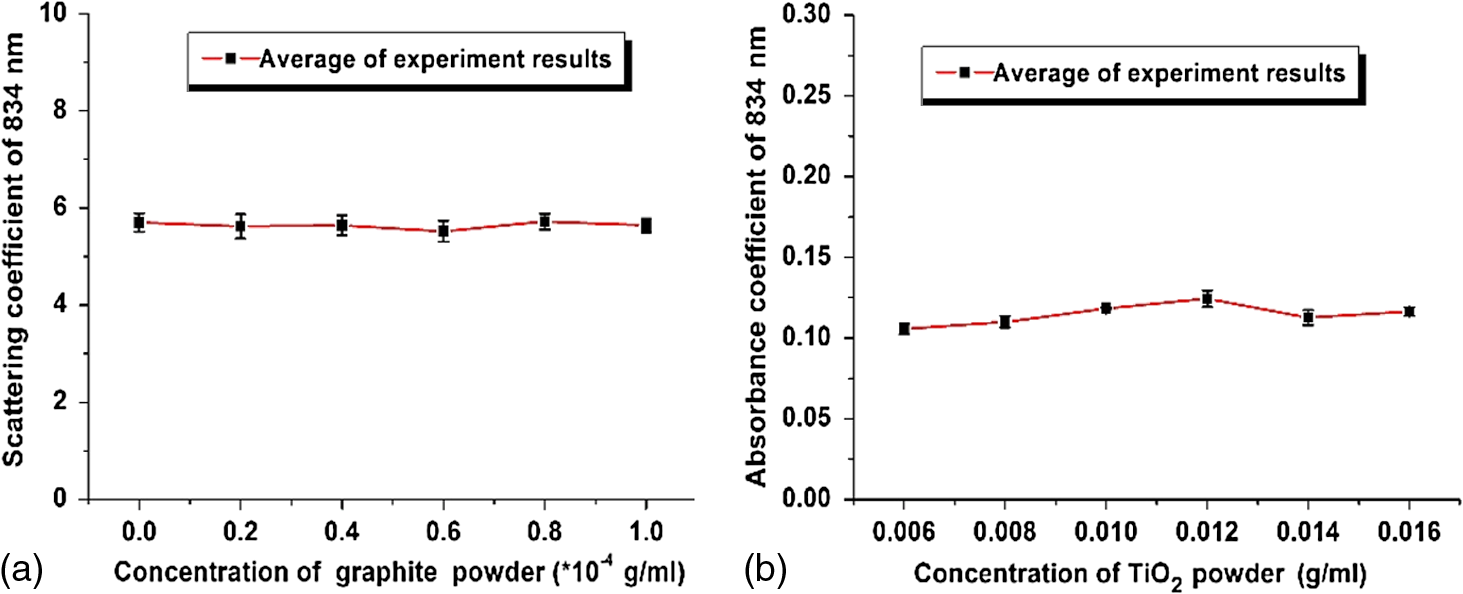 According to the figure, the reduced scattering coefficients remain at as the graphite powder concentration continuously increases, whereas the absorption coefficients remain at as the powder concentration continuously increases. Therefore, it is concluded that the crosstalk between the scattering and the absorption ingredients used in our phantom FDM system is negligible. To improve the mixing accuracy in the FDM process, an absorption stock is prepared in advance by melting the transparent gel wax, mixing with the graphite powder at a designated concentration, degassing in a vacuum chamber for 15 min, and cooling down. A scattering stock is also prepared following a similar protocol. The transparent gel wax, the absorption stock, and the scattering stock are fed into the FDM system for phantom printing. 2.2.Development of the Fuse Deposition Modeling System for Phantom PrintingOur phantom FDM system consists of a host computer for process control, a JD-208 3-D motion platform (Jingdiao Corp., Hefei, China), a heated print head with dynamic mixer, a material feeding system, and a model AI-7048 proportional-integral-derivative (PID) temperature controller (Yudian Corp., Xiamen, China) as shown in Fig. 4. The maximal working distances of the 3-D motion platform are 200, 200, and 100 mm in the , , and directions, respectively, with a localization accuracy of 0.01 mm and a maximum moving speed of . The PID temperature controller can control the temperature of the heating pipes and the mixing nozzle with a maximum heating temperature of 500°C and a control accuracy of 0.5°C. The model STM32f103 microcontroller (ST Microelectronics, Huntsville, Virginia) converts the computer control command to the process control signals for the printing materials that feed each of the model LSP01-2A microflow injection pumps (Longer Pump, Baoding, China). The control commands are sent from the computer to the 3-D motion platform, the PID temperature controller, and the material feeding system. Fig. 4(a) Schematic of the fuse deposition modeling (FDM) system for optical phantom fabrication. (b) Photographic illustration of the developed FDM system prototype.  The design of the print head is illustrated in detail by Fig. 5. It is based on melting and mixing three ingredient materials (i.e., absorption ingredient, scattering ingredient, and transparent base material) at the designated concentrations. The three stock materials are prepared in advance with optical properties characterized. They are supplied in different channels with the flow rate controlled by three precision injection pumps, respectively. The supplied materials with precise volume control are mixed in a heated mixing device driven by a transmission shaft and extruded through the nozzle at the designated concentration ratios. The print head is made of aluminum alloy and brass with superior thermal conductivity. It is well heated by a calefaction stick to keep the materials at the molten state. The total length of the print head is 45 mm, and the inner diameter of the nozzle tip is 0.4 mm. Fig. 5(a) Computer aided design of the dynamic mixing print head. (b) Close-up view of the print head prototype. 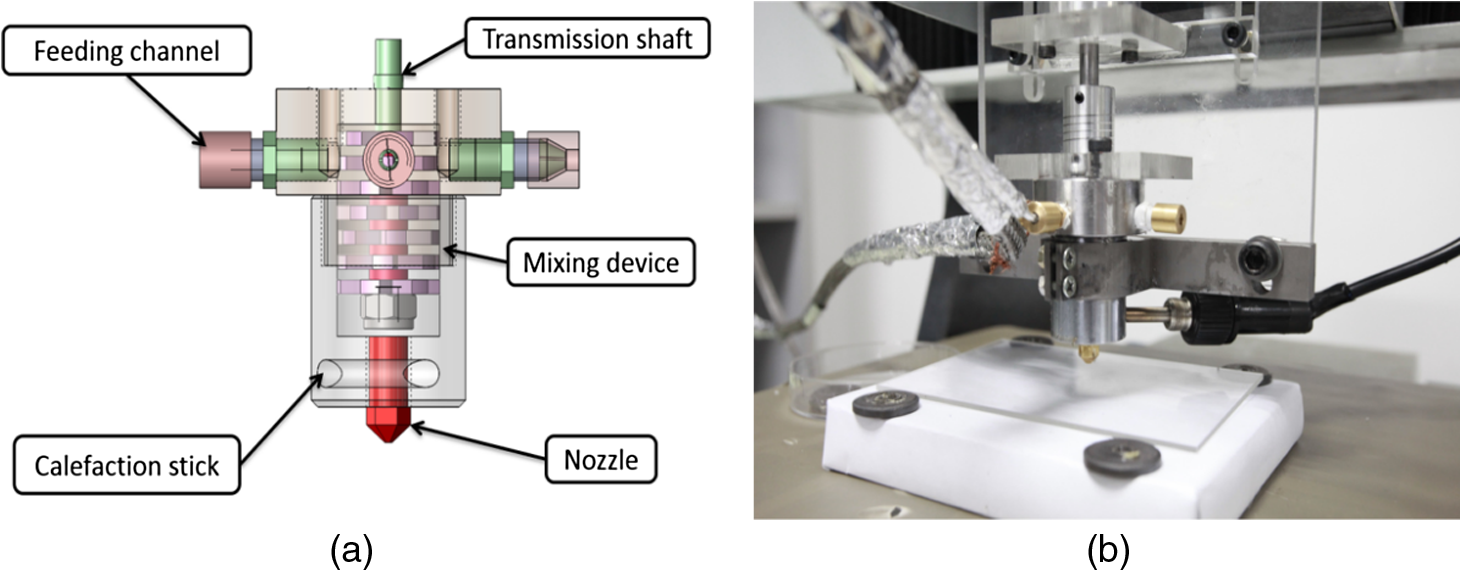 To evaluate whether heating and mixing procedures in an FDM process may affect the material optical properties of the produced phantoms, we prepare a sample phantom by mixing the absorption stock and the scattering stock with the base transparent gel wax to reach a graphite powder concentration of and a powder concentration of . After the above ingredients are melted, manually mixed, and cooled down, the resultant absorption coefficient is , and the scattering coefficient is , very well coincident with the linear correlations as shown in Figs. 1 and 2. However, after the same ingredient materials as above are mixed, melted, extruded by our FDM system, and cooled down, the resultant absorption coefficient of the phantom turns out to be , corresponding to a 38% increase in comparison with its original value. The resultant scattering coefficient of the phantom turns out to be , corresponding to a 34% increase in comparison with its original value. The FDM-induced increase of phantom absorption and scattering coefficients may be explained by several possible reasons, such as the introduction of air bubbles, the improved dispersion of graphite powder and powder in the phantom, and the refined particle sizes. Further study is needed to quantify the process-induced variation in optical properties and optimize the process control for reproducible and reliable production of the optical phantoms. 2.3.Fuse Deposition Modeling Fabrication of Three-Dimensional Tissue-Simulating Phantom3-D tissue-simulating phantoms were fabricated by the FDM process following two consecutive stages of modeling and printing as illustrated in Fig. 6. At the modeling stage, T1-weighted and 3-D magnetization-prepared fast spoiled gradient echo sequence images were acquired by a 3.0T Discovery MR750 system (General Electric Healthcare, Fairfield City, Connecticut) at an in-planar resolution of 0.7 mm and a slice thickness of 1 mm, interpolated into 0.5 mm. The MR images were imported into the 3-D-Slicer, an open source medical imaging tool, for a series of image processing procedures that involve denoising, segmentation, reconstruction, format conversion, and sectioning. After sectioning, each layer will be classified into different regions based on tissue anatomic characteristics. The sectioned images are then digitalized and assigned with different optical properties at individual pixels based on the published measurements for the corresponding tissue types. At the printing step, the digitalized tissue sections are loaded by the FDM system to plan for the motion path of the print head and the feeding rates of the phantom materials. These process plans are used to guide the FDM system to mix the molten ingredients at the designated ratios, extrude them, and deposit them layer-by-layer in the working area. By the end of the process, the printed phantom is cooled down completely and then removed from the FDM system. The morphologic and the optical properties of the produced phantoms are further evaluated by photographic imaging and spectrophotometry. 3.Results and DiscussionThe technical feasibility of the proposed FDM process for producing tissue-simulating optical phantoms is demonstrated through a series of benchtop experiments. By printing the sections of human brain model based on MR images, we demonstrate the system capability for simulating tissue structural heterogeneities. By measuring the optical properties of multilayered phantoms and comparing them with numerical simulation, we demonstrate the feasibility for simulating tissue optical properties. By creating a rat head phantom with embedded vasculature, we demonstrate the potential for mimicking the physiological processes of a living system. 3.1.Simulating Tissue Structural HeterogeneitiesThe system capability for producing tissue-simulating phantoms with structural fidelity is demonstrated by reproducing multiple sections of a human forehead from the sliced MR images. Figure 7 shows the flow chart of the fabrication process. Since the current FDM system has a printable spatial resolution of 0.5 mm, it is difficult to represent tissue heterogeneous features beyond this resolution limit. Therefore, the sliced MR images are simplified by classifying the heterogeneous features into the following four regions: (1) scalp and skull, (2) cerebrospinal fluid (CSF), (3) gray matter, and (4) white matter. These simplified images are directed into the FDM system for path planning and material planning. The G code is generated based on these images using a JD-Paint CAM software package. During the printing process, the microprocessor of the FDM system controls the feed rates of different ingredient materials and the rotational speed of the mixer to achieve the target material composition. As the target material composition is changed, the residual materials left in the print head are discharged automatically to minimize the resultant error in phantom optical properties. In this experiment, four regions of the simplified MR images are printed to simulate the structural heterogeneity of a human brain. Considering the complicated photon migration pattern within CSF,21 the imaging contrast difference between MR images and optical modalities, the poor optical visibility of the CSF region in a brain section, and the difficulty of maintaining an accurate liquid boundary in a solid phantom, we use black gel wax (i.e., gel wax dispersed with graphite powder) to represent the CSF region. The use of black gel wax is only for the enhanced visibility and easy differentiation from the surrounding tissue types. It does not represent the actual optical properties of CSF. The optical properties of the other regions (i.e., scalp and skull, gray matter, and white matter) are estimated based on the previous publications22–24 as listed in Table 1. Table 1Optical properties for four brain tissue types are estimated at 834 nm based on previous publications. These absorption and scattering properties are implemented in the fuse deposition modeling -produced brain phantom, except for the cerebrospinal fluid (CSF) layer, where black gel wax is used instead for clear delineation of the CSF boundary.
Figure 8 shows a stack of five sections of the human brain phantom printed by our FDM system using the simplified MR images. To fit in the working space of the current FDM system, the simplified MR images are shrunk to 65% of their original sizes. Four layers of the transparent base material are printed as the support at the bottom of the phantom before the brain phantom is printed. The thickness of each printed section is 0.4 mm, and each MR section is repetitively printed for three layers. After all the five MRI sections are printed, a layer of transparent base material is printed on the top of the phantom to protect it from physical damage. The temperature of the print-head is set as 72°C, the temperature of heating ring is set as 75°C, and the temperature of the feeding pipe is set as 75°C. The material feeding rate is , and the moving speed of the print-head is . The average height of the printed phantom is 8.12 mm, and the maximum width is 107.23 mm. Figure 9 shows the original MR images, the simplified MR images, and the photographic images of the FDM printed sections of the brain phantom. Fig. 8Photographic image of the stacked brain phantom fabricated by FDM based on the simplified magnetic resonance (MR) images. Each big grid on the bottom of the phantom corresponds to 30 mm. 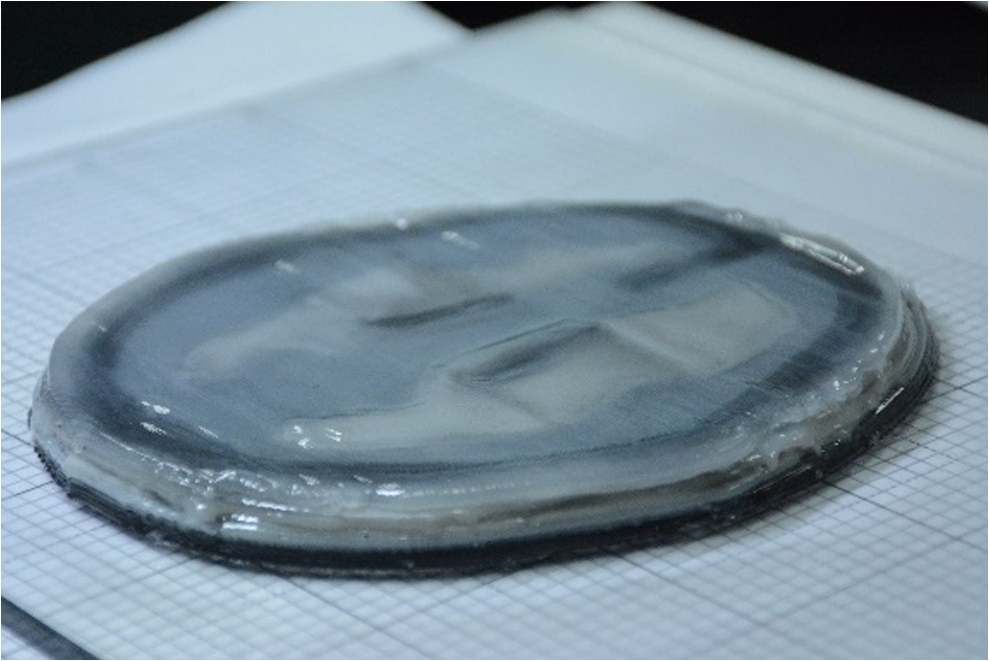 Fig. 9Rows from top down are slices of original MR images at different brain sections, slices of MR images after being simplified into four tissue types, and slices of tissue-simulating phantoms produced by our FDM system. 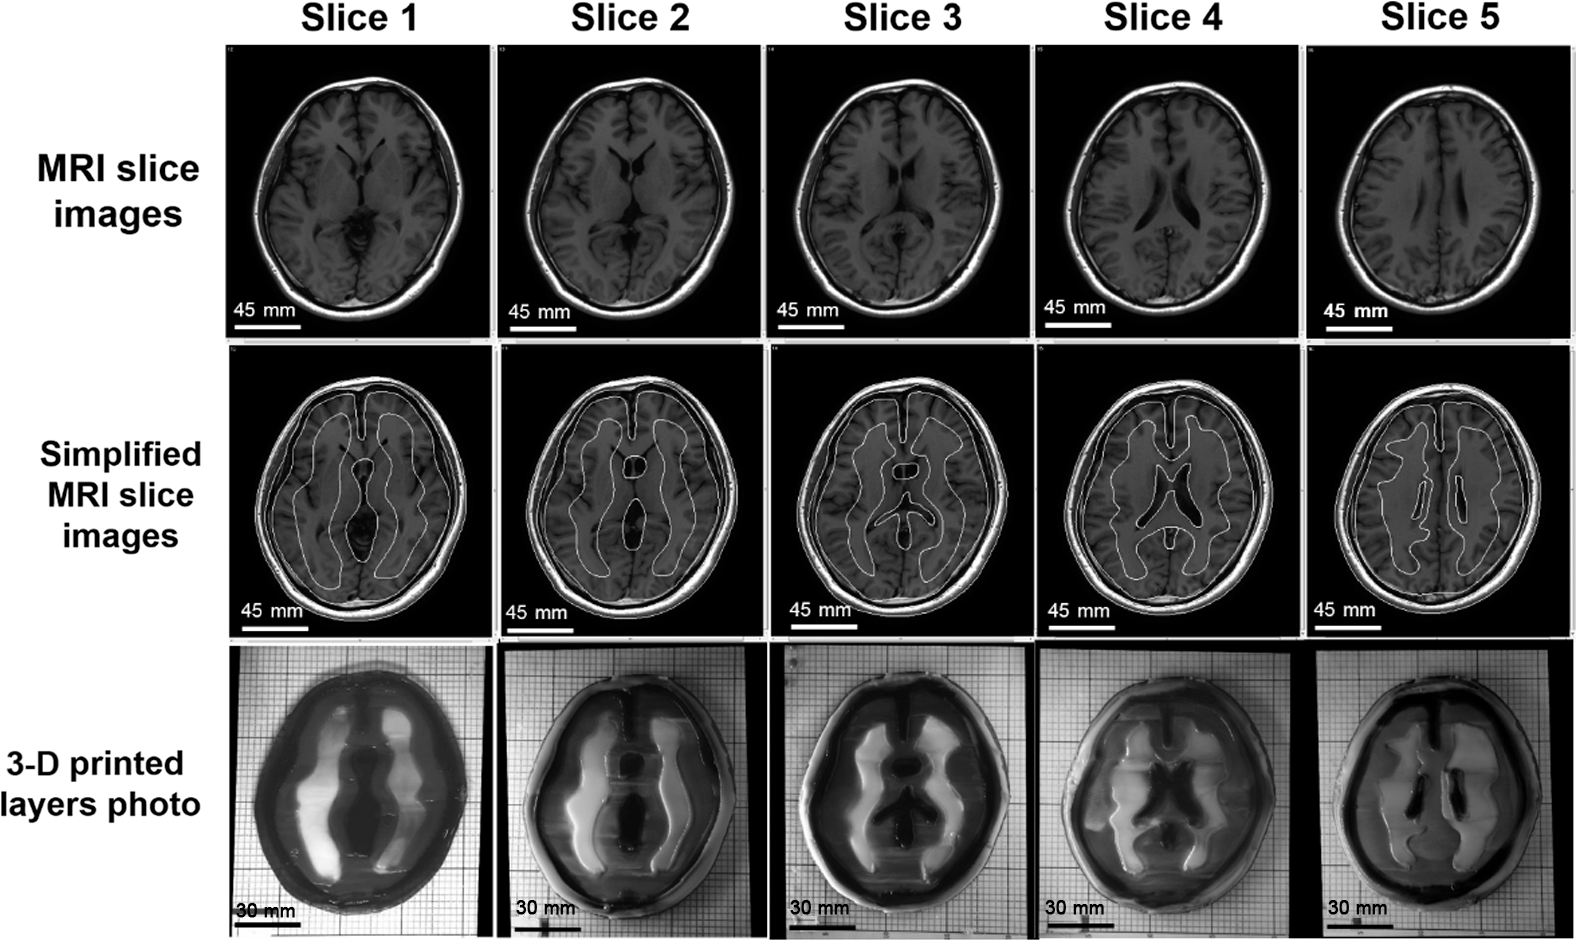 To quantitatively evaluate how the FDM-printed phantom approximates the geometric features of the simplified brain MR imaging sections, we compare the photographic image of each phantom section with the corresponding simplified MR image by defining a “similarity index” as the ratio between the overlapped area of two images and the area of the simplified MR image for each of the four tissue types. First, a MATLAB® image processing toolkit is used to coregister between the phantom image and the simplified MR image. Second, binary images are generated based on the coregistered images for different tissue types. Finally, similarity indices are calculated for individual tissue types by taking the ratio of and . This analysis yields similarity indices better than 95%, 93%, 92%, and 92% for the skin/skull region, the CSF region, the gray matter region, and the white matter region, respectively. These results demonstrate that our FDM system is able to fabricate tissue-simulating phantoms with fidelity. Although we are able to fabricate the gel wax phantoms that simulate different tissue types in consequent brain sections, the current fabrication method still has several limitations. Especially, the printed boundaries and the overlapping areas are typically fuzzy, partially owing to the limited resolution of the existing FDM system (0.5 mm) and the temperature-dependent viscoelastic fluid properties of gel wax. This limitation makes it difficult to reproduce the fine morphologic characteristics as shown in the original brain MR images. Therefore, further improvement of the FDM process and optimization of the material system are required for freeform fabrication of a 3-D brain model with high structural fidelity in the future. 3.2.Simulating Tissue Optical PropertiesThe technical feasibility of printing tissue-simulating phantoms with optical fidelity is demonstrated by testing the optical properties of a two-layered phantom in comparison with those of a Monte Carlo simulation. Four sets of phantoms are fabricated by casting one layer of gel wax phantom on top of the other. The top and the bottom layers have different absorption and scattering properties as measured by the tissue spectrophotometer before casting. All the top layers have a length of 100 mm, a width of 100 mm, and a thickness of 5 mm. All the bottom layers have the same length and width, but a different thickness of 50 mm to approximate a semi-infinite boundary condition. Table 2 shows the optical parameters of the four phantoms (namely A, B, C, and D) and their optical properties of the top and the bottom layers. Table 2Optical parameters of the fabricated two-layered phantoms at 834 nm.
Diffuse reflectance measurements are acquired on the above phantoms at a wavelength of 830 nm and different source–detector separation distances of 1.025, 1.625, 2.225, and 2.825 cm, respectively. At each distance, five different locations near the center of the phantom surface are selected for diffuse reflectance measurement, and the results are listed in Table 3. Table 3Optical intensity measurements at different source–detector distances.
A Monte Carlo model of steady-state light transport in multilayered tissues simulation package is used to simulate photon migration in the two-layered tissue phantom.20 Monte Carlo simulation is widely used to simulate light transport in multilayered tissues of different optical properties. The simulation parameters used in this study are listed in Table 4. Table 4Parameters used for Monte Carlo simulation of light transport in two-layer phantoms.
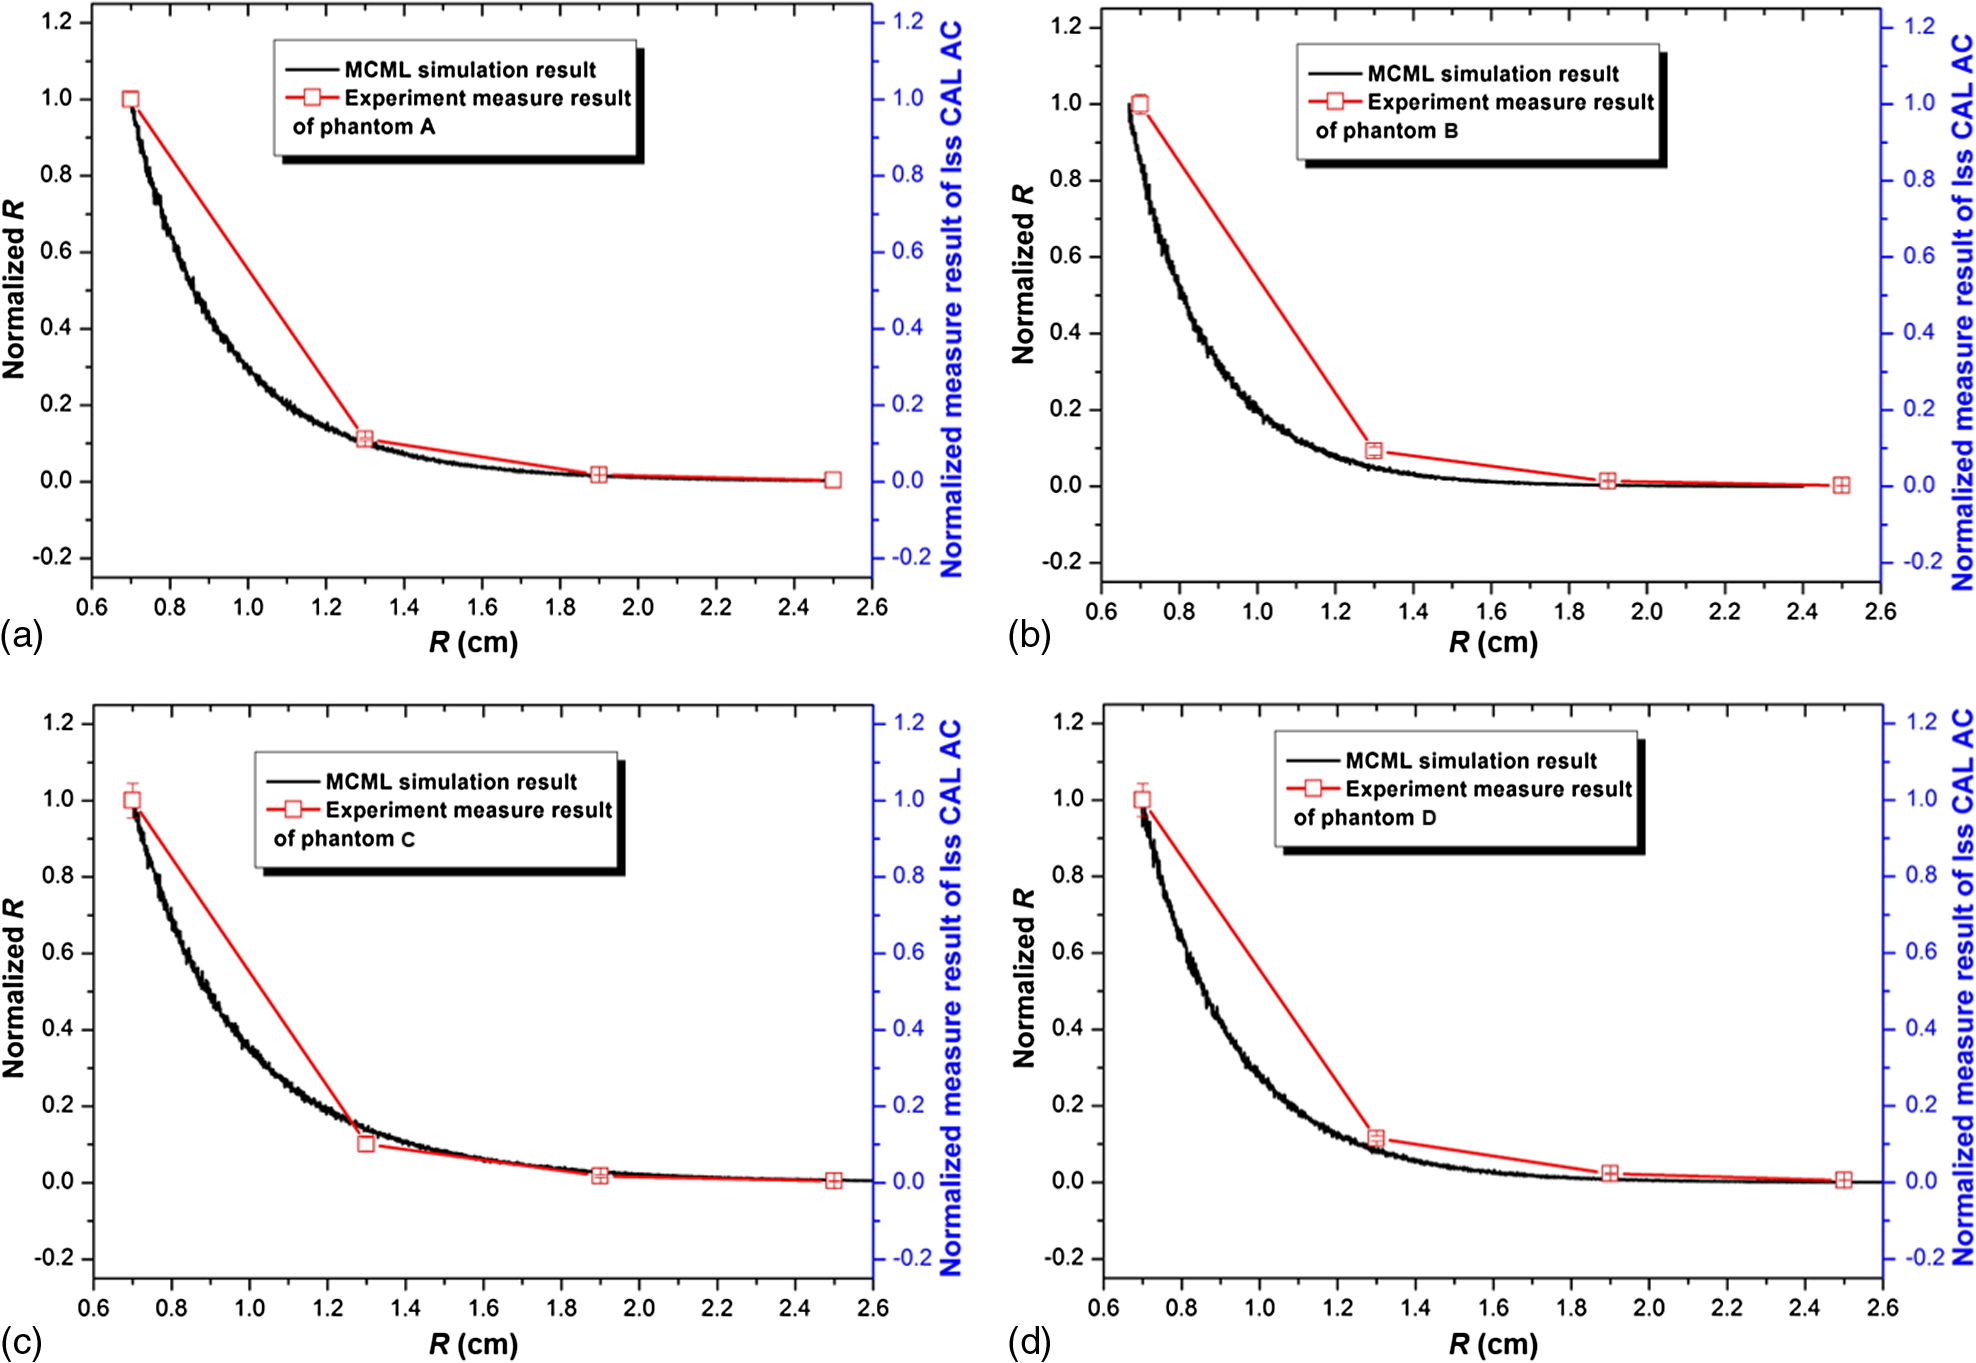
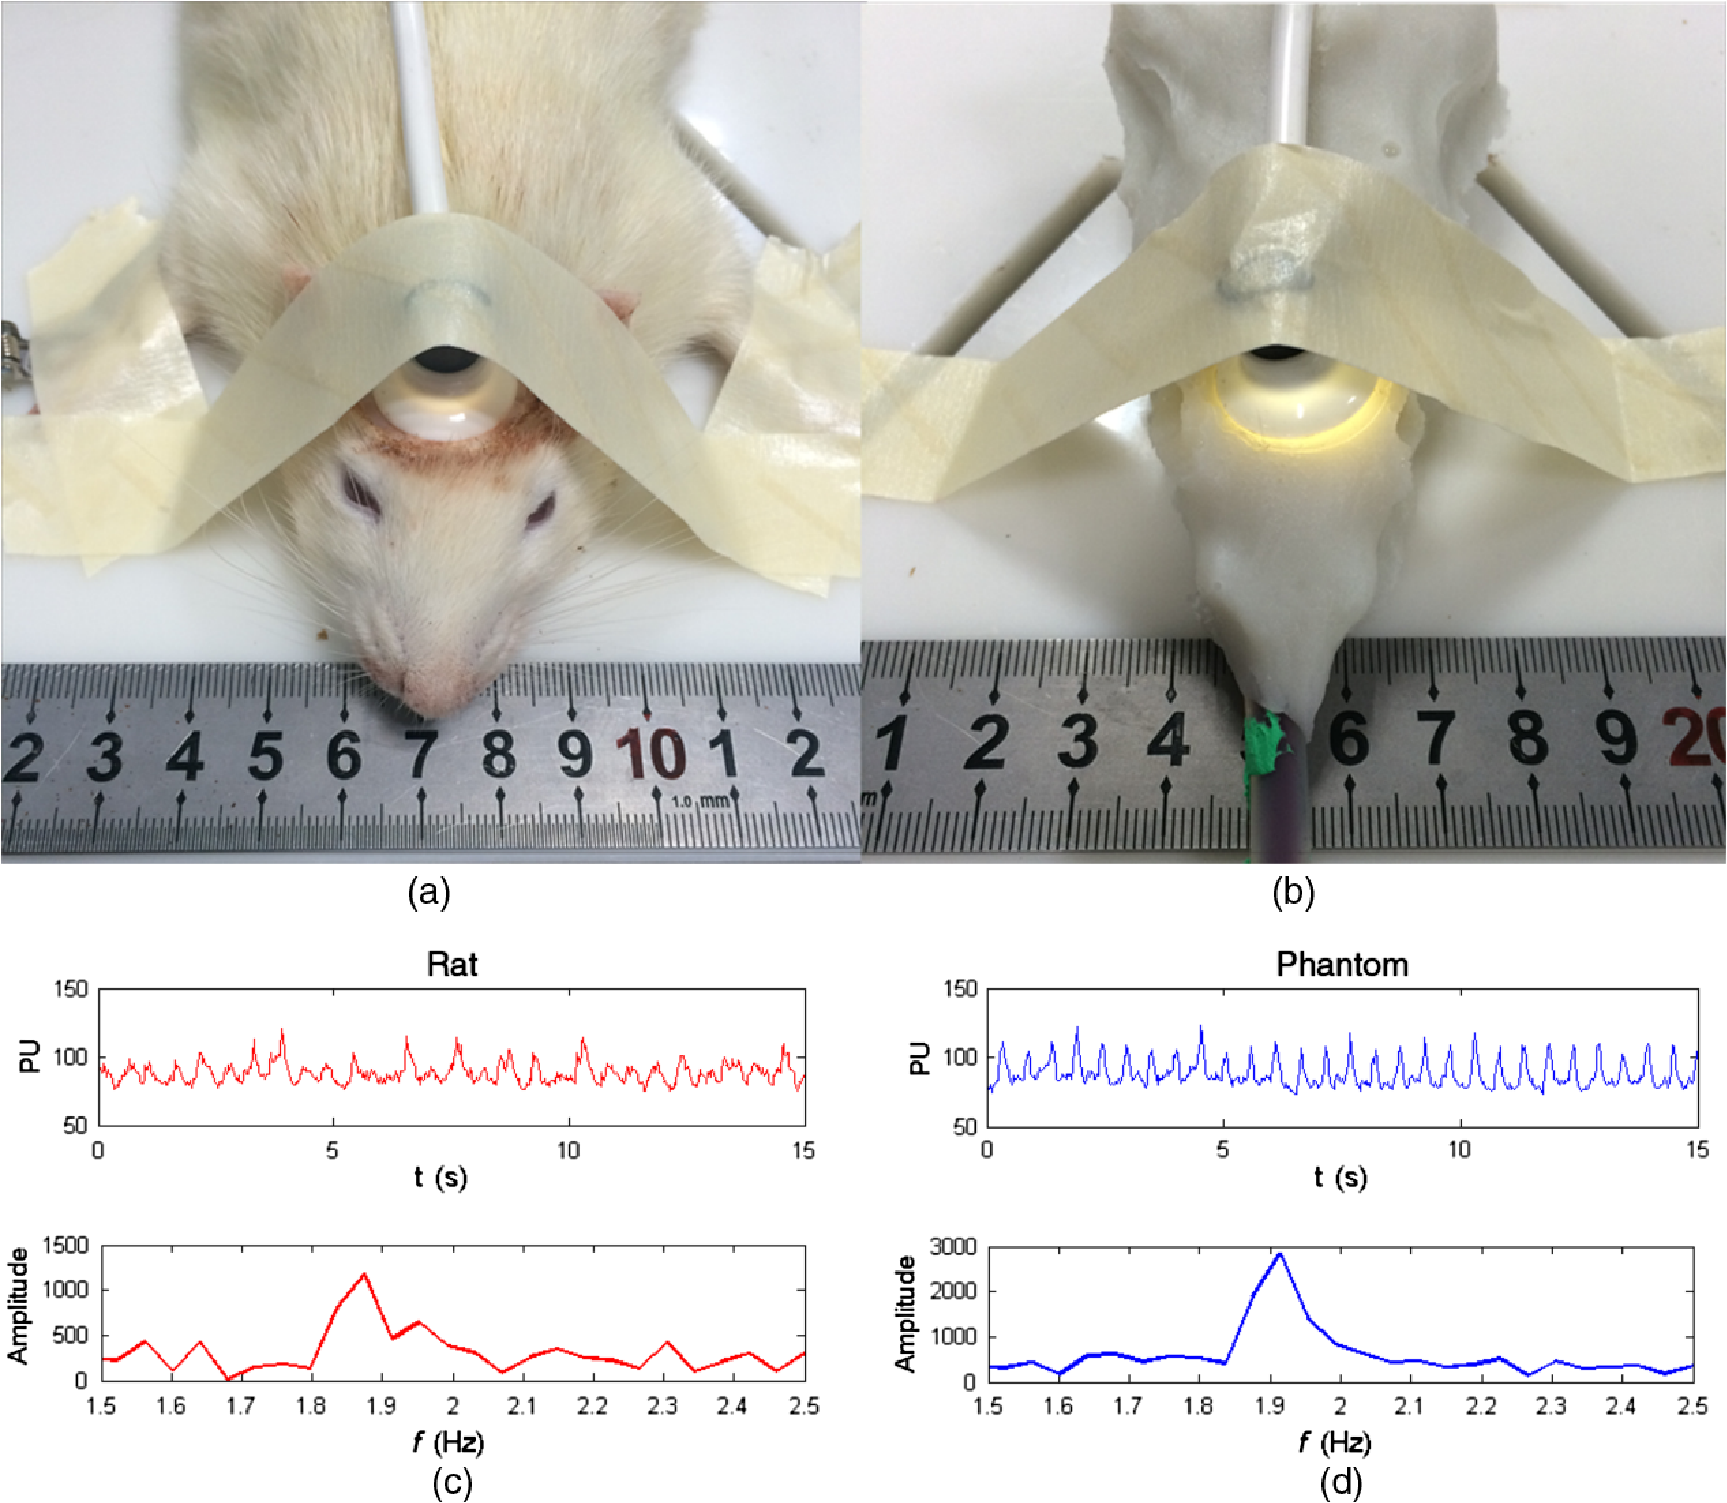
We use the previously obtained absorption and scattering properties of the phantom materials to simulate diffuse reflectance on the surface of the two-layer phantoms at different source-detector separations. To eliminate the artifact caused by inaccurate measurement of the incident light intensity, we normalize the reflectance measurements between the shortest source-detector distance and the longest one to compare the deviations of measurement versus simulation for the middle two source-detector distances. Figure 10 shows the normalized reflectance measurements at different source-detector distances in comparison with simulation results for different phantom configurations as listed in Tables 2 and 3. The averaged deviation between the measured and the simulated reflectance results is below 10%, indicating that the FDM process is able to produce multilayered tissue-simulating phantoms with optical fidelity. 3.3.Simulating Tissue Physiological DynamicsWe demonstrate the capability for simulating the physiological characteristics of a living system using a rat head phantom. The phantom is made of the proposed gel wax materials with an appropriate mixture of the scattering and the absorption ingredients. A silicon tube is embedded inside the rat head phantom, with blood circulated by a peristaltic pump to simulate brain vascular pulsation. A vascular monitoring system laser Doppler flowmetry (Moor Instruments Inc., Devon, UK) is placed on the top of the rat head phantom to measure the simulated blood flow as fresh chicken blood is circulated through the tube at a designated pulsation frequency. For side-by-side comparison, a similar experimental procedure is carried out on a Wistar rat as shown in Fig. 11. The animal protocol is approved by the Institutional Animal Care and Use Committee of University of Science and Technology of China (Protocol No: 150101). The Moor measurement on the animal’s head shows a pulsation of 114 times per minutes. Therefore, the speed of the peristaltic pump is adjusted to simulate the physiologic condition of vascular pulsation. Blood perfusion measurements are acquired on both the rat and the phantom. The raw data and the corresponding frequency analysis results are plotted in Fig. 11. According to the figure, the mouse head phantom yields a similar pulsation pattern in comparison with that of the animal, with a similar pulsation frequency of around 1.9 Hz. This experiment shows that we are able to simulate the physiologic characteristics of a living animal. 4.ConclusionIn this study, we explore the technical feasibility of an FDM process to fabricate multilayered heterogeneities phantoms that simulate human brain tissue structural and optical properties. Our experimental and simulation results show that: (1) the interference between the absorption and the scattering ingredients used in our FDM process is negligible, (2) the FDM process is able to duplicate the structural characteristics of a simplified human brain model with a similarity level better than 92%, and (3) the FDM process is able to duplicate the optical characteristics of multilayered biological tissue with deviations in optical measurements. Further research is necessary to optimize the material system and the engineering design of the phantom FDM technique for freeform fabrication of 3-D tissue-simulating phantoms with high productivity and fidelity. In the future, the proposed phantom FDM technique can potentially be used in combination with the digital tissue phantoms 25 to establish a traceable standard for calibration and performance validation of many biomedical optical devices. AcknowledgmentsThis project is supported by the Natural Science Foundation of China (Nos. 81271527 and 81327803) and the Fundamental Research Funds for the Central Universities (WK2090090013). The authors are grateful to Dr. David Allen of the National Institute of Standards and Technology for his technical guidance. The authors also thank Dr. Pengfei Shao, Dr. Shiwu Zhang, and Dr. Ting Si of the University of Science and Technology of China for providing valuable input, and thank Mr. Shuwei Sheng, Mr. Chenxi Xu, Mr. Yilin Han, Mr. Buyun Guo, and Ms. Yutong He of the University of Science and Technology of China for helping with the experiments. ReferencesW. Du et al.,
“Optical molecular imaging for systems biology: from molecule to organism,”
Anal. Bioanal.Chem., 386
(3), 444
–457
(2006). http://dx.doi.org/10.1007/s00216-006-0541-z ABCNBP 1618-2642 Google Scholar
B. W. Pogue and M. S. Patterson,
“Review of tissue simulating phantoms for optical spectroscopy, imaging and dosimetry,”
J. Biomed. Opt., 11
(4), 041102
(2006). http://dx.doi.org/10.1117/1.2335429 Google Scholar
A. J. Welch et al.,
“Definitions and overview of tissue optics,”
Optical-Thermal Response of Laser-Irradiated Tissue, Plenum Press, New York
(1995). Google Scholar
G. Lamouche et al.,
“Review of tissue simulating phantoms with controllable optical, mechanical and structural properties for use in optical coherence tomography,”
Biomed. Opt. Express, 3
(6), 1381
–1398
(2012). http://dx.doi.org/10.1364/BOE.3.001381 BOEICL 2156-7085 Google Scholar
J. C. Hebden et al.,
“Three-dimensional optical tomography of the premature infant brain,”
Phys. Med. Biol., 47
(23), 4155
–4166
(2002). http://dx.doi.org/10.1088/0031-9155/47/23/303 Google Scholar
A. Villringer and B. Chance,
“Non-invasive optical spectroscopy and imaging of human brain function,”
Trends Neurosci., 20
(10), 435
–442
(1997). http://dx.doi.org/10.1016/S0166-2236(97)01132-6 TNSCDR 0166-2236 Google Scholar
C. Hahn and S. Noghanian,
“Heterogeneous breast phantom development for microwave imaging using regression models,”
Int. J. Biomed. Imaging, 2012 803607
(2012). http://dx.doi.org/10.1155/2012/803607 Google Scholar
A. T. Mobashsher and A. M. Abbosh,
“Three dimensional human head phantom with realistic electrical properties and anatomy,”
IEEE Antennas Wirel. Propag. Lett., 13 1401
–1404
(2014). http://dx.doi.org/10.1109/LAWP.2014.2340409 IAWPA7 1536-1225 Google Scholar
J. Park et al.,
“Fabrication of double layer optical tissue phantom by spin coating method: mimicking epidermal and dermal layer,”
Proc. SPIE, 8583 8583G
(2013). http://dx.doi.org/10.1117/12.2003603 Google Scholar
W. F. Cheong, S. A. Prahl and A. J. Welch,
“A review of the optical properties of biological tissues,”
IEEE J. Quantum Electron., 26 2166
–2185
(1990). http://dx.doi.org/10.1109/3.64354 Google Scholar
D. M. de Bruin et al.,
“Optical phantoms of varying geometry based on thin building blocks with controlled optical properties,”
J. Biomed. Opt., 15
(2), 025001
(2010). http://dx.doi.org/10.1117/1.3369003 Google Scholar
V. Mironov et al.,
“Organ printing: computer-aided jet-based 3D tissue engineering,”
Trends Biotechnol., 21
(4), 157
–161
(2003). http://dx.doi.org/10.1016/S0167-7799(03)00033-7 TRBIDM 0167-7799 Google Scholar
E. Sachlos and J. T. Czernuszka,
“Making tissue engineering scaffolds work. Review: the application of solid freeform fabrication technology to the production of tissue engineering scaffolds,”
Eur. Cells Mater., 5 29
–39
(2003). Google Scholar
V. Lee et al.,
“Design and fabrication of human skin by three-dimensional bioprinting,”
Tissue Eng. Part C Methods, 20
(6), 473
–484
(2014). http://dx.doi.org/10.1089/ten.tec.2013.0335 Google Scholar
F. Rengier et al.,
“3D printing based on imaging data: review of medical applications,”
Int. J. Comput. Assist. Radiol. Surg., 5
(4), 335
–341
(2010). http://dx.doi.org/10.1007/s11548-010-0476-x Google Scholar
T. T. Nguyen et al.,
“Three-dimensional phantoms for curvature correction in spatial frequency domain imaging,”
Biomed. Opt. Express, 3
(6), 1200
–1214
(2012). http://dx.doi.org/10.1364/BOE.3.001200 BOEICL 2156-7085 Google Scholar
J. Solomon, F. Bochud and E. Samei,
“Design of anthropomorphic textured phantoms for CT performance evaluation,”
Proc. SPIE, 9033 90331U
(2014). http://dx.doi.org/10.1117/12.2043555 PSISDG 0277-786X Google Scholar
B. W. Miller et al.,
“3D printing in x-ray and gamma-ray Imaging: a novel method for fabricating high-density imaging apertures,”
Nucl. Instrum. Methods Phys. Res., Sect. A, 659
(1), 262
–268
(2011). http://dx.doi.org/10.1016/j.nima.2011.08.051 Google Scholar
J. Wang et al.,
“Three-dimensional printing of tissue phantoms for biophotonic imaging,”
Opt. Lett., 39
(10), 3010
–3013
(2014). http://dx.doi.org/10.1364/OL.39.003010 Google Scholar
L. Wang, S. L. Jacques and L. Zheng,
“MCML–Monte Carlo modeling of light transport in multi-layered tissues,”
Comput. Methods Programs Biomed., 47
(2), 131
–146
(1995). http://dx.doi.org/10.1016/0169-2607(95)01640-F Google Scholar
E. Okada and D. Delpy,
“Near-infrared light propagation in an adult head model. I. Modeling of low-level scattering in the cerebrospinal fluid layer,”
Appl. Opt., 42
(16), 2906
(2003). http://dx.doi.org/10.1364/AO.42.002906 APOPAI 0003-6935 Google Scholar
G. Strangman et al.,
“A quantitative comparison of simultaneous BOLD fMRI and NIRS recordings during functional brain activation,”
NeuroImage, 17
(2), 719
–731
(2002). http://dx.doi.org/10.1006/nimg.2002.1227 NEIMEF 1053-8119 Google Scholar
A. Custo et al.,
“Effective scattering coefficient of the cerebral spinal fluid in adult head models for diffuse optical imaging,”
Appl. Opt., 45
(19), 4747
–4755
(2006). http://dx.doi.org/10.1364/AO.45.004747 Google Scholar
F. Bevilacqua et al.,
“In vivo local determination of tissue optical properties: applications to human brain,”
Appl. Opt., 38
(22), 4939
–4950
(1999). http://dx.doi.org/10.1364/AO.38.004939 Google Scholar
R. X. Xu et al.,
“Developing digital tissue phantoms for hyperspectral imaging of ischemic wounds,”
Biomed. Opt. Express, 3
(6), 1433
–1445
(2012). http://dx.doi.org/10.1364/BOE.3.001433 BOEICL 2156-7085 Google Scholar
BiographyErbao Dong is currently an associate professor of precision machinery and instrumentation at the University of Science and Technology of China. He received PhD in 2010 from the University of Science and Technology of China. He has authored or coauthored more than 50 technical peer-reviewed papers. His research interests include robotics, biological phantoms, and 3D printing. Zuhua Zhao is a MS student at the University of Science and Technology of China. His research interests include 3D printing and optical tissue phantoms. Yanjun Xie is an undergraduate student at the University of Science and Technology of China. He is going to receive the BEng degree in June 2016. His current research includes serving robot and biomedical imaging. Shidi Li is an undergraduate student at the University of Science and Technology of China. He is going to receive the BEng degree in June 2016. His current research includes multiaxis motion system and optical phantoms for biomedical tissue. Pengfei Shao is currently an associate professor of precision machinery and instrumentation at the University of Science and Technology of China (USTC). He received his PhD degree in 2000 from the Department of Modern Mechanics of USTC. His major research areas include computer aided design and biomedical imaging. Ronald X. Xu is an associate professor of biomedical engineering at The Ohio State University and associate professor of precision machinery and instrumentation at the University of Science and Technology of China. He is an IOP fellow and a SPIE senior member. His lab developed novel micro-/nano-encapsulation techniques for controlled drug delivery and handheld imaging tools for image-guided surgery. |