
|
|
|
Nanocomposites containing rare-earth (RE) ions have appealing properties for use as biomedical imaging contrast agents.1–4 When excited with near-infrared (NIR) light, several of the lanthanide elements, including erbium, thulium, and holmium, emit photons at visible wavelengths through energy transfer upconversion (ETU) processes. This avoids excitation at visible or ultraviolet wavelengths, which generates unwanted autofluorescence and limits penetration depth in tissue. The upconversion of NIR photons to visible emission wavelengths can be achieved with continuous wave (CW) excitation sources, in contrast to the femtosecond pulsed lasers required for multiphoton imaging. RE ions can also be rendered biocompatible and functionalized with targeting ligands for molecular imaging.3 Whereas RE nanocomposites have been used for macroscopic imaging in preclinical animal models, the long emission lifetimes of RE ions have limited their use in high-resolution imaging. Although the nonlinear ETU processes can theoretically provide inherent optical sectioning, the high excitation power required for real-time imaging saturates the two-photon processes.5 This shifts the quadratic relationship between excitation power and emission intensity toward a linear relationship, requiring additional means for sectioning, such as point-scanning confocal or multiphoton microscopy.5–7 These imaging methods sweep a diffraction-limited excitation spot across the specimen in two dimensions, resulting in very short pixel dwell times () if real-time image frame rates are required. RE emission lifetimes are typically on the order of several milliseconds, compared to nanoseconds for conventional organic fluorophores.8,9 The large discrepancy between pixel dwell time and emission lifetime results in the collection of light from sample regions that were excited several milliseconds earlier. This leads to the appearance of a smearing effect, where punctate sources of upconversion intensity appear spatially spread along the direction of the fast scan. Previous attempts to provide cellular-level imaging of REs have included point-scanning confocal microscopy, where the detection pinhole prevents collection of light from time points beyond the pixel dwell time.6,10 Although a small pinhole can reduce unwanted smearing, only a small fraction of the RE’s emission is collected. Deconvolution methods have also been applied to remove the long-lived emission intensity contributions from the captured image.7 This computational approach has been shown to work well for thin, sparsely labeled specimens, but may be challenging to implement in real time, in thick tissues, or in homogeneously labeled regions. Imaging upconversion light with a two-dimensional CCD camera enables the pixel dwell time to be lengthened beyond the RE emission lifetime,6,11 but this full-field approach cannot easily translate to intravital microscopy in thick tissues where optical sectioning is required to eliminate out-of-focus light. In contrast to point-scanning and full-field approaches, line-scanning confocal microscopy excites and collects light from all points along a one-dimensional line in parallel. A focused line of excitation light is swept across the sample in the direction perpendicular to the length of the line. By exciting and collecting light from all points along the line simultaneously, the pixel dwell time is longer than point scanning by a factor equal to the number of points within the line (e.g., 500 to 1000). The line-scanning architecture has been used to create very fast confocal imaging platforms,12 and its relative simplicity has led to the design of compact instruments for clinical applications.13–16 Here, we develop and use line-scanning confocal microscopy in a new context, to address the problem of long emission lifetimes in RE-based upconverting contrast agents. The pixel dwell time is made comparable to the RE ions’ lifetime, and real-time imaging with optical sectioning ability is conserved. RE-doped nanoparticles were synthesized using the solvothermal decomposition method described previously.17 The resulting nanoparticles ( to 11 nm in diameter) were encapsulated in human serum albumin, forming RE albumin nanocomposites (REANCs), each in diameter and containing individual RE nanoparticles.18 Under CW excitation at 980 nm, the nanoparticles’ upconversion was measured using a fiber-coupled spectrometer (Ocean Optics, USB4000-VIS-NIR-ES). The emission lifetime was measured at 540 and 650 nm using the visible single photon counting photomultiplier module (Hamamatsu R928P) on an Edinburgh Instruments FLS980 spectrometer, following excitation with an electronically modulated () 980 nm source. To assemble the line-scanning confocal upconversion microscope, the output from a single-mode fiber-coupled diode laser with 980 nm wavelength (QPhotonics) was first collimated to a circular beam diameter of 8.0 mm () before being focused by a 150-mm focal length achromatic cylindrical lens (Thorlabs) [Fig. 1(a)]. The resulting line focus is oriented parallel to the axis in Fig. 1(a) and positioned at the back aperture of a microscope objective. (Olympus Plan N), (Olympus UPlan FLN), and (Nikon Plan Fluor) objective lenses provided varying fields of view and resolution. A single-axis galvanometer scanner is located as close as possible to the objective back aperture (a distance of 20 mm) and pivots about the axis in Fig. 1(a). The visible upconversion light returning from the specimen is transmitted through a short-pass dichroic mirror (Thorlabs DMSP805), transmitted by a 519 to 700 nm band-pass filter (Semrock), and focused by a 200-mm focal length achromat lens onto a line-scan camera (e2v, Aviiva EM1) with 1024 pixels, each wide and tall and oriented parallel to the axis in Fig. 1(a). Data from the camera are acquired over the GigE bus at and synchronized with the galvanometer in LabVIEW to generate images at . The signals measured at adjacent pixels along the pixel array are averaged to generate images. Fig. 1(a) Schematic layout of the line-scanning confocal microscope. L1, collimating lens; L2, cylindrical lens; L3, detector lens; D, dichroic mirror; Em, emission filter; GM, scanning galvanometer-mounted mirror; Obj, objective lens. (b) Upconversion emission spectrum and (c) temporal emission intensity at 540 (black) and 650 nm (gray) measured for nanoparticles under 980 nm excitation. The calculated decay times for the 540 and 650 nm emission are 460 and , respectively.  The field of view was measured for each objective lens by imaging a calibrated grid target (Thorlabs). Images were digitally cropped to the region where the intensity measured from a uniform target was at least of the maximum level. A high-resolution USAF 1951 target (Edmund Optics) was imaged to evaluate lateral resolution for the objective. For the higher numerical aperture (NA) objectives, the microscope resolved all nine groups on the target, so the full width at half maximum (FWHM) of the derivative of an intensity profile across a lateral edge was measured to quantify lateral resolution. Optical sectioning was determined by acquiring a sequence of images as a mirror was translated through the focus and measuring the mean pixel value over the central region of these images. No additional confocal slit aperture was used; the camera’s nominal pixel height () was equivalent to 0.76 Airy units, defined as . To assess the performance of line-scanning confocal microscopy for imaging RE-based contrast agents, clusters of nanoparticles were deposited on a microscope slide and excited with a power of 14.0 mW (distributed over the length of the line focus). For in vitro studies, MDA-MB-231 human breast cancer cells cultured in Dulbecco’s modified Eagle medium supplemented with 10% fetal bovine serum and 1% Penicillin/streptomycin were plated on Lab-Tek II chambered glass slides at a density of and allowed to adhere for 24 h. Cells were then treated with 10% v/v REANCs for 24 h before being washed, fixed, and counterstained with proflavine to highlight cell nuclei. Under a protocol approved by Rutgers University IACUC, athymic nude mice were inoculated with either MDA-MB-231 or 4175-TR human breast cancer cells on the dorsal flanks. Once subcutaneous tumors were established, REANCs were administered via tail vein injection. After eight weeks, animals were euthanized and xenograft tumors and livers were excised and flash frozen, with thick tissue cryosections mounted and coverslipped on microscope slides. Cells and tissues were imaged with line illumination of 93.3 and 168.2 mW power at the sample, respectively. A separate point-scanning confocal microscope was built to image the RE samples using the same excitation source, emission filter, and objective lens as the line-scanning system. A pair of galvanometer scanners (Cambridge Technology 6210) swept the incident spot over the sample in two dimensions. A photomultiplier tube (Hamamatsu R3896) served as the detector in the point-scanning system, which acquired images, covering a field of view () at . A commercial point-scanning confocal platform (Leica TCS SPII) was used with 488 nm excitation to image autofluorescence from the REANCs albumin shell and confirm the source of the upconversion signal observed under line-scanning confocal microscopy. Figure 1(b) demonstrates the upconversion emission spectrum measured from nanoparticles under CW illumination at 980 nm, with green (515 and 541 nm) and red (650 nm) light arising from electronic transitions in erbium ions.19 Figure 1(c) shows the typical decay curves for spanning several milliseconds. With the objective, the field of view of the line-scanning confocal microscope [ plane in Fig. 1(a)] was measured to be (). Group 8 element 5 of a 1951 USAF resolution target was imaged with 29% contrast, corresponding to a lateral resolution of [Figs. 2(a) and 2(b)]. Optical sectioning was measured to be (FWHM) [Fig. 2(c)]. The theoretical lateral resolution and optical sectioning were 1.6 and , respectively.20 The fields of view for the and objectives were measured to be () and (), respectively. Theoretical and experimental lateral resolution and optical sectioning values are summarized for each objective lens in Table 1. Fig. 2(a) and (b) High-resolution USAF 1951 target ( objective). (c) Axial response to a mirror scanned through the focus of three objective lenses. 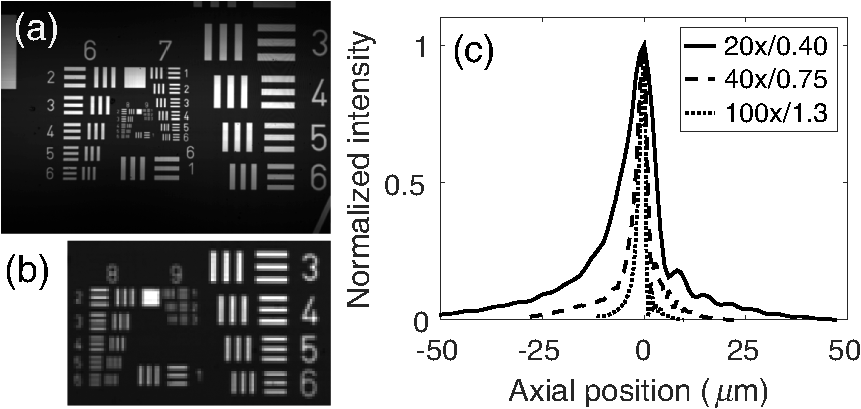 Table 1Lateral resolution and optical sectioning strength for the line-scanning confocal microscope using different objective lenses.
Figure 3 demonstrates line-scanning reflectance [Fig. 3(a)] and line-scanning upconversion [Fig. 3(b)] confocal imaging of RE-doped nanoparticles. With the objective lens, clusters of particles generate a clear, high-contrast upconversion image [Fig. 3(b)]. When imaged using the custom-built point-scanning confocal microscope with no pinhole [Fig. 3(d)], the characteristic smearing of the upconversion can be observed in the direction of the fast scan. The addition of a pinhole reduced this effect [Fig. 3(e)], but, with a diameter of 5.4 Airy units, provided only weak optical sectioning. Reducing the point-scanning confocal pinhole to (1.3 Airy units) provided an optical sectioning strength comparable to the line-scanning microscope [Fig. 3(b)],21 and also significantly reduced the signal-to-background level [Fig. 3(f)]. Fig. 3Confocal microscopy of rare-earth (RE) nanoparticles ( objective): (a) line-scanning reflectance, (b) line-scanning upconversion, (c) point-scanning reflectance, (d) point-scanning upconversion (no pinhole), (e) point-scanning upconversion ( pinhole), and (f) point-scanning upconversion ( pinhole). . 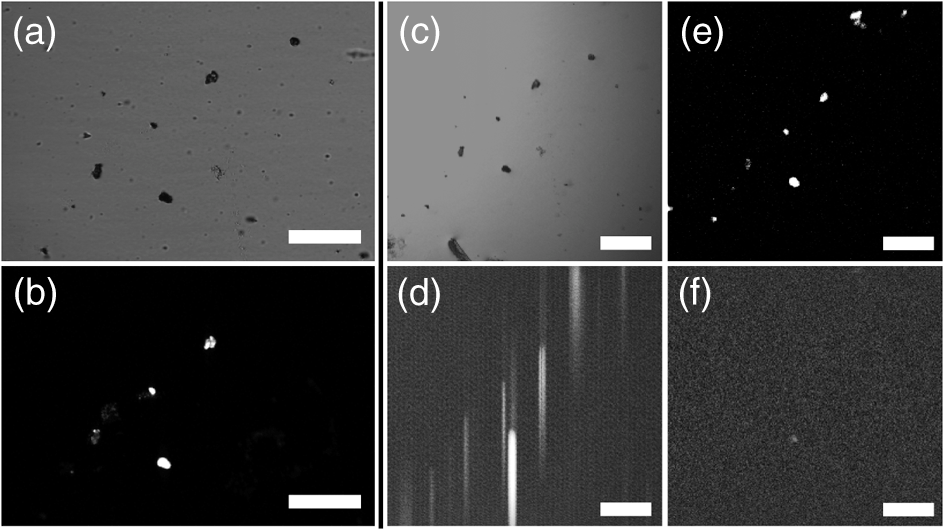 Line-scanning confocal microscopy of REANCs is demonstrated in biological samples in Fig. 4. As a negative control, cells without REANCs showed no upconversion signal [Fig. 4(a)]. Following the addition of REANCs, localization of the contrast agent on and within the cells is apparent [Fig. 4(b)]. Figure 4(c) shows point-scanning confocal microscopy of mouse tumor tissue at . RE signal was not detectable on the commercial system, but the albumin shell autofluorescence was detected under 488 nm excitation to establish the location of REANCs (green overlay). Under line-scanning microscopy [Fig. 4(d)], the upconversion light could be readily detected (red overlay), coincident with the albumin shell signal. The corresponding video clip shows a -stack sequence of upconversion images as the specimen is translated through the focus at steps (Video 1), demonstrating the ability of the line-scanning microscope to acquire optically sectioned images without smearing of the RE emission. Figure 4(e) shows a projection of the RE signal overlaid with a white-light image of ex vivo liver tissue, which takes up the REANCs due to the hepatic clearance pathway. The highlighted region in Fig. 4(e) is displayed in Fig. 4(f) at magnification to show more detailed REANC localization. The colormap represents the -position of the particles in the tissue at depths ranging from to . Fig. 4Line-scanning confocal upconversion microscopy of biological samples. (a) and (b) Proflavine (blue) stained cells in vitro (a) without RE albumin nanocomposites (REANCs) and (b) following addition of REANCs, overlaid with the upconversion image (red). Mouse subcutaneous tumor tissue section with (c) point-scanning confocal microscopy of albumin shell autofluorescence overlaid (green) and (d) line-scanning confocal microscopy of the same section as in (c) with upconversion image overlaid (red). Video 1 shows corresponding -stack with step size. (e) Mouse liver section with -stack projection of upconversion image overlaid. (f) Selected region from (e) magnified at shows upconversion from REs at depths ranging from to . . (Video 1, MP4, 239 kB [URL: http://dx.doi.org/10.1117/1.JBO.20.11.110506.1]).  REANC-based contrast agents have appealing properties for targeted imaging of disease. These materials have been functionalized with targeting ligands against established biomarkers for neoplastic lesions.3 NIR excitation allows for deeper imaging than with visible fluorophores, whereas reduced autofluorescence can improve signal-to-background levels. The ETU process involves real energy levels, allowing for use of low-intensity CW excitation sources, in contrast to the complex and expensive ultrafast lasers required for multiphoton techniques. Although preclinical in vivo imaging studies have demonstrated these benefits at the macroscopic scale, the long emission lifetimes of RE ions have hindered efforts to enable cellular-level imaging with these contrast agents. The pinhole in confocal microscopy prevents collection of RE emissions occurring beyond the pixel dwell time, but drastically reduces light collection efficiency and compromises the ability to image beneath the tissue surface. Nonlinear microscopy techniques that use nondescanned detection also suffer from smearing of the RE emission along the fast-scan axis due to the long emission lifetime relative to the pixel dwell time. We have shown here that line-scanning confocal upconversion microscopy provides a solution to the unique challenges posed by high-resolution imaging of RE-based nanomaterials. Previous researchers have established the feasibility of implementing line-scanning methods in clinically viable devices.14,16,22 We anticipate that the line-scanning approach will assist in translation of this class of optical contrast agent toward clinical studies and permit microscopic scale visualization of RE uptake alongside existing macroscopic imaging platforms. AcknowledgmentsThis work was supported by the National Institutes of Health under grant R01 EB018378. ReferencesS. F. Lim et al.,
“In vivo and scanning electron microscopy imaging of upconverting nanophosphors in Caenorhabditis elegans,”
Nano Lett., 6
(2), 169
–174
(2006). http://dx.doi.org/10.1021/nl0519175 NALEFD 1530-6984 Google Scholar
G. Wang, Q. Peng and Y. Li,
“Upconversion luminescence of monodisperse nanocrystals,”
J. Am. Chem. Soc., 131
(40), 14200
–14201
(2009). http://dx.doi.org/10.1021/ja906732y Google Scholar
D. J. Naczynski et al.,
“Rare-earth-doped biological composites as in vivo shortwave infrared reporters,”
Nat. Commun., 4 2199
(2013). http://dx.doi.org/10.1038/ncomms3199 Google Scholar
Q. Q. Dou, H. C. Guo and E. Ye,
“Near-infrared upconversion nanoparticles for bio-applications,”
Mater. Sci. Eng. C, 45 635
–643
(2014). http://dx.doi.org/10.1016/j.msec.2014.03.056 Google Scholar
M. Pollnau et al.,
“Power dependence of upconversion luminescence in lanthanide and transition-metal-ion systems,”
Phys. Rev. B, 61
(5), 3337
(2000). http://dx.doi.org/10.1103/PhysRevB.61.3337 Google Scholar
J. Pichaandi et al.,
“Two-photon upconversion laser (scanning and wide-field) microscopy using -doped upconverting nanocrystals: a critical evaluation of their performance and potential in bioimaging,”
J. Phys. Chem. C, 115
(39), 19054
–19064
(2011). http://dx.doi.org/10.1021/jp206345j Google Scholar
C. F. Gainer, U. Utzinger and M. Romanowski,
“Scanning two-photon microscopy with upconverting lanthanide nanoparticles via Richardson-Lucy deconvolution,”
J. Biomed. Opt., 17
(7), 076003
(2012). http://dx.doi.org/10.1117/1.JBO.17.7.076003 Google Scholar
J. R. Lakowicz,
“Radiative decay engineering: biophysical and biomedical applications,”
Anal. Biochem., 298
(1), 1
–24
(2001). http://dx.doi.org/10.1006/abio.2001.5377 Google Scholar
D. Yuan et al.,
“Comprehensive study on the size effects of the optical properties of nanocrystals,”
J. Phys. Chem. C, 117
(25), 13297
–13304
(2013). http://dx.doi.org/10.1021/jp403061h Google Scholar
M. Yu et al.,
“Laser scanning up-conversion luminescence microscopy for imaging cells labeled with rare-earth nanophosphors,”
Anal. Chem., 81
(3), 930
–935
(2009). http://dx.doi.org/10.1021/ac802072d Google Scholar
E. A. Grebenik et al.,
“Feasibility study of the optical imaging of a breast cancer lesion labeled with upconversion nanoparticle biocomplexes,”
J. Biomed. Opt., 18
(7), 076004
(2013). http://dx.doi.org/10.1117/1.JBO.18.7.076004 Google Scholar
R. Wolleschensky, B. Zimmermann and M. Kempe,
“High-speed confocal fluorescence imaging with a novel line scanning microscope,”
J. Biomed. Opt., 11
(6), 064011
(2006). http://dx.doi.org/10.1117/1.2402110 Google Scholar
Y. S. Sabharwal et al.,
“Slit-scanning confocal microendoscope for high-resolution in vivo imaging,”
Appl. Opt., 38
(34), 7133
–7144
(1999). http://dx.doi.org/10.1364/AO.38.007133 Google Scholar
A. A. Tanbakuchi et al.,
“Clinical confocal microlaparoscope for real-time in vivo optical biopsies,”
J. Biomed. Opt., 14
(4), 044030
(2009). http://dx.doi.org/10.1117/1.3207139 Google Scholar
P. J. Dwyer, C. A. DiMarzio and M. Rajadhyaksha,
“Confocal theta line-scanning microscope for imaging human tissues,”
Appl. Opt., 46
(10), 1843
–1851
(2007). http://dx.doi.org/10.1364/AO.46.001843 Google Scholar
B. Larson, S. Abeytunge and M. Rajadhyaksha,
“Performance of full-pupil line-scanning reflectance confocal microscopy in human skin and oral mucosa in vivo,”
Biomed. Opt. Express, 2
(7), 2055
–2067
(2011). http://dx.doi.org/10.1364/BOE.2.002055 Google Scholar
G.-S. Yi and G.-M. Chow,
“Water-soluble core/shell/shell nanoparticles with significant enhancement of upconversion fluorescence,”
Chem. Mater., 19
(3), 341
–343
(2007). http://dx.doi.org/10.1021/cm062447y Google Scholar
D. J. Naczynski et al.,
“Albumin nanoshell encapsulation of near-infrared-excitable rare-earth nanoparticles enhances biocompatibility and enables targeted cell imaging,”
Small, 6
(15), 1631
–1640
(2010). http://dx.doi.org/10.1002/smll.200902403 SMALBC 1613-6810 Google Scholar
J. Suyver et al.,
“Upconversion spectroscopy and properties of doped with , and/or ,”
J. Lumin., 117
(1), 1
–12
(2006). http://dx.doi.org/10.1016/j.jlumin.2005.03.011 Google Scholar
G. S. Kino and T. R. Corle, Confocal Scanning Optical Microscopy and Related Imaging Systems, Academic Press, San Diego, California
(1996). Google Scholar
T. Wilson and A. Carlini,
“Size of the detector in confocal imaging systems,”
Opt. Lett., 12
(4), 227
–229
(1987). http://dx.doi.org/10.1364/OL.12.000227 Google Scholar
D. X. Hammer et al.,
“Line-scanning laser ophthalmoscope,”
J. Biomed. Opt., 11
(4), 041126
(2006). http://dx.doi.org/10.1117/1.2335470 Google Scholar
|
||||||||||||||||||||||||


