|
|
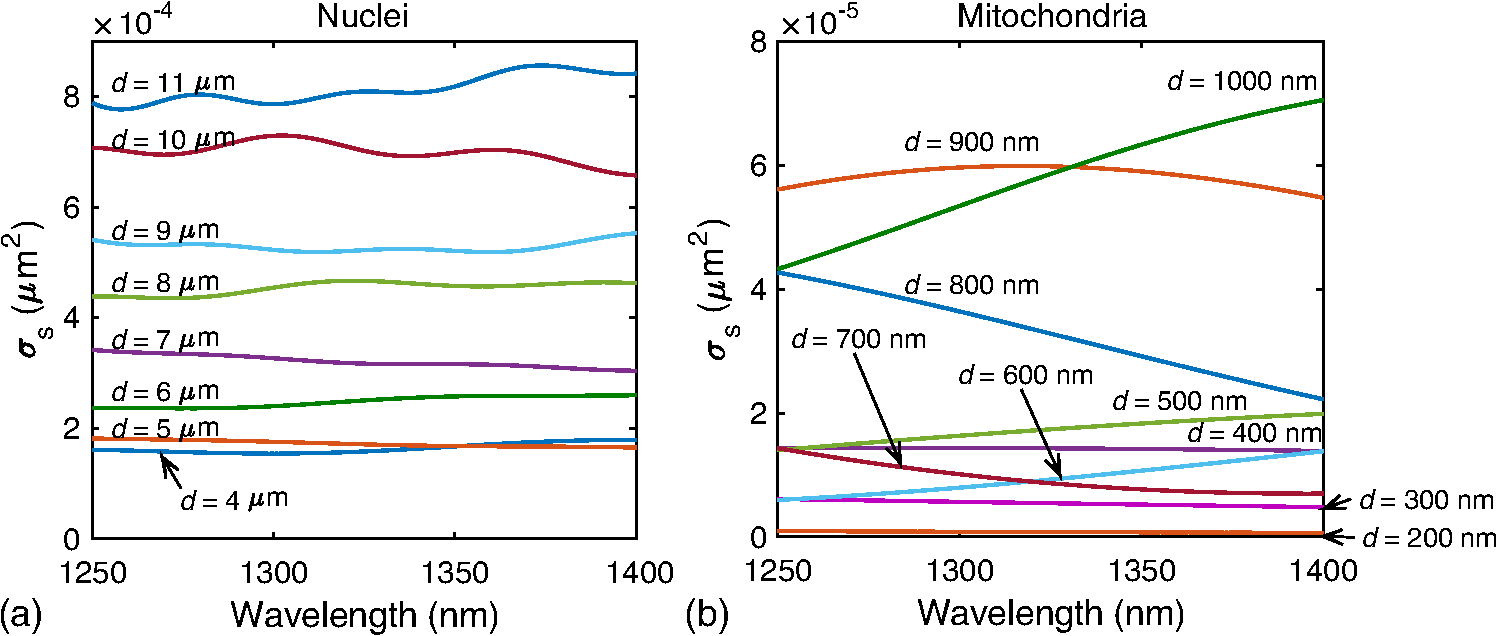
1.IntroductionMany cancer therapies rely on the induction of apoptosis,1–3 a form of programmed cell death, to reduce tumor burden. Cells can begin to undergo apoptosis in treated tissues as early as 24 h after the start of treatment.4 However, cancer treatment efficacy is still largely assessed by measuring changes in tumor size several weeks or months later. Detection of apoptosis in treated tissues could permit rapid treatment monitoring, identifying patients who fail to show an early response to treatment and providing the option of treatment modification at an early stage in the therapeutic process. It has been found with a number of cancer types that early response to therapy can be predictive of overall response and patient survival.5–8 The ability to detect early changes associated with cell death could, therefore, permit the cessation of ineffective treatments, sparing the patient from unnecessary side effects and allowing a shift to a more effective treatment, potentially improving overall outcome. Apoptosis is characterized by a series of predictable morphological changes at the subcellular level. During this process, the cell undergoes a reduction in volume, disruption of the mitochondrial network, condensation and fragmentation of the nucleus, and eventually fragmentation of the cell into apoptotic bodies. The structural changes that occur as a result of apoptosis modify the optical and mechanical properties of tissues, which can be probed using appropriate physical techniques. We have previously used quantitative ultrasound methods to detect cell death in vitro and in vivo as well as to monitor response to treatment in a clinical study of breast cancer patients undergoing chemotherapy.9–11 These quantitative methods were developed with the help of ultrasound spectral analysis techniques described by Lizzi et al.12,13 Our work indicated that ultrasound backscatter signals may be correlated with changes in nuclear size in tissues and cell samples undergoing apoptosis.14 More recently, we have applied similar quantitative techniques to optical coherence tomography (OCT) backscatter signals. We demonstrated that significant differences in backscatter signal intensity and OCT speckle statistics can be measured in acute myeloid leukemia (AML) cell samples undergoing cell death.15 Moreover, because the morphological transformations related to cell death are part of a dynamic process occurring during a specific time window, we demonstrated that variations in the OCT speckle intensity can be measured as a function of time using dynamic light scattering OCT.16 OCT is advantageous for treatment monitoring because it is noninvasive and nonionizing, making it safe for longitudinal studies and providing rapid imaging at low cost. Furthermore, OCT may be particularly sensitive to subcellular structures, because the imaging wavelengths are similar in scale (micron scale) to subcellular organelles. Light backscattered from biological tissues will undergo Mie scattering from organelles inside the cells, making this imaging modality sensitive to changes in size, shape, and refractive index of such structures. Several studies have been conducted using optical techniques to detect structural changes in cells. Light-scattering methods have been used to detect alterations in nuclear morphology in dysplastic cells,17 and spectroscopic OCT has been used to differentiate between cell types based on cell and nuclear morphology.18 Optical techniques have also been used to detect cell viability. Mulvey et al.19 developed an elastic light scattering method for detecting changes in wavelength-dependent light scattering from cells undergoing apoptosis. OCT has been used for cell-death monitoring both in vitro and in vivo. Apoptosis and necrosis have been detected in human fibroblast cells using the total attenuation coefficient of cell samples computed from OCT images,20 ultrahigh resolution OCT has been used to detect apoptosis in neuronal cells through texture-based analysis of the OCT speckle pattern,21 and changes in relative tissue scattering have been measured between viable and nonviable tissue regions in a mouse tumor model using optical frequency domain imaging.22 In this study, we present a method to characterize the OCT signal by computing its spectral slope (SS) and integrated backscatter (IB), the wavelength average of the backscatter power spectrum. This spectroscopic technique is implemented here both in vitro and in vivo using the same cell line. Measurement of the spectroscopic parameters in an in vitro cell-death model indicates that the IB increased in cell samples undergoing apoptosis caused by a chemotherapeutic drug, relative to untreated control samples, while the SS decreased. The change in parameter values was largest 24 to 48 h after the start of treatment, coinciding with significant morphological transformations at the cellular level. Similar trends in the spectroscopic parameters were observed in an in vivo implementation of this technique. Measured changes in IB and SS from tumor xenografts in mice treated with chemotherapy and radiation demonstrate the feasibility of using this method for in vivo detection of apoptosis. 2.Methods2.1.Biological ModelsThe in vitro cell samples and in vivo tumors in this study were generated using AML cells. Extensive use of AML cells for cell-death monitoring using ultrasound techniques9,23 has permitted the characterization of in vitro kinetics of apoptosis in these cells. Due to its short doubling time and nonadherent nature, this cell line permits the rapid production of large numbers of cells, as required in an in vitro cell-death model as used here. Furthermore, the cell packing observed in the AML cell samples resembles that observed in tumor xenografts in vivo and thus has served as a good model for cell-death monitoring in tumors.24 In order to demonstrate the feasibility of in vivo cell-death detection using our technique, we developed an in vivo tumor model using the same AML cell line, allowing a direct comparison between our in vitro and in vivo results. 2.1.1.In vitro cell sample preparationApproximately cells (AML-5, Ontario Cancer Institute, Toronto, Canada) started from frozen stock samples were grown at 37°C in suspension flasks containing 150 mL of -minimal essential medium supplemented with 1% streptomycin and 5% fetal bovine serum. Apoptosis was induced by treating cells with the chemotherapeutic agent cisplatin, a DNA intercalater, which causes a p53-dependent apoptosis.25 Seven flasks were treated simultaneously with of cisplatin and returned to the incubator for up to 48 h with one additional untreated flask to serve as a control. The cisplatin dose used in these in vitro experiments has previously been confirmed to cause apoptosis.9,26–28 Imaging times were set at 0, 2, 4, 6, 9, 12, 24, and 48 h of cisplatin exposure. At each imaging time, a cell sample was prepared for imaging from a single treated flask. The cells were washed with phosphate buffered saline (PBS) and processed using a benchtop swing bucket centrifuge (Jouan CR4i, Thermo Fisher Scientific, Waltham, Massachusetts) in a flat-bottom eppendorf tube at for 5 min. This resulted in a densely packed cell sample approximately 1 cm in diameter and 2 mm in thickness. The supernatant above the sample was carefully removed using a pipette tip. The entire experiment was conducted a second time to test for repeatability. 2.1.2.Mouse tumor modelThe in vivo cell-death model consisted of AML tumors grown in the hind leg of severe combined immunodeficiency (SCID) mice. Each tumor was grown from cells in of PBS. This cell suspension was injected subcutaneously into the right hind leg of each of 32 mice (CB-17 SCID, Charles River, Canada). Tumors measuring 3 to 5 mm in diameter (determined by palpation) developed over approximately 21 days. Each mouse was randomly designated to one of the three groups: control (total of eight mice), chemotherapy (total of 12 mice), and chemotherapy with radiation (total of eight mice). An initial series of experiments revealed that chemotherapy alone did not induce a very strong treatment response. The third group of mice (receiving a combination of chemotherapy and radiation) was added to the study in order to increase the level of cell kill in the AML tumors. The mice receiving chemotherapy were given dexamethasone () and cisplatin (), administered slowly and consecutively via a tail vein catheter. Saline was administered subcutaneously immediately following the chemotherapeutic agents. Radiation treatment was given 24 h after the administration of chemotherapy using a Faxitron Cabinet X-ray device (Faxitron X-ray, Lincolnshire, Illinois) with 160 kVP energy and a source to skin distance of 30 cm. Each animal was restrained and a single 8 Gy dose was localized to the tumor site using a 3-mm thick lead sheet with a circular cut-out to expose the tumor. Prior to imaging, the skin overlying the tumor was removed to permit direct imaging access to the tumor tissue. The mice in the control group were imaged on day 1 (the day treatment was administered), while the treated mice were imaged at 48 or 72 h postchemotherapy. Immediately after imaging, the animals were sacrificed and their tumors were prepared for histological staining. All surgeries, chemotherapy, and imaging procedures were conducted under ketamine () and xylazine () anesthesia, administered subcutaneously and with Institutional Animal Care Committee approval at Sunnybrook Health Sciences Centre (Toronto, Canada). 2.2.Data AcquisitionData for the in vitro experiments were collected using a Thorlabs Inc. (Newton, New Jersey) swept-source OCT (OCM1300SS) system. This system uses a frequency-swept external cavity laser with a central wavelength of 1325 nm and a bandwidth of approximately 100 nm with an axial resolution of , a lateral resolution of , and a spectral resolution of 0.15 nm. In vivo data were collected using a custom-made swept-source OCT system similar to the one described previously.29 The system used in this study is based on a 36-facet polygon filter (Lincoln Laser Corp., Phoenix, Arizona) and operates at a central wavelength of 1310 nm with an axial resolution of , a lateral of , and a spectral resolution of 0.15 nm. The Thorlabs Swept-source Optical Coherence Tomography Microscope software package (version 1.3.0.0, Thorlabs Inc.) was used with both OCT systems. Data were acquired in the form of 14-bit OCT interference fringe signals. For each cell sample or tumor, 10 two-dimensional (2-D) data sets containing 128 axial scans were collected in planes spaced at least apart and in such a way as to span the entire cell sample or tumor volume. Each 2-D scan covered a total transverse distance of 1 mm. All samples were imaged such that the surface was located at the same distance in relation to the focal plane to maintain consistency between measurements with respect to variations in signal intensity due to the focal properties of the lens and the depth-dependent signal roll-off of the laser source. Similar measurements were acquired from five untreated (control) AML cell samples for comparison. An optical scattering calibration reference was used for normalizing all signals measured from cell samples and tumors to maintain consistency between experiments and to remove systematic errors. The use of a calibration reference for spectrum normalization was adopted from ultrasound spectral analysis methods developed by Lizzi et al.30. The calibration reference was prepared from a silicone base mixed with titanium dioxide as the scattering agent, at a concentration of . Reference measurements were collected at each data acquisition to remove system effects. 2.3.Data AnalysisA structural B-mode image was generated for each data set acquired from a 2-D imaging plane by computing the inverse fast Fourier transforms (IFFT) of the digitized interference signals and calculating the magnitude of the complex IFFT outputs. As shown in Fig. 1, from each B-mode image, a region of interest (ROI) covering a depth of and a lateral distance of was selected for analysis. The lateral dimension was chosen to give approximately 100 A-lines per B-mode image. The axial dimension was chosen to coincide with the depth of focus of the system and begins at approximately below the sample/tumor surface to avoid any specular reflections. Fig. 1(a) Region of interest (ROI) selection. B-mode optical coherence tomography (OCT) image of an acute myeloid leukemia (AML) cell sample. (b) The selected analysis ROI is outlined by a dashed gray line. Scale bar indicates . Representative mean depth profile (black solid line, left -axis) of AML cell sample. Axial depth of selected ROI indicated by dotted lines. Calibration reference peak intensity (circular markers, right -axis) measured at multiple axial distances indicates system focal properties.  For each 2-D imaging plane, backscatter spectra were generated from each of the 100 individual A-lines contained within the selected ROI by calculating the fast Fourier transforms (FFT) of the corresponding complex time-domain signals. Normalized power spectra were calculated by normalizing the squared magnitude of these spectra by the square of the spectrum computed from the titanium dioxide optical calibration reference (see Fig. 2). The resulting 100 normalized power spectra were averaged to generate a mean, normalized backscatter power spectrum. This resulted in a total of 10 mean normalized power spectra per sample, one for each 2-D ROI selected. Each of the 10 average normalized backscatter power spectra was then individually integrated over the bandwidth of the light source to compute an IB. Integrating over all wavelengths provides a wavelength average of the backscatter power. Within the same bandwidth region, a linear regression was performed, as shown in Fig. 2, to fit each normalized spectrum to a line, from which the SS was obtained. This resulted in 10 IB and SS measurements for each sample or tumor imaged. Fig. 2Data analysis. (a) OCT backscatter power spectra from a selected ROI for a calibration reference and an AML cell sample. (b) AML backscatter power spectrum normalized to the calibration reference with corresponding linear regression.  Due to the limited number of sample points contained within the selected ROIs, the spectral resolution in the calculated backscatter spectra was reduced to 3 nm. We do not expect this loss in resolution to significantly affect our results, since we are primarily interested in measuring changes in the SS. In the case where the detection of high-frequency spectral oscillations were of interest, more advanced signal processing methods would be required to preserve the spectral resolution. 2.4.Histological ValidationImmediately after the completion of OCT imaging, cell samples and tumors were fixed in 10% formalin for 48 h and subsequently processed for hematoxylin and eosin (H&E) to observe cell morphology. Tumor sections were also processed for terminal deoxynucleotidyl transferase dUTP nick end labeling (TUNEL) to confirm apoptosis. Microscopy was carried out using a Leica DM LB microscope, and digital images were acquired with the Leica DC 200 digital imaging system (Leica Microsystems GmbH, Germany). Digital images obtained from H&E and TUNEL sections were used to observe cell and nuclear structure and to confirm apoptosis. 2.5.Statistical AnalysisFor each in vitro cell sample, a set of average parameters was calculated for each of the 10 ROIs. Statistical significance for the spectral parameters was determined for each treated sample relative to the control using a Kruskal–Wallis (nonparametric) test with Dunn’s multiple comparisons test. When comparing mean spectral parameter values acquired from untreated controls in vitro and in vivo, a two-tailed Mann–Whitney (nonparametric) test was used. The Kruskal–Wallis test with Dunn’s multiple comparisons test was used to compare the in vivo spectral parameter means from the responder and nonresponder groups to the control group, as well as to compare the responders from the two different treatment groups (chemotherapy-only and chemotherapy combined with radiation) to the control group. Statistical significance was determined using . 2.6.Mie Theory PredictionsIn order to interpret the experimental OCT spectra, backscatter cross sections representing particle sizes and refractive indices relevant to biological cells were calculated based on Mie theory. MiePlot version 4.5 (Philip Laven, Geneva, Switzerland) was used to calculate the Mie-predicted backscatter efficiency, , as a function of wavelength for particles in size ranges representing mitochondria and nuclei. Nuclei were modeled as spherical particles ranging in size from 4 to . This range of sizes was chosen to represent nuclei in viable AML cells (approximately ) as well as condensed and fragmented nuclei in apoptotic cells. Sphere diameters ranging from 0.2 to were used to represent the length () and width () of mitochondria, as well as smaller spheres to represent mitochondrial fragmentation. An index of refraction of 1.37 was used for cytoplasm, 1.39 for nuclei, and 1.42 for mitochondria.31 The scattering cross section, , was calculated by multiplying by the physical cross section of the spherical particle and was plotted as a function of wavelength. 3.Results3.1.In Vitro Cell-Death Monitoring3.1.1.Treatment response in vitroRepresentative H&E-stained sections obtained from AML cell samples are shown in Fig. 3. No significant morphological changes were observed in the histological slides for samples treated from 0 to 12 h. These samples displayed rounded cell shapes and large nuclei occupying the majority of the cell volume, as are normally seen in viable AML cell cultures. Significant nuclear condensation and fragmentation are present in the 24-h sample [Fig. 3(e)]. Signs of more advanced apoptosis, such as cellular fragmentation and irregular cell shapes indicative of cell blebbing, were observed in the 48-h samples. The areas, which are void of cells (white spacing) visualized in the 24 and 48-h slides [Figs. 3(c) and 3(d)], are due to a retraction artifact resulting from fixation and are not indicative of the cell packing in the samples at the time of imaging. Fig. 3Cell morphological changes in response to treatment. H&E-stained sections of cell samples after (a) 0 h (control), (b) 12 h, (c) 24 h, and (d) 48 h of treatment. Significant nuclear condensation and fragmentation are visible at 24 and 48 h. The area outlined by the black rectangle in (c) is shown at higher magnification in (e). Here, the presence of condensed and fragmented cell nuclei is evident. Scale bars indicate 20 μm. 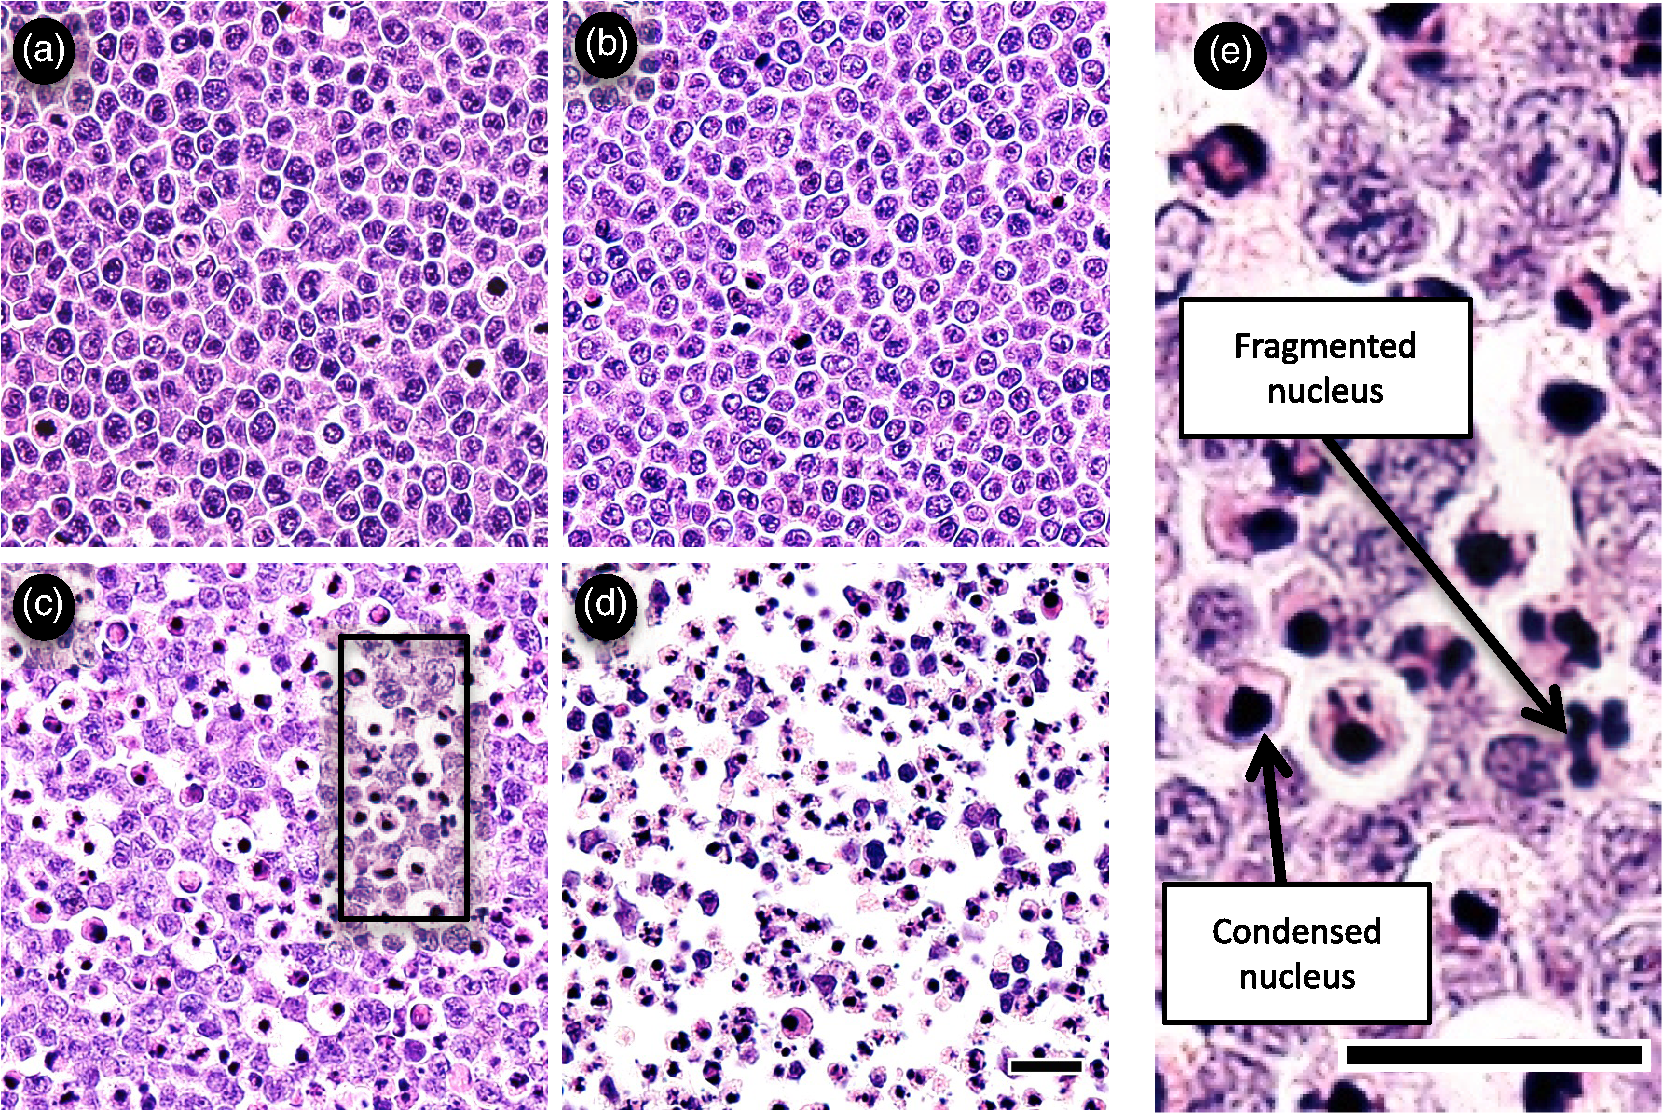 3.1.2.Spectroscopic parameters in vitroRepresentative mean backscatter spectra acquired from cell samples treated with cisplatin over the course of 48 h are plotted and compared to an untreated sample in Fig. 4(a). Differences in the overall magnitude and slope of the average spectra from treated cells are observed as early as 6 h. The variability in spectral curves acquired from a given sample is shown in Fig. 4(b), where backscatter power spectra from 10 individual ROIs for control and treated (24 h) samples are plotted along with their respective mean spectrum. Fig. 4Backscatter spectra from AML cell samples. (a) Average normalized backscatter spectra and corresponding linear regressions from AML cell samples treated with cisplatin over a period of 48 h compared to the control sample (bold curve). (b) Backscatter spectra from individual ROIs (gray curves) compared to the overall mean spectrum (bold black curves) for control and treated (24 h) AML cell samples. 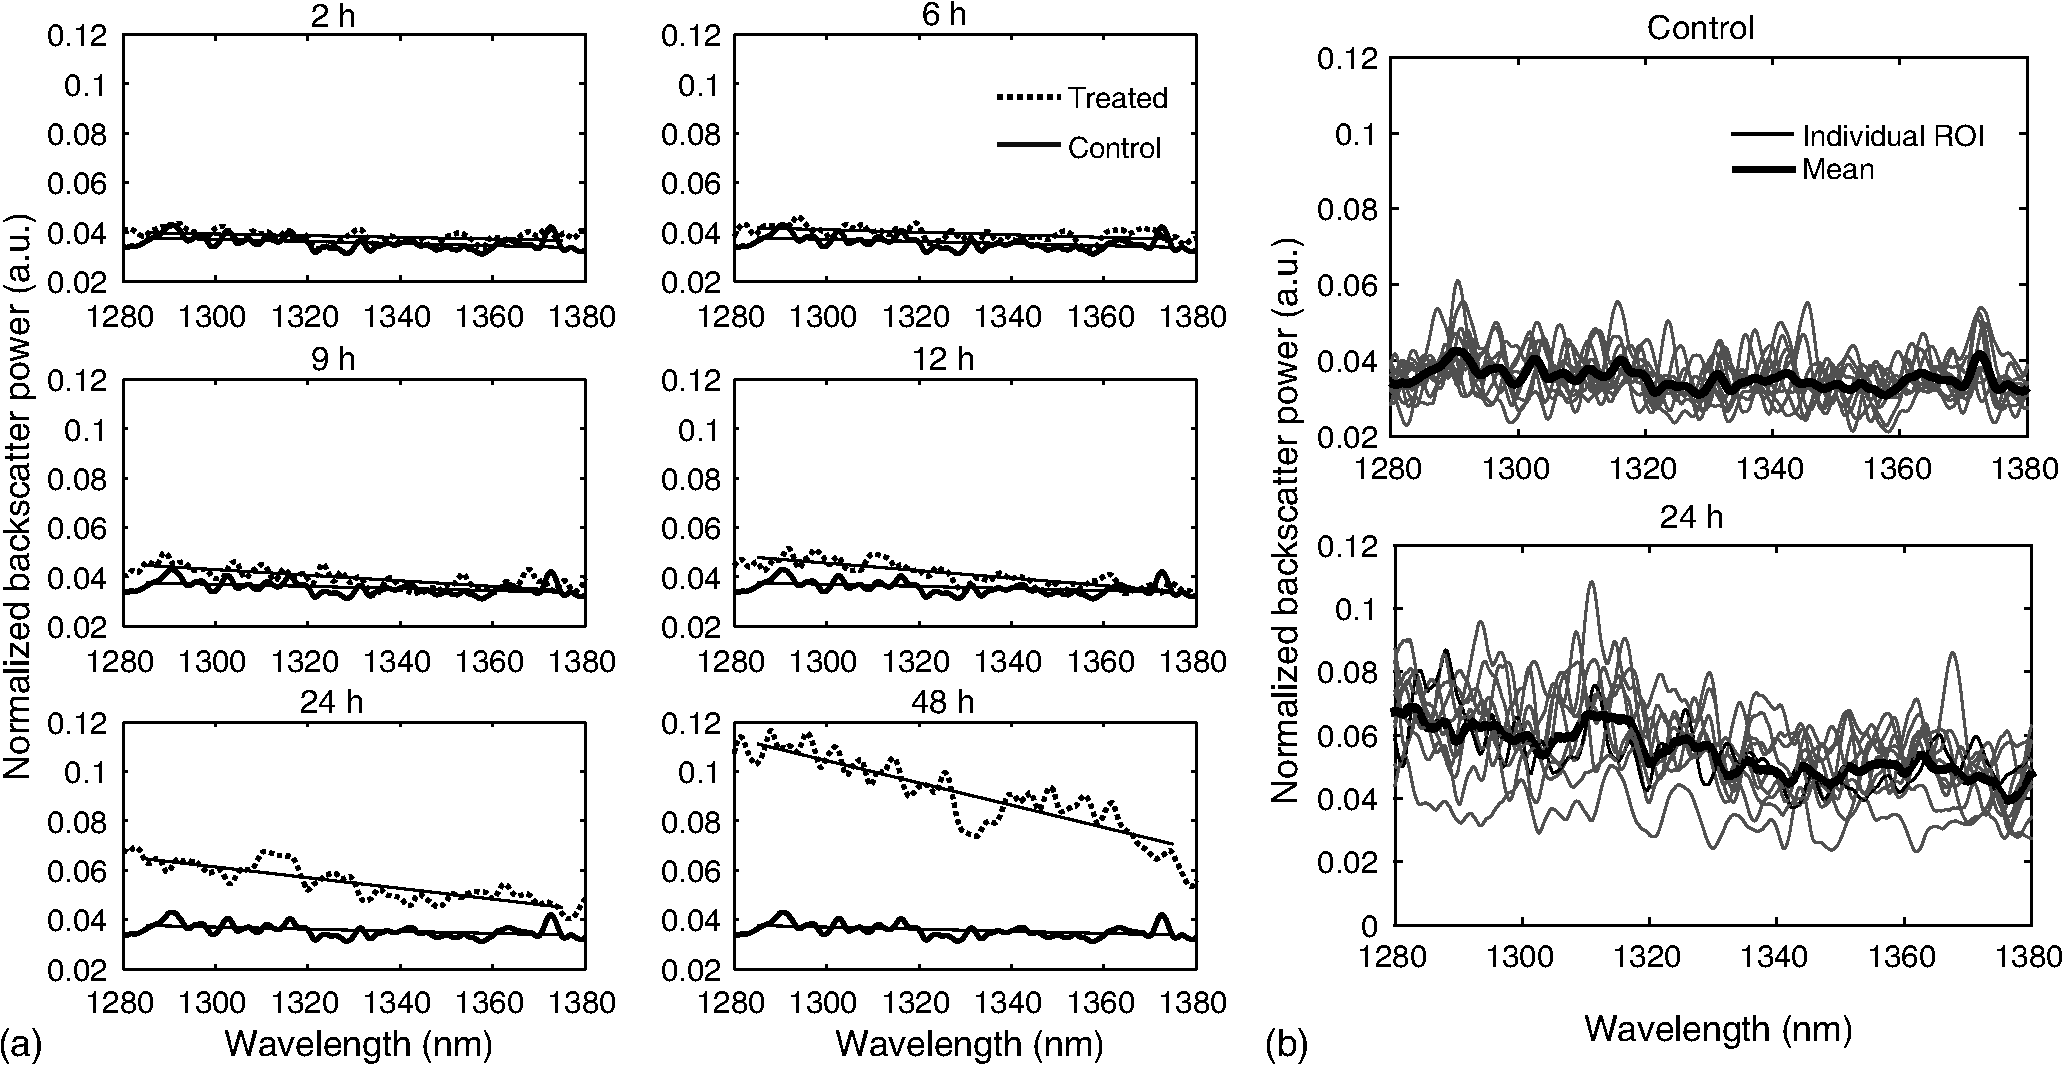 Both spectral parameters (IB and SS) changed significantly during the in vitro time-course experiment. The average change in parameter values calculated from the two separate experimental runs is plotted in Figs. 5 and 6, and values from each individual experiment are tabulated in Tables 1 and 2. Here, each parameter value consists of the average from 10 individual 2-D ROIs with the error indicating the standard deviation. The parameter value for each ROI was determined from 100 spectra corresponding to the A-scans contained in the selected ROI. Fig. 5Integrated backscatter measured from in vitro samples. (a) Average change in integrated backscatter (IB; error bars represent the standard error). IB values obtained from individual experiments are summarized in (b) with each curve representing a separate experiment and each data point representing the average of 10 measurements within a single sample (error bars represent the standard deviation).  Fig. 6Spectral slope measured from in vitro samples. (a) Average change in spectral slope (SS; error bars represent the standard error). SS values obtained from individual experiments are summarized in (b) with each curve representing a separate experiment and each data point representing the average of 10 measurements within a single sample (error bars represent the standard deviation). 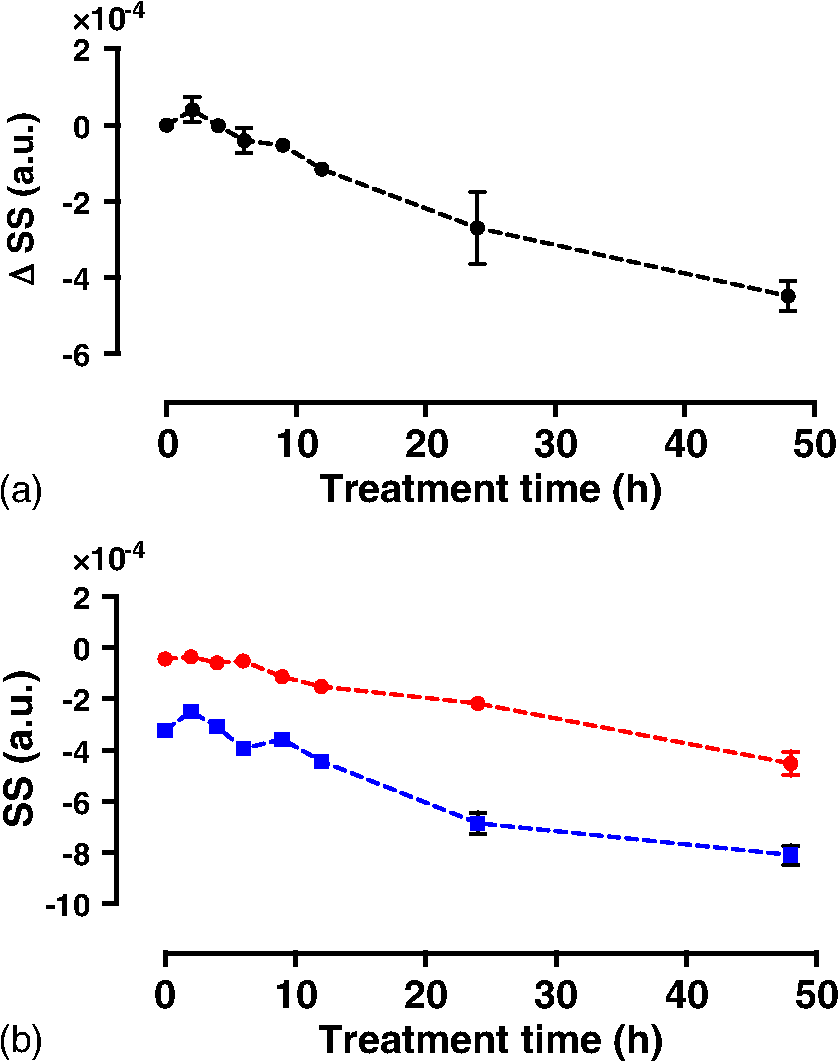 Table 1In vitro integrated backscatter for two sets of time-course experiments (G1 and G2). Each value represents the mean of 10 separate measurements from within a single cell sample.
*p-value determined by Kruskal–Wallis nonparametric test with Dunn’s multiple comparisons test. The mean of each sample was compared to the mean of the control sample (0 h). p-value was adjusted for multiple comparisons. Table 2In vitro spectral slope values for two sets of time-course experiments (G1 and G2). Each value represents the mean of 10 separate measurements from within a single cell sample.
*p-value determined by Kruskal–Wallis nonparametric test with Dunn’s multiple comparisons test. The mean of each sample was compared to the mean of the control sample (0 h). p-value was adjusted for multiple comparisons. IB values increased consistently with treatment duration, more than doubling by 48 h with statistically significant increases observed as early as 9 h after the start of treatment. SS decreased by 2.5-fold over 48 h. Here, a significant drop in SS value was observed after as early as 9 h of cisplatin exposure. Results from the individual experiments are plotted in Figs. 5(b) and 6(b). Here, each point represents the average parameter value obtained from 10 measurements within a single cell sample with error bars indicating the standard deviation. Of the two parameters, IB exhibited the least amount of variability between the experimental runs and indicated a slightly earlier sensitivity to apoptosis. The SS measurements indicated repeatability in trend, with both cell cultures exhibiting a decrease in SS over 48 h. However, we observed a variation in the absolute SS values between the two groups. 3.2.In Vivo Tumor Model3.2.1.Variability in tumor growth and microstructureTumor growth was estimated by palpating the hind leg of each mouse. During surgery to remove skin overlying the tumor, we observed that eight mice failed to develop tumors. These animals were excluded from the study. Digital images acquired from H&E-stained tumor sections from the remaining animals also revealed a large variation in tumor microstructure both within a given tumor and between animals. Examples are highlighted in Fig. 7, where variations in tumor vasculature and cell organization are evident. We also observed cases in which the tumor cells had infiltrated neighboring muscle tissue [Fig. 7(b)]. The cases, where the tumor had infiltrated muscle tissue (five animals), or where the tumor microstructure was very heterogeneous (three animals), were eliminated from the study. After these exclusions, there remained a total of five animals in the control group, seven animals in the chemotherapy group, and two animals in the combination therapy group. The measurements obtained from these remaining animals are presented. Fig. 7Variability in AML tumor microstructure. (a) Highly cellular AML tumor with no remarkable microstructure variability. (b) Hind leg muscle with no tumor present (excluded from study). (c) Presence of vacuoles. (d) Striated cell organization and presence of abundant blood cells (excluded from study). (e) Tumor infiltrating muscle tissue (excluded from study). Scale bars indicate 200 μm.  3.2.2.Classification of treatment responseBased on a qualitative assessment of the histological data, the treatment response in the chemotherapy group was neither consistent across all animals, nor as strong as the response we previously observed in vitro. Due to the variability in the treatment response and in order to analyze the parameter results calculated from the treated tumors, we studied the tumor histology slides and classified each animal as either a “responder” or a “nonresponder.” Responders were identified as mice with TUNEL-positive tumors (indicated by the dark brown staining in Fig. 8) in which a significant number of cells displayed the characteristic morphological features of apoptosis such as nuclear condensation and fragmentation. The nonresponders exhibited viable appearing tumor cells with rounded cell shapes and nuclei occupying the majority of the cell volume, similar to what is seen in untreated tumors. This resulted in a total of seven animals being classified as responders and two as nonresponders. Representative H&E- and TUNEL-stained tumor sections are shown in Fig. 8 for responders to chemotherapy, responders to the combination therapy, and nonresponders. These images illustrate that the treatment response in the combination therapy group was stronger, as indicated by the greater number of cells with condensed and fragmented nuclei. 3.2.3.Spectroscopic parameters in vivoMean spectral parameter values for individual tumors along with control in vitro cell samples are plotted in Fig. 9. Each data point represents the average of 10 ROIs from a single tumor/sample with error bars indicating the standard deviation. A larger variability in parameter values is observed between the in vitro control samples compared to the control tumors, while the opposite is true for the variability within each sample (indicated by smaller error bars for the in vitro parameters). The variability of parameter values within and between the responding tumors is markedly larger than the control and nonresponding tumors. Fig. 9Spectral parameter values (a) IB and (b) SS for individual cell samples and tumors. Abbreviations: C, control; R, responders; and NR, nonresponders. Each point represents the mean parameter value calculated from 10 measurements within a single sample/tumor. Error bars indicate the standard deviation. Parameter values from in vitro control samples are included for comparison.  We compared OCT parameters (IB and SS) acquired from untreated AML tumors to those from control AML cell samples to determine whether our in vivo results would be consistent, and therefore comparable, with in vitro measurements from the same cell line. The IB and SS calculated from in vivo tumor data and in vitro cell samples are plotted in Fig. 10. Fig. 10Spectral parameters (a) IB and (b) SS measured in control cell samples (in vitro) and tumors (in vivo). Here, for both in vivo and in vitro results. Each bar represents the mean of the parameter values for each control group indicated in Fig. 9. Error bars represent the standard error of the mean. The difference in parameter means between the in vivo and in vitro groups was not statistically significant as determined by a Mann–Whitney (nonparametric) test with (-values indicated on graphs).  The spectroscopic parameters were consistent between in vivo and in vitro measurements with IB values of and and SS values of and , respectively. This indicates that, despite variations in tumor microstructure, the presence of blood flow and extracellular structures, we can obtain consistent results using these parameters. Statistical analysis confirmed no significant difference between the two groups. Average parameter values for the treated tumors are plotted in Figs. 11(a) and 11(b) with the results grouped by treatment response. Average IB values were significantly higher in the responders group when compared to the control and nonresponders groups (, , and , respectively). The increase in IB relative to the controls was statistically significant for the responders group, but not for the nonresponders group. The parameter averages for the responders group were further separated by treatment type, plotted in Figs. 11(c) and 11(d). Average IB values of and were calculated for the chemotherapy and the combination therapy groups, respectively. The increase in IB relative to the controls was statistically significant for the chemotherapy group, but not the combination therapy group. Other OCT-based parameters provided further discrimination, however. Fig. 11Mean in vivo IB and SS values. Abbreviations: C, control; R, responders; NR, nonresponders; R-Ch, responders receiving chemotherapy; and R-Cb, responders receiving combination therapy. (a) IB and (b) SS shown for control tumors () compared to responders () and nonresponders (). (c) IB and (d) SS separated by treatment type shown for control (), responders to chemotherapy (), and responders to combination therapy (). Each bar represents the mean of the parameter values for each group indicated in Fig. 9. Error bars represent the standard error of the mean. Statistical significance was determined by the Kruskal–Wallis (nonparametric) test with Dunn’s multiple comparisons test. Each group was compared to the control group. -values were adjusted to account for multiple comparisons. Statistical significance is indicated by an asterisk (*) and corresponds to .  The average SS was lower in the responder group compared to the control and nonresponders (, , and , respectively). The differences, here, were not statistically significant; however, the trends agree with those from in vitro experiments. Once separated by treatment type [Fig. 11(d)], it became apparent that the decrease in SS was due to a significantly lower SS value for the combination therapy () responders, while the SS for responders in the chemotherapy group () was similar to the control average. Here, the drop in SS for the combination group relative to the control was confirmed to be statistically significant. To better understand the differences in spectral parameters between the chemotherapy-treated responders and the combination-therapy-treated responders, the mean backscatter power spectra for individual tumors were plotted (Fig. 12). Relative to the control, the backscatter power from the chemotherapy group was higher, to some degree, across all wavelengths. The backscatter power from the combination therapy group, however, was larger at shorter wavelengths but smaller at longer wavelengths. This explains how the SS could increase markedly while the change in IB remained insignificant. It should be noted that with our in vitro studies, the treatment time points that resulted in significant SS changes also resulted in a significant rise in IB. 3.3.Mie SimulationsBackscatter cross section as a function of wavelength is plotted in Fig. 13 for particles with sizes and indices of refraction similar to cell nuclei and mitochondria. The spectra indicate that changes in nuclear and mitochondrial size may contribute to variations in SS and overall backscatter intensity. High-frequency oscillations are not observed in these spectra. 4.DiscussionThis study has demonstrated that OCT spectroscopic parameters are sensitive to subcellular morphological changes related to apoptosis both in vitro and in vivo. In vitro data provided an understanding of how the temporal dynamics of apoptosis affects OCT parameters. The in vivo results demonstrated the feasibility of using spectroscopic OCT to assess cell death in a preclinical model and highlighted some of the limitations and challenges associated with this technique. Our in vitro results indicated an increase in IB in the cisplatin-treated cell samples. These results were repeatable between two experimental runs. Both the IB values and the change in IB were consistent between experiments. The most significant change in IB was noted at 24 to 48 h after the start of treatment, and the largest variability of measurements was observed at 24 h. These observations correspond to the time at which structural changes of the cells were most striking in the H&E-stained sections from the same samples. IB is a wavelength average of the backscatter power spectrum and provides a relative measure of the backscattering efficiency of the probed sample volume. Several cell morphological changes were observed in the apoptotic cell samples that could modify scattering efficiency. These include nuclear condensation, nuclear fragmentation, and cell fragmentation. Furthermore, in samples where significant apoptotic features were observed, the spatial organization of the nuclei was also altered. Whereas in the untreated samples the cells were tightly packed and, consequently, distributed in an organized manner, in the treated samples where nuclei were condensed and fragmented, their spatial distribution appeared to be more random and heterogeneous. All of these changes may cause variations in measured OCT signals by affecting the size, optical properties, and spatial distribution of the underlying scatterers. The IB is influenced by optical attenuation within the sample. To obtain an absolute measure of the backscattering efficiency, a correction would have to be made to account for attenuation. Since we are primarily interested in measuring relative changes in optical properties of tissues before and after treatment, we have not included the attenuation correction in our current study. Such a correction would be particularly important in applications, where absolute measures were required such as characterization of vulnerable plaques in the arteries, or early cancer detection. It should be noted that a recent study20 has demonstrated variations in the attenuation coefficient in cell samples undergoing apoptosis, and we believe that the methods presented in our study could be strengthened with the addition of attenuation correction in the future. The SS parameter decreased as a function of treatment time in vitro. While the change in SS was consistent between experiments, we observed a slight difference between the absolute values of the SS. The cells used in this study originated from a single frozen stock; however, the cells for each individual experiment were cultured separately. It is possible to see slight variations in cell morphology from one cell culture to another, particularly in a transformed cell line that divides rapidly, thus increasing the probability of genomic variability. This may explain the difference in SS values between the two experiments. As with the IB parameter, the SS changed significantly at 24 to 48 h after the start of cisplatin treatment, corresponding to significant morphological changes in the cell nucleus. We expect a change in SS with apoptosis due to a reduction in scatterer size caused by fragmentation of organelles such as mitochondria and nuclei. Based on Mie theory, for a given wavelength range and scattering angle, the shape of the backscattered spectrum will be determined by the size and relative refractive index of the scatterers. Consequently, the SS will depend, in part, on scatterer size of the dominant scatterers in the pellets/tissues. In an elastic light scattering spectroscopy study by Mulvey et al.,19 a decrease in the negative slope of the backscatter spectrum in the 500 to 750 nm wavelength region was correlated with an overall decrease in dominant scatterer size. The relation between scatterer size and wavelength-dependent scattering, as described by Mie theory, is complex. Spectral characteristics vary from one wavelength range to another; therefore, we would not necessarily expect the SS to change in an identical way at 1300 nm. Results from our Mie calculations presented in Sec. 3.3 indicated that spheres similar in size and refractive index to nuclei and mitochondria give rise to backscatter cross sections which vary slowly and, for the most part, monotonically as a function of wavelength within the bandwidth of our OCT light source. Therefore, as shown in Fig. 13, a change in the size of subcellular scatterers could affect both the slope and the overall magnitude of the backscatter spectrum. This supports the use of SS and IB as parameters for detecting morphological changes related to apoptosis. However, the Mie predictions account for changes in particle size only. We also know that the condensation and fragmentation of nuclei and mitochondria result in a number of other modifications in the underlying scatterers in tissue. These include changes in the refractive index of scatterers resulting from the condensation of the nucleus and cytoplasm as well as changes in the overall number of scatterers and their spatial organization. Such phenomena are far more complex and difficult to model than variations in particle size. Yet, they are likely to contribute in a significant way to the OCT signal. A simulation study which measured the effects of scatterer spacing and organization on the ultrasound backscatter signal determined that an increase in randomization of scatterers contributed significantly to increases in ultrasound backscatter intensity.32 A light scattering study33 measuring the fractal dimension of the scattering profiles of cells undergoing apoptosis has also determined that subcellular organization contributes to scattering changes. Specifically, this study pointed to changes in mitochondrial subcellular organization as the cause of early scattering effects and the nucleus as the cause of late scattering effects. These studies support our hypothesis that variations in the spatial organization of subcellular scatterers contribute to changes in the OCT signal. Finally, a wavelength-dependent light scattering study34 of cells undergoing apoptosis attributed early changes in the scattering spectrum, in part, to cytoplasmic water loss. Apoptosis is a dynamic process with kinetics that can vary significantly between cell types, treatment types, and even different batches of cells from the same cell line. The time-course experiment in this study permitted us to observe the kinetics of this process and to correlate changes observed in our measurements with the various stages of apoptosis. For both IB and SS, small changes were observed at shorter treatment times (2 to 12 h). It is known that one of the first morphological changes observed during apoptosis is the fragmentation and deterioration of the mitochondrial network.35 Early changes observed in the spectral parameters could be related to mitochondrial fragmentation. The most significant changes in the parameters were observed 24 to 48 h after treatment. The H&E-stained sections shown in Figs. 3(c) and 3(d) indicated significant modification of nuclear structure in this time period. Several studies36–38 have suggested that mitochondria may be one of the dominant scatterers with OCT imaging. However, light scattering techniques have also been used successfully to detect variations in nuclear size.17 It is therefore reasonable to assume that the changes observed in the 24 to 48 h time window could be related to changes in the nuclear structure.39 The kinetics of cisplatin-induced apoptosis are affected by the length of the cell cycle as well as the specific pathway involved in triggering the apoptotic process. Cell cycle dynamics and the specifics of a given apoptotic pathway cannot be ignored when developing methods for cell-death monitoring.40 The timing of the apoptotic response of AML cells to cisplatin treatment has previously been characterized in our laboratory as part of detailed high-frequency ultrasound studies.9,23 Given our familiarity with the dynamics of this in vitro cell-death model, we developed an in vivo AML tumor model to demonstrate the feasibility of in vivo cell-death detection using spectroscopic OCT. To the best of our knowledge, this is the first time this tumor model has been used in monitoring studies in combination with radiation therapy and/or a cisplatin/dexamethasone treatment. It is not a conventional tumor model—AML cells rarely form solid tumors—however, it provided an opportunity to implement an in vivo model that could be directly compared to previous detailed in vitro studies. The larger variability of measured parameter values between the in vitro control samples (compared to tumors) was unexpected given the highly controlled environment in which in vitro studies are conducted. However, it must be noted that all the tumors in this study were grown from the same batch of cells in culture, while in vitro measurements were collected over a period of over 12 months, each from a different batch of cells. The variability in measurements within each sample is much smaller in vitro, compared to tumors. This is explained by the homogeneity of cells and their spatial organization in each individual sample compared to tumors, in which some heterogeneity in tissue structure is inherent. In vitro cell samples lack the extracellular matrix and vasculature present in tumors, which could affect the spacing and organization of cells. Furthermore, cells in culture are maintained in a highly controlled growth environment and are mixed prior to cell sample preparation. We expect any variations in cell size or cell cycle to be distributed evenly throughout the cell sample volume. In tumors, however, a cell’s proximity to blood vessels and other extracellular components could induce gradients in these morphological characteristics. A comparison of the overall mean of the spectral parameters obtained from control AML cell samples and tumors indicated good agreement between in vitro and in vivo quantitative OCT measurements. This finding suggests that AML cells, even in the presence of blood cells, blood vessels, and other extracellular tissue components, are responsible for the bulk of the OCT signal in these tumors. In the treated tumors, we observed an increase in variability of parameter values both between and within tumors in the “responders” group. This was expected due to the heterogeneity in tumor response between animals as well as the heterogeneity in cell morphologies caused by apoptosis within each tumor, respectively. Results from the treated tumors indicated an increase of IB with the presence of morphological features associated with apoptosis. This trend agrees with our in vitro results. However, the IB was slightly lower for the treatment responders who received the combination therapy (the increase was not statistically significant relative to the controls), despite the histological slides indicating substantially more cell death. Although we expected the IB to be higher in tumors with more cell death, it is reasonable to assume that in tissue with a large number of apoptotic cells, the overall scatterer volume within the tumor is reduced due to the removal of apoptotic bodies and cellular debris by phagocytic cells—a phenomenon that does not occur in vitro. The SS values decreased for all responders; however, the change was not statistically significant in tumors treated with chemotherapy only. This result is not unexpected given the weak treatment response in this group. The decrease in SS observed with the in vitro cell samples was correlated with a significant number of cells in the late stages of apoptosis (24 to 48 h after treatment), similar to what was observed in vivo with the combination of chemotherapy and radiation. It is also known that in addition to apoptosis, some irradiated cells may undergo mitotic catastrophe41 characterized by multinucleated cells and nuclear fragmentation.24 We expect the scattering properties of cells undergoing mitotic catastrophe to be different from those undergoing apoptosis due to the difference in the morphological features in the cell. However, our analysis of the H&E-stained tumor sections did not indicate any clear evidence of mitotic catastrophe in contrast to apoptosis in the irradiated tumors. In this study, we elected to exclude tumors that presented with a great deal of heterogeneity, either in the form of tumor cells invading muscle tissue or with significant areas of heterogeneous vasculature or cell organization. While heterogeneous tumor structure is a realistic expectation in a clinical setting, we insisted on maintaining consistency between animals in this early feasibility study. Due to the limited penetration depth of OCT, our tumor model required the removal of skin overlying the tumor prior to imaging. We did not image the same animal on consecutive days in order to avoid complications from scar tissue formation over the tumor area. We are currently exploring more superficial tumor models that would avoid the step of skin removal. This would have the added benefit of permitting longitudinal imaging, with which we could compare the spectral parameters before and after treatment in a single animal. This type of longitudinal study would also allow us to include animals with large tumor heterogeneity, since we would be measuring relative changes to the spectral parameters versus the absolute values of these parameters. 5.ConclusionsIn summary, we have demonstrated that spectroscopic parameters derived from OCT data are sensitive to cell morphological changes caused by apoptosis in vitro and in vivo. In vitro AML cell death experiments with known kinetics allowed us to correlate IB and SS values with characteristic morphological features of apoptosis resulting from exposures to cisplatin ranging from 0 to 48 h. Both IB and SS changed significantly after 24 to 48 h, coinciding with striking morphological changes in the cells and their nuclei. Smaller changes were seen at shorter treatment times, which may correlate with earlier apoptotic events such as disruption of the mitochondrial network and their fragmentation. A comparison of spectral parameters from untreated cell samples and tumors demonstrated a good agreement between in vitro and in vivo measurements. The IB increased for all responding tumors—though more significantly in the chemotherapy versus the combination-therapy-treated tumors. The SS decreased in responding tumors, and most significantly in tumors undergoing combination therapy. Despite the limitations of our in vivo tumor model, such as large tumor microstructure variability and the inability to conduct longitudinal measurements, this study has demonstrated the feasibility of using spectroscopic OCT for in vivo treatment monitoring. Future work will include more detailed in vitro experiments to correlate specific cell morphological features to spectral parameter changes. Based on the demonstration of feasibility for in vivo imaging in this study, an implementation of a more superficial tumor model would permit an assessment of the effect of tumor microstructure variability and the longitudinal characterization of treatment response in tumors. AcknowledgmentsThe authors would like to acknowledge Dr. Adrian Mariampillai, Dr. Victor Yang, Dr. Carry Sun, Dr. Azza Al-Mahrouki, Priscilla Lai, Christina Kim, and Maurice Pasternak for their scientific advice and technical contributions. This work was supported by the Canadian Institutes of Health Research. Michael C. Kolios holds a Tier 2 Canada Research Chair in Biomedical Applications of Ultrasound. Gregory J. Czarnota holds a James and Mary Davie Research Chair in Breast Cancer Imaging and Ablation from the University of Toronto and a Research Chair in Experimental Therapeutics and Imaging from Cancer Care Ontario. ReferencesG. Makin and J. A. Hickman,
“Apoptosis and cancer chemotherapy,”
Cell Tissue Res., 301
(1), 143
–152
(2000). http://dx.doi.org/10.1007/s004419900160 Google Scholar
S. H. Kaufmann and W. C. Earnshaw,
“Induction of apoptosis by cancer chemotherapy,”
Exp. Cell Res., 256
(1), 42
–49
(2000). http://dx.doi.org/10.1006/excr.2000.4838 ECREAL 0014-4827 Google Scholar
F. Ferreira et al.,
“Apoptosis: target of cancer therapy,”
Clin. Cancer Res., 8 2024
–2034
(2002). Google Scholar
J. C. Mills,
“Mechanisms underlying the hallmark features of the execution-phase of apoptosis,”
Adv. Cell Aging Gerontol., 5 1
–38
(2001). http://dx.doi.org/10.1016/S1566-3124(01)05001-5 Google Scholar
S. Meisamy et al.,
“Neoadjuvant chemotherapy of locally advanced breast cancer: predicting response with in vivo 1H MR spectroscopy—a pilot study at 4 T,”
Radiology, 233
(2), 424
–431
(2004). http://dx.doi.org/10.1148/radiol.2332031285 RADLAX 0033-8419 Google Scholar
F. J. Esteva and G. N. Hortobagyi,
“Can early response assessment guide neoadjuvant chemotherapy in early-stage breast cancer?,”
J. Natl. Cancer Inst., 100
(8), 521
(2008). http://dx.doi.org/10.1093/jnci/djn098 JNCIEQ Google Scholar
M. A. Pantaleo et al.,
“Conventional and novel PET tracers for imaging in oncology in the era of molecular therapy,”
Curr. Treat. Rev., 34 103
–121
(2008). http://dx.doi.org/10.1016/j.ctrv.2007.10.001 Google Scholar
A. Sadeghi-Naini et al.,
“Early prediction of therapy responses and outcomes in breast cancer patients using quantitative ultrasound spectral texture,”
Oncotarget, 5
(11), 3497
–3511
(2014). http://dx.doi.org/10.18632/oncotarget.1950 Google Scholar
M. C. Kolios et al.,
“Ultrasonic spectral parameter characterization of apoptosis,”
Ultrasound Med. Biol., 28
(5), 589
–597
(2002). http://dx.doi.org/10.1016/S0301-5629(02)00492-1 USMBA3 0301-5629 Google Scholar
R. M. Vlad et al.,
“Quantitative ultrasound characterization of responses to radiotherapy in cancer mouse models,”
Clin. Cancer Res., 15
(6), 2067
–2075
(2009). http://dx.doi.org/10.1158/1078-0432.CCR-08-1970 Google Scholar
A. Sadeghi-Naini et al.,
“Quantitative ultrasound evaluation of tumor cell death response in locally advanced breast cancer patients receiving chemotherapy,”
Clin. Cancer Res., 19
(8), 2163
–2174
(2013). http://dx.doi.org/10.1158/1078-0432.CCR-12-2965 Google Scholar
F. L. Lizzi et al.,
“Ultrasonic spectrum analysis for tissue evaluation,”
Pattern Recognit. Lett., 24 637
–658
(2003). http://dx.doi.org/10.1016/S0167-8655(02)00172-1 PRLEDG 0167-8655 Google Scholar
F. L. Lizzi et al.,
“Statistical framework for ultrasonic spectral parameter imaging,”
Ultrasound Med. Biol., 23
(9), 1371
–1382
(1997). http://dx.doi.org/10.1016/S0301-5629(97)00200-7 USMBA3 0301-5629 Google Scholar
L. R. Taggart et al.,
“Ultrasonic characterization of whole cells and isolated nuclei,”
Medicine, 33
(3), 389
–401
(2007). http://dx.doi.org/10.1016/j.ultrasmedbio.2006.07.037 Google Scholar
G. Farhat, G. Czarnota and M. Kolios,
“Detecting cell death with optical coherence tomography and envelope statistics,”
J. Biomed. Opt., 16
(2), 026017
(2011). http://dx.doi.org/10.1117/1.3544543 JBOPFO 1083-3668 Google Scholar
G. Farhat et al.,
“Detecting apoptosis using dynamic light scattering with optical coherence tomography,”
J. Biomed. Opt., 16
(7), 070505
(2011). http://dx.doi.org/10.1117/1.3600770 JBOPFO 1083-3668 Google Scholar
L. T. Perelman et al.,
“Observation of periodic fine structure in reflectance from biological tissue: a new technique for measuring nuclear size distribution,”
Phys. Rev. Lett., 80
(3), 627
–630
(1998). http://dx.doi.org/10.1103/PhysRevLett.80.627 PRLTAO 0031-9007 Google Scholar
A. L. Oldenburg, C. Xu and S. A. Boppart,
“Spectroscopic optical coherence tomography and microscopy,”
IEEE J. Sel. Top. Quantum Electron., 13
(6), 1629
(2007). http://dx.doi.org/10.1109/JSTQE.2007.910292 IJSQEN 1077-260X Google Scholar
C. S. Mulvey, C. A. Sherwood and I. J. Bigio,
“Wavelength-dependent backscattering measurements for quantitative real-time monitoring of apoptosis in living cells,”
J. Biomed. Opt., 14
(6), 064013
(2009). http://dx.doi.org/10.1117/1.3259363 JBOPFO 1083-3668 Google Scholar
F. J. Meer et al.,
“Apoptosis- and necrosis-induced changes in light attenuation measured by optical coherence tomography,”
Lasers Med. Sci., 25
(2), 259
–267
(2010). http://dx.doi.org/10.1007/s10103-009-0723-y Google Scholar
D. Tudor et al.,
“Non-invasive detection of early retinal neuronal degeneration by ultrahigh resolution optical coherence tomography,”
PLoS One, 9
(4), e93916
(2014). http://dx.doi.org/10.1371/journal.pone.0093916 POLNCL 1932-6203 Google Scholar
B. J. Vakoc et al.,
“Three-dimensional microscopy of the tumor microenvironment in vivo using optical frequency domain imaging,”
Nat. Med., 15
(10), 1219
–1224
(2009). http://dx.doi.org/10.1038/nm.1971 1078-8956 Google Scholar
G. J. Czarnota et al.,
“Ultrasound imaging of apoptosis: high-resolution non-invasive monitoring of programmed cell death in vitro, in situ and in vivo,”
Br. J. Cancer, 81
(3), 520
–527
(1999). http://dx.doi.org/10.1038/sj.bjc.6690724 BJCAAI 0007-0920 Google Scholar
R. M. Vlad et al.,
“Quantitative ultrasound characterization of cancer radiotherapy effects in vitro,”
Int. J. Radiat. Oncol. Biol. Phys., 72
(4), 1236
–1243
(2008). http://dx.doi.org/10.1016/j.ijrobp.2008.07.027 Google Scholar
D. B. Zamble and S. J. Lippard,
“Cisplatin and DNA repair in cancer chemotherapy,”
Trends Biochem. Sci., 20
(10), 435
–439
(1995). http://dx.doi.org/10.1016/S0968-0004(00)89095-7 TBSCDB 0968-0004 Google Scholar
G. J. Czarnota et al.,
“Ultrasonic biomicroscopy of viable, dead and apoptotic cells,”
Ultrasound Med. Biol., 23
(6), 961
–965
(1997). http://dx.doi.org/10.1016/S0301-5629(97)00067-7 USMBA3 0301-5629 Google Scholar
C. Bailey et al.,
“Detection of apoptotic cell death in vitro in the presence of Gd-DTPA-BMA,”
Magn. Reson. Med., 62
(1), 46
–55
(2009). http://dx.doi.org/10.1002/mrm.21972 MRMEEN 0740-3194 Google Scholar
C. Bailey et al.,
“Quantitative magnetization transfer studies of apoptotic cell death,”
Magn. Reson. Med., 66
(1), 264
–269
(2011). http://dx.doi.org/10.1002/mrm.22820 MRMEEN 0740-3194 Google Scholar
M. K. K. Leung et al.,
“High-power wavelength-swept laser in Littman telescope-less polygon filter and dual-amplifier configuration for multichannel optical coherence tomography,”
Opt. Lett., 34
(18), 2814
–2816
(2009). http://dx.doi.org/10.1364/OL.34.002814 OPLEDP 0146-9592 Google Scholar
F. L. Lizzi et al.,
“Theoretical framework for spectrum analysis in ultrasonic tissue characterization,”
J. Acoust. Soc. Am., 73
(4), 1366
–1373
(1983). http://dx.doi.org/10.1121/1.389241 JASMAN 0001-4966 Google Scholar
A. Dunn and R. Richards-Kortum,
“Three-dimensional computation of light scattering from cells,”
IEEE J. Sel. Top. Quantum Electron., 2
(4), 898
–905
(1996). http://dx.doi.org/10.1109/2944.577313 IJSQEN 1077-260X Google Scholar
J. W. Hunt et al.,
“A model based upon pseudo regular spacing of cells combined with the randomisation of the nuclei can explain the significant changes in high-frequency ultrasound signals during apoptosis,”
Ultrasound Med. Biol., 28
(2), 217
–226
(2002). http://dx.doi.org/10.1016/S0301-5629(01)00494-X USMBA3 0301-5629 Google Scholar
K. J. Chalut et al.,
“Light scattering measurements of subcellular structure provide noninvasive early detection of chemotherapy-induced apoptosis,”
Cancer Res., 69
(3), 1199
–1204
(2009). http://dx.doi.org/10.1158/0008-5472.CAN-08-3079 Google Scholar
C. S. Mulvey et al.,
“Wavelength-dependent backscattering measurements for quantitative monitoring of apoptosis, part 2: early spectral changes during apoptosis are linked to apoptotic volume decrease,”
J. Biomed. Opt., 16
(11), 117002
(2011). http://dx.doi.org/10.1117/1.3644911 JBOPFO 1083-3668 Google Scholar
M. Karbowski and R. J. Youle,
“Dynamics of mitochondrial morphology in healthy cells and during apoptosis,”
Cell Death Differ., 10 870
–880
(2003). http://dx.doi.org/10.1038/sj.cdd.4401260 Google Scholar
S. Tang et al.,
“Imaging subcellular scattering contrast by using combined optical coherence and multiphoton microscopy,”
Opt. Lett., 32
(5), 503
–505
(2007). http://dx.doi.org/10.1364/OL.32.000503 OPLEDP 0146-9592 Google Scholar
J. R. Mourant et al.,
“Light scattering from cells: the contribution of the nucleus and the effects of proliferative status,”
J. Biomed. Opt., 5
(2), 131
–137
(2000). http://dx.doi.org/10.1117/1.429979 JBOPFO 1083-3668 Google Scholar
R. M. Pasternack, J. Y. Zheng and N. N. Boustany,
“Optical scatter changes at the onset of apoptosis are spatially associated with mitochondria,”
J. Biomed. Opt., 15
(4), 040504
(2010). http://dx.doi.org/10.1117/1.3467501 JBOPFO 1083-3668 Google Scholar
R. C. Taylor, S. P. Cullen and S. J. Martin,
“Apoptosis: controlled demolition at the cellular level,”
Nat. Rev. Mol. Cell Biol., 9
(3), 231
–241
(2008). http://dx.doi.org/10.1038/nrm2312 NRMCBP 1471-0072 Google Scholar
M. M. Pasternak et al.,
“Properties of cells through life and death—an acoustic microscopy investigation,”
Cell Cycle, 14
(18), 2891
–2898
(2015). http://dx.doi.org/10.1080/15384101.2015.1069925 1538-4101 Google Scholar
D. Eriksson and T. Stigbrand,
“Radiation-induced cell death mechanisms,”
Tumor Biol., 31
(4), 363
–372
(2010). http://dx.doi.org/10.1007/s13277-010-0042-8 Google Scholar
|
||||||||||||||||||||||||||||||||||||||||||||||||||||||||||||||||||||||||||||||||||||||||||||||||||