|
|
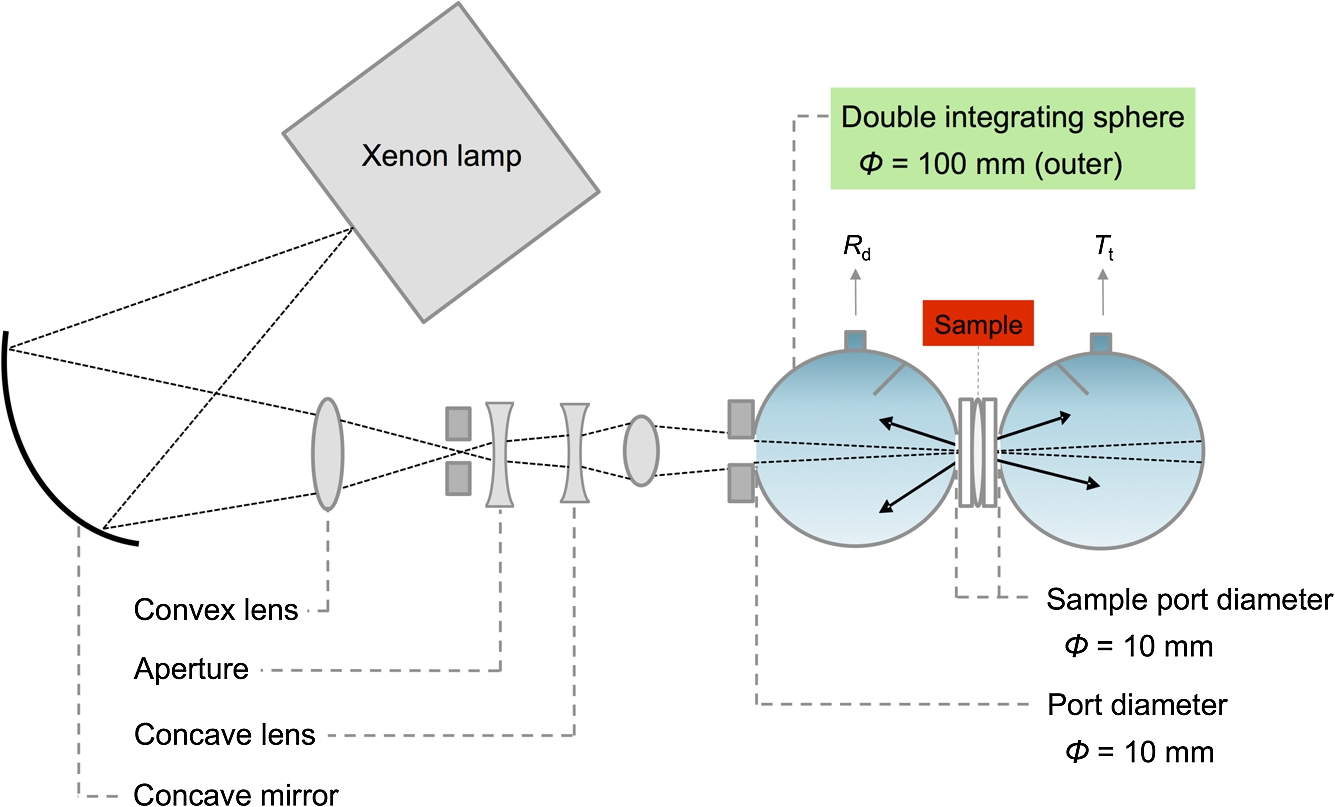
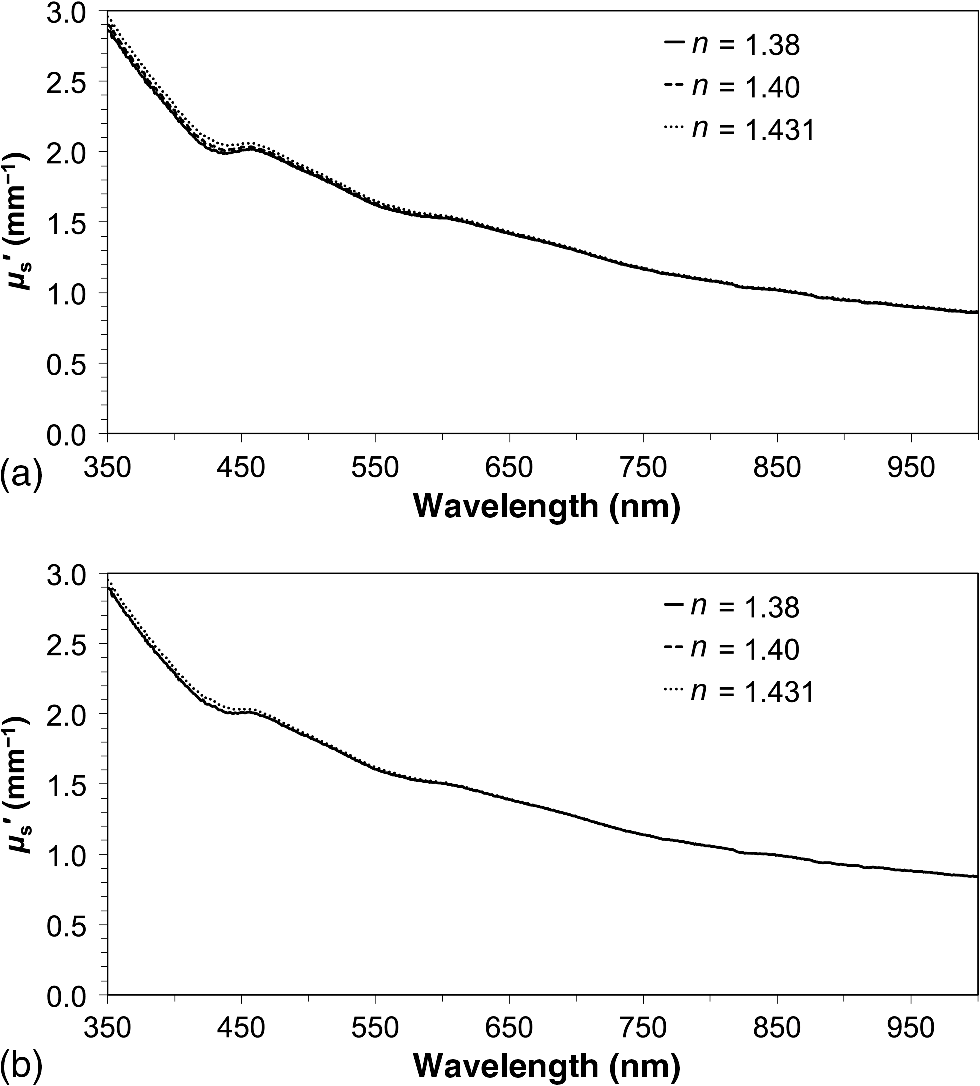
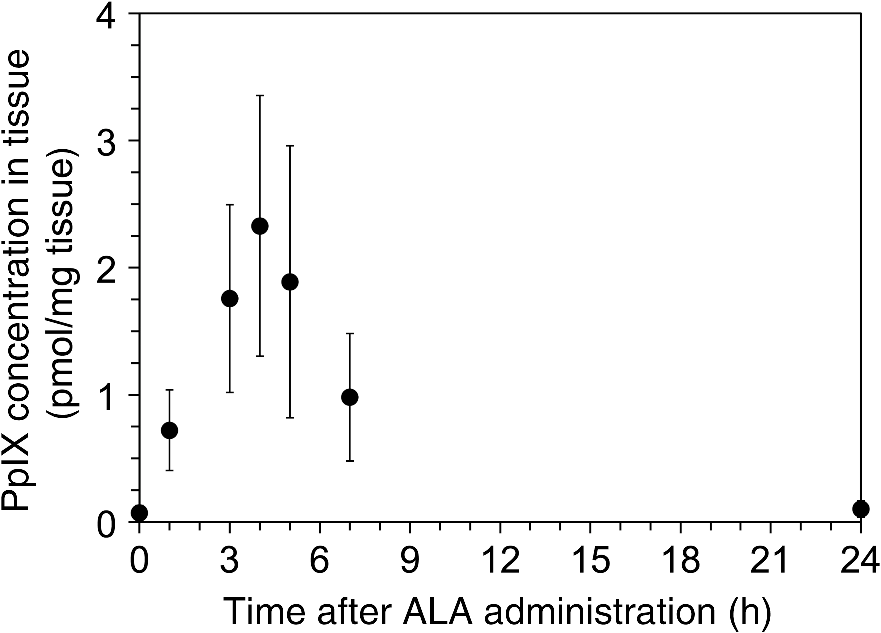
1.IntroductionPhotodynamic therapy (PDT) is a minimally invasive procedure that can selectively kill tumor tissues by producing singlet oxygen.1 Although conventional PDT uses lasers with a monochromatic emission, PDT2,3 using light emitting diodes (LEDs) is advantageous, due to its low cost, for example.4 We have been investigating various LED applications as low-cost light sources for PDT. However, because the broad spectral bandwidth emission of LEDs differs significantly from that of a laser, the optimal LED irradiation parameters (e.g., wavelength, irradiation power, and irradiation time for PDT) must be investigated based on the tissue optics. PDT response can be influenced by the factors such as photosensitizer concentration,5 oxygen supply, and fluence rate of light.6 One of the important factors of PDT7,8 is the spatial fluence distribution. The light propagation depends on the optical properties of the tissue [e.g., absorption coefficient (), scattering coefficient (), anisotropy factor (), and refractive index ()]. To help achieve adequate fluence distribution, optimal irradiation parameters must be investigated based on the tissue optics. The standard tumor model to assess the optimal PDT dose is tumor tissue grown in mice. However, ethical restrictions are making it more difficult to conduct animal experiments.9,10 Because an alternative approach to derive suitable PDT conditions will be needed in the near future, we have evaluated the validity of a tumor model prepared with tumor cells grown on the chorioallantoic membrane (CAM) of the chicken egg,11–15 which is called a “CAM tumor.” Due to its dense capillary network, CAM is commonly used to study in vivo new vessel formation (angiogenesis) and inhibition in response to different factors. The increased interest in a chick embryo as a model in biological and pharmaceutical research is related to its simplicity and affordability compared with mammalian models. CAM tumor model was reported more than 100 years ago.16 There are reports on the properties of CAM tumor models.12,13 The CAM is a natural immunological-deficient host17 and can accept transplantation of a variety of tissues.18 The research of the grafted tumor tissue on angiogenesis is reported.11 Vargas et al.14 reported mass development, angiogenesis, and infiltrative growth of CAM tumor tissue. CAM model can assay the vascular response. Blood vessel occlusion in implanted tumor on CAM was observed.12 There is a limitation of the CAM tumor model. CAM model cannot examine cancer-immune cell interactions, because the CAM is a natural immunological-deficient host.13 The CAM tumor model has been used for evaluation of the PDT efficiency. The anti-tumor outcome by the combination of PDT with anti-angiogenic drugs was monitored by Weiss et al.19 in the model of CAM tumor. Park et al.20 examined the PDT with hexenyl ester of 5-aminolevulinic acid in CAM tumor model. The research of the biological properties of CAM tumor has been conducted, and CAM tumor models have been used for PDT model as mentioned previously. To estimate the conditions suitable for PDT experiments employing the CAM tumor model, accurate light dosimetry is necessary, which requires that the light distribution in the desired tissue is understood. This can be realized using the optical properties of the tissue. The primary motivation for this work is that the optical properties of CAM tumor tissues have yet to be reported. The optical properties in the visible and near-infrared wavelength ranges must be studied, because various photosensitizers have absorption bands in this wavelength range.21 Herein, we prepared CAM and mouse tumor models and measured their optical properties in the 350- to 1000-nm wavelength range. By measuring different samples, the mean of the optical properties and variations in the wavelength range of interest were obtained. A double integrating sphere optical setup22–26 and an inverse Monte Carlo method24–29 were used to measure the optical properties of the samples. Additionally, the adequacy of CAM tumor model to evaluate the optimal irradiation conditions in PDT with LED was evaluated. 2.Materials and Methods2.1.Sample PreparationTumors implanted on the CAM of chicken eggs or on the back of female BALB/c mice were used as samples. Ten fertilized hen eggs (Goto Hatchery, Inc., Gifu, Japan) were incubated at 37°C. Here, the first day of incubation is defined as the first day of embryonic development. The EMT6 mouse breast cancer cell (CRL-2755, ATCC) was cultured in Waymouth’s MB 752/1 medium (11220-035, Life technologies) containing 10% fetal bovine serum (S1820, Biowest) and an antibiotic antimycotic solution () (A5955-100ML, Sigma-Aldrich). Cells were prepared at a concentration of for transplantation after removing part of the egg shell. A polytetrafluoroethylene ring was placed onto the part of the CAM that included the branch of the blood vessel on the 11th day of embryonic development. Immediately after excluding, of the tumor cell solution was dropped in the ring. The ring was removed on the 13th day of embryonic development. The measurement was conducted 8 days after tumor implantation on the CAM. Eight syngeneic female BALB/c mice (5 weeks of age) were used. The EMT6 tumor cells were prepared at a concentration of for injection. The mouse received subcutaneous injections of 0.1 mL cell suspension in the dorsal region using a 27-gauge needle. Sixteen days after implantation, the tumor was ready for measurements. To prepare the tissue, the mouse was euthanized by an overdose of anesthesia. The animal experimentation protocol was approved by the Animal Experiments Committee of Osaka University. The animal experiment was performed in accordance with the regulations on animal experiments established by the Animal Experiments Committee of Osaka University. The sample size is the number of individuals. Tumor tissues were resected and cut into 1-mm thick slices using surgical knives and scissors. Each section was sandwiched between slide glasses. The sample thicknesses of the tumor tissues were fixed at 1 mm using spacers. For a high-accurate calculation of optical properties with inverse Monte Carlo method, the sample thickness was adjusted for the reflectance and transmittance of the samples to be , which was the limit of detection sensitivity of the optical setup. 2.2.Integrating Sphere MeasurementsA double-integrating sphere system with an intervening sample was designed to measure the optical properties of biological tissues. This is a convenient tool, because it can measure diffuse reflectance () and total transmittance () simultaneously. Figure 1 schematically diagrams the optical properties measurement system, which uses a xenon light source [L2274(GS) and C8849, Hamamatsu Photonics K.K.]. The spheres equip with a light baffle between the detector port and the sample port. Samples were placed between two 100-mm outer diameter integrating spheres (CSTM-3P-GPS-033SL, Labsphere), which were made of a diffusely reflective material, Spectralon. The entrance port of reflectance sphere and the sample port for the spheres had 10-mm diameters. The beam-illuminated area on the sample had 1-mm diameter. The incident light was diffusely reflected from the sample surface and diffusely or directly transmitted through the sample. Then, the light was scattered in the spheres and transported through an optical fiber (CUSTOM-PATCH-2243142, Ocean Optics) to a spectrophotometer (Maya2000-Pro, Ocean Optics) as and . The average measurement integration time was 100 ms. Spectralon standards (Labsphere Inc.) were used to calibrate the diffuse reflectance spectrum. From the experimental data, the optical properties were calculated with the inverse Monte Carlo method as described in Sec. 2.3. 2.3.Inverse Monte Carlo MethodWe employed the inverse Monte Carlo technique to calculate the optical properties of the samples from the measured and values. The tissue’s optical properties were calculated for each wavelength point. The algorithm consisted of the following steps: (a) estimate a set of optical properties; (b) calculate the reflectance and transmittance with the Monte Carlo code developed by Wang et al.30; (c) compare the calculated results with the measured values of the and ; and (d) reiterate the above steps until the calculated and measured values agree within the specified acceptance margin of 99.5%. This iterative process yields the set of optical properties that most closely match the measured values of reflectance and transmittance of the tissue. The cross talk between the spheres was not taken into account. The optical properties measurement system has been calibrated by gel tissue simulation phantom that was prepared using hemoglobin powder as the absorber and Intralipid as the scatter.31 The of the hemoglobin was determined with a spectrophotometer (model U-3500, Hitachi). Different aliquots of hemoglobin solution were added to yield final of the gels at 403 nm of 0.3, 0.6, 1.2, and . Final range of the gels in the wavelength range from 350 to 1000 nm was 0.67 to . To validate the method for measuring the in combination of inverse Monte Carlo technique, the of latex sphere solution was measured. The theoretical of the solution was calculated from Mie theory. In these calculations, the anisotropy factor was fixed at 0.9 because this is the typical value in many tissues.32 Additionally, because the average refractive index of a single cell is 1.38 at the wavelength of 405 nm (as shown in Ref. 33), the refractive index was fixed at 1.38. To investigate the validity of the above working hypothesis, we evaluated the sensitivity to refractive indices and anisotropy factors. The optical properties were calculated using inverse Monte Carlo with different anisotropy factors and different refractive indices. We calculated at and 0.9 for , and 1.431 (as shown in Ref. 34). When considering a photon and several scattering events, the reduced scattering coefficient () can be defined35 to describe a multiple scattering process as (). In the inverse Monte Carlo method, the cross talk between the spheres was not taken into account because our estimation using the equation described by Pickering et al.36 showed that the increment of the signal by the cross talk between the spheres is under 0.1%. 2.4.Optical Penetration DepthTwo equations were used to calculate the optical penetration depth (). When , the can be estimated as37 When is comparable with (10 ), was estimated by using the following equation:382.5.Histological StudyHarvested CAM and mouse tumor tissues were fixed with a 20% buffered formalin solution (Mildform 20NM, Wako Pure Chemical Ind.) for 32 and 26 days, respectively. Then, the tumors were sliced through the plane with the largest tumor diameter, embedded in paraffin, and sectioned at . Histology slides were prepared at Genostaff Co. Ltd., Tokyo, Japan. Sections were mounted on glass slides, stained with hematoxylin and eosin (H&E), and scanned with a computerized image analyzer (NanoZoomer 2.0-RS, Hamamatsu Photonics K.K.). Image analysis was performed with NDP.Scan 2.5 software that accompanied the computerized image analyzer. The number of cell nuclei was ascertained from nine randomly selected locations in the H&E selection. Each location had a total area of . Cell diameter at the cut surfaces of the tissue is measured. The major axis of the cells in CAM and mouse tumor tissues was derived from 120 and 113 tumor cells, respectively. 2.6.Tissue Extraction and High-Performance Liquid Chromatography Analysis of Protoporphyrin IXCAMs with tumors were used in photosensitizer accumulation studies. Twenty-four samples were analyzed at time intervals ranging from 0 to 24 h following 5-aminolevulinic acid (ALA) administration. A 1-mg/egg i.v. dose of ALA was used in experiments involving the high-performance liquid chromatography (HPLC) analysis of extracted photosensitizer. To extract the protoporphyrin IX (PpIX) from tumors, tumors were homogenized in ice-cold phosphate buffered saline eight times the initial weight of the tissue using a sonicator (Vibra cell VCX130, Sonics & Materials, Inc.) for 30 s. The resulting homogenate was mixed with of 50% acetic acid and of -dimethylformamide (DMF)/2-propanol(IPA) (100:1 v/v). This mixture was vigorously shaken for 1 min and the phases were then separated by centrifugation. The supernatant was collected for PpIX analysis by HPLC. The pellet was suspended with of DMF/IPF, shaken for 1 min, and centrifuged again. The supernatant was collected. The supernatants obtained were mixed, and HPLC analysis was carried out using a HPLC system consisted of Alliance e2695 separations module and a model 2475 Multi-Wavelength Fluorescence Detector from Waters. HPLC grade solvents from Wako Pure Chemical Industries were used as the mobile phases. The PpIX extracted from tumor was dissolved in HPLC mobile phase [acetonitrile/10 mmol/L tetrabutylammonium hydroxide solution (7:3 v/v)]. HPLC separation was carried out at a flow rate of on a Capcell Pak C18 UG120 (4.6 mm i.d. ; particle size, ) column (Shiseido Co.) The column temperature was maintained at 40°C. The fluorescence was monitored at 630 nm with excitation set at 400 nm. 3.Results3.1.Optical Properties of Chorioallantoic Membrane and Mouse Tumor TissuesThe optical properties of CAM and mouse tumor tissues are measured with the double-integrating sphere optical setup and inverse Monte Carlo technique. Figures 2(a) and 2(b) show the calculated and spectra of the CAM and mouse tumor tissues, respectively. Hemoglobin absorption peaks occurred around 410 and 545 nm. In the wavelength range from 437 to 515 nm, the values of the CAM tumor tissues were significantly higher than those of mouse tumor tissues. The difference was most pronounced at the wavelength of 489.3 nm, which was and () for CAM and mouse tumor, respectively. For both models, the spectrum was greater at shorter wavelengths, had a maximum value of at the wavelength of 350 nm, and smoothly decreased over the wavelength range to at a wavelength of 1000 nm. Additionally, both spectral curves had similar slopes. Hence, the difference in the values of in the CAM and mouse tumor tissues was negligible. Fig. 2Absorption coefficient () and reduced scattering coefficient () spectra of chorioallantoic membrane (CAM) and mouse tumors in the wavelength range from 350 to 1000 nm: (a) absorption coefficient spectra and (b) reduced scattering coefficient () spectra. The error bars denote the standard deviation.  3.2.Sensitivity to Anisotropy Factor and Refractive Index of Inverse Monte Carlo MethodSensitivity to and of inverse Monte Carlo method was tested by the calculation with various and . Figure 3 shows the spectra of the CAM tumor tissue for and 0.9 for , and 1.431. Figure 4 shows the spectra of the CAM tumor tissue for and 0.9 for , and 1.431. The sensitivity to different anisotropy factors and refractive indices was a little in these anisotropy factor and refractive index ranges. 3.3.Optical Penetration DepthFigure 5 shows the optical penetration depth () derived from the data of and in Figs. 2(a) and 2(b). The CAM tumor tissue had a shorter than that of the mouse tumor tissue in the wavelength range of 451 to 512 nm (). The values of the CAM and mouse tumor tissues were linearly correlated with a correlation coefficient of 0.99, and the standard deviation of for the CAM tumor was same or less than that of the mouse tumor tissue in the wavelength range from 350 to 1000 nm. 3.4.Histological AnalysisFigure 6 shows the H&E staining section from the tumors. The numbers of cell nuclei in the CAM and mouse tumor tissues were and per , respectively. The CAM tumor tissue was significantly less dense than that of the mouse tumor tissue (). The major axis of the tumor cell in the CAM tissue ranged from 8.96 to (mean, ), whereas that in the mouse tissue ranged from 9.45 to (mean, ). Hence, the major axis of the 2 tumors did not significantly differ. Additionally, the CAM tumor tissue was similar to the mouse tumor tissue in that it has spindle-shaped tumor cells arranged in irregular intertwining bands. 3.5.Protoporphyrin IX Accumulation in Chorioallantoic Membrane Tumor TissuesMetabolic properties of PpIX were evaluated by HPLC analysis of photosensitizer extracted from tumor tissue. PpIX levels peaked at 4 h after i.v. administration of ALA (Fig. 7). 4.DiscussionThe CAM tumor model was developed as described previously, realizing similar optical properties as mouse tumor tissues. Hemoglobin39 and water40 absorption bands are observed in the spectra of mouse tumor tissues as well as CAM tumor tissues [Fig. 2(a)]. The spectra of CAM tumor tissues have an additional absorption band around the wavelength of 480 nm. PDT with the 480-nm light onto the CAM tumor tissue decreases the fluence by the absorber, including the CAM tumor tissue. The spectra of the CAM tumor tissue are analogous to those of mouse tumor tissues [Fig. 2(b)]. The data of can be fitted with the following equation:41 The wavelength dependence of the scattering is described in terms of the separate contributions of the Rayleigh and Mie scattering at the reference wavelength. The scaling factor equals at a wavelength of 500 nm. The Rayleigh scattering is and the Mie scattering is , where is the fraction of Rayleigh scattering, indicates the fraction of Mie scattering, and is the scattering power for Mie scattering. In the CAM tumor tissue, the levels of , , and are 1.80, 0.02, and 1.11, respectively. Figure 8(a) displays the data for CAM tumor tissues and the fit using the mean parameters for Eq. (3). The Mie scattering, which refers to scattering by particles comparable or larger than the wavelength of light, is predominant in CAM tumor tissues. As shown in Fig. 8(b), the levels of , , and in the mouse tumor tissue are 1.79, 0.03, and 1.05, respectively. Similar to the CAM tumor tissues, the Mie scattering is predominant in the mouse tumor tissues. We used a histological assessment by means of the H&E stain to visualize tumor cells grown on a CAM. The tumor involves cells and blood vessels. The Rayleigh scattering of light is caused by structures such as intracellular organelles. Mie scattering of light occurs when the structures are the same size scale as the wavelength of light.42 Rayleigh and Mie components may be practically identical in the tumor tissues. There are few differences in histological appearance between CAM and rat tumors.43 The major axis of cell in CAM tumor tissue statistically equates with those in mouse tumor tissues, providing evidence that the reduced scattering coefficients of the CAM and mouse tumor tissues are equal. Although the cell densities of the CAM and mouse tumor statistically differ, this difference may affect the PDT efficiency because the cellular accumulation of PpIX, which is one of the photosensitizers for PDT, is dependent on the cell density, according to the published report.44Fig. 8Reduced scattering coefficient () spectra of (a) CAM and (b) mouse tumor tissues. The fit dashed lines show the Rayleigh and Mie components of the fit.  The PpIX concentration in the CAM tumor tissues was at 4 h after administration of ALA. The of the PpIX at the concentration of is estimated at around at the wavelength of 635 nm. The absorption of PpIX does not significantly affect light propagation in tissue, because the dominant absorber is tumor tissues as shown in Fig. 2(a). Accumulated ALA-induced PpIX in mouse tumor tissue is in the micromole-per-liter range.45,46 The CAM model tumors accumulate the photosensitizer, PpIX, similar to the mice tumors model. The standard deviation of for CAM tumor tissues is the same or smaller that of the mouse tumor tissues (Fig. 5). These results imply that the fluence variations due to individual differences of CAM tumors are similar with those of mouse tumors. Accordingly, the optical intersubject variability of CAM tumor tissue is same or greater than that of mouse tumor tissue. These findings indicate that CAM tumor tissue is suitable as a tumor model. For example, the reproducibility of the results using the CAM tumor model should be similar to those of the mouse tumor model to determine the optimal irradiation conditions by investigating the PDT effects as a function of irradiation conditions. Consequently, the CAM tumor model is a viable alternative to the mouse tumor model and can derive the optimal irradiation conditions in PDT. 5.ConclusionThe optical properties of CAM tumor tissues were measured using double integrating spheres and inverse Monte Carlo techniques. In this study, the anisotropy factor and the refractive index of tissues were fixed at 0.9 and 1.38, respectively. The values of of the CAM tumor tissues in this study equate with those of mouse tumor tissues in the wavelength range from 350 to 1000 nm. Additionally, CAM and mouse tumor tissues have identical optical stabilities. Thus, a CAM tumor model is a sufficient tumor model to derive the optimal irradiation conditions for PDT. AcknowledgmentsThe authors would like to thank Chiaki Abe, PhD, for assisting with sample preparation. This work was supported by JSPS KAKENHI (Grant No. 15K16322). ReferencesA. P. Castano, T. N. Demidova and M. R. Hamblin,
“Mechanisms in photodynamic therapy: part three-photosensitizer pharmacokinetics, biodistribution, tumor localization and modes of tumor destruction,”
Photodiagn. Photodyn. Ther., 2
(2), 91
–106
(2005). http://dx.doi.org/10.1016/S1572-1000(05)00060-8 Google Scholar
M. H. Schmidt et al.,
“Evaluation of photodynamic therapy near functional brain tissue in patients with recurrent brain tumors,”
J. Neurooncol., 67
(1–2), 201
–207
(2004). http://dx.doi.org/10.1023/B:NEON.0000021804.50002.85 Google Scholar
N. J. Lowe and P. Lowe,
“Pilot study to determine the efficacy of ALA-PDT photorejuvenation for the treatment of facial ageing,”
J. Cosmet. Laser Ther., 7
(3–4), 159
–162
(2005). http://dx.doi.org/10.1080/14764170500344179 Google Scholar
L. Brancaleon and H. Moseley,
“Laser and non-laser light sources for photodynamic therapy,”
Lasers Med. Sci., 17
(3), 173
–186
(2002). http://dx.doi.org/10.1007/s101030200027 Google Scholar
A. W. de Blois et al.,
“In vivo pharmacokinetics of protoporphyrin IX accumulation following intracutaneous injection of 5-aminolevulinic acid,”
J. Photochem. Photobiol. B., 61 21
–29
(2001). http://dx.doi.org/10.1016/S1011-1344(01)00138-5 LAPHEJ 1054-660X Google Scholar
L. Lilge et al.,
“Transperineal in vivo fluence-rate dosimetry in the canine prostate during SnET2-mediated PDT,”
Phys. Med. Biol., 49 3209
–3225
(2004). http://dx.doi.org/10.1088/0031-9155/49/14/014 PHMBA7 0031-9155 Google Scholar
K. K. Wang et al.,
“Explicit dosimetry for photodynamic therapy: macroscopic singlet oxygen modeling,”
J. Biophotonics, 3
(5–6), 304
–318
(2010). http://dx.doi.org/10.1002/jbio.200900101 Google Scholar
L. Lilge et al.,
“Light dosimetry for intraperitoneal photodynamic therapy in a murine xenograft model of human epithelial ovarian carcinoma,”
Photochem. Photobiol., 68
(3), 281
–288
(1998). http://dx.doi.org/10.1111/j.1751-1097.1998.tb09682.x PHCBAP 0031-8655 Google Scholar
Nuffield Council on Bioethics, “The ethics of research involving animals,”
(2005) http://www.nuffieldbioethics.org/animal-research February 2013). Google Scholar
Y. Oue, A. Kamisato and H. Shiroyama,
“The comparison of the regulatory systems of animal experiments in United Kingdom and the United States of America—implications and proposals for future design of the regulation of animal experiment in Japan,”
Sociotechnica, 5 132
–142
(2008). http://dx.doi.org/10.3392/sociotechnica.5.132 Google Scholar
D. Ribatti et al.,
“The chick embryo chorioallantoic membrane as a model for in vivo research on angiogenesis,”
Int. J. Dev. Biol., 40
(6), 1189
–1197
(1996). IJDBE5 0214-6282 Google Scholar
M. S. Ismail et al.,
“Photodynamic therapy of malignant ovarian tumours cultivated on CAM,”
Lasers Med. Sci., 14
(2), 91
–96
(1999). http://dx.doi.org/10.1007/s101030050028 Google Scholar
N. A. Lokman et al.,
“Chick chorioallantoic membrane (CAM) assay as an in vivo model to study the effect of newly identified molecules on ovarian cancer invasion and metastasis,”
Int. J. Mol. Sci., 13
(8), 9959
–9970
(2012). http://dx.doi.org/10.3390/ijms13089959 1422-0067 Google Scholar
A. Vargas et al.,
“The chick embryo and its chorioallantoic membrane (CAM) for the in vivo evaluation of drug delivery systems,”
Adv. Drug Delivery Rev., 59
(11), 1162
–1176
(2007). http://dx.doi.org/10.1016/j.addr.2007.04.019 ADDREP 0169-409X Google Scholar
E. M. Bekes et al.,
“Activation of pro-uPA is critical for initial escape from the primary tumor and hematogenous dissemination of human carcinoma cells,”
Neoplasia, 13
(9), 806
–821
(2011). http://dx.doi.org/10.1593/neo.11704 Google Scholar
J. B. Murphy and P. Rous,
“The behaviour of chicken sarcoma implanted in the developing embryo,”
J. Exp. Med., 15
(2), 119
–132
(1912). http://dx.doi.org/10.1084/jem.15.2.119 JEMEAV 0022-1007 Google Scholar
A. M. Cimpean, D. Ribatti and M. Raica,
“The chick embryo chorioallantoic membrane as a model to study tumor metastasis,”
Angiogenesis, 11
(4), 311
–319
(2008). http://dx.doi.org/10.1007/s10456-008-9117-1 Google Scholar
D. O. DeFouw et al.,
“Mapping of the microcirculation in the chick chorioallantoic membrane during normal angiogenesis,”
Microvasc. Res., 38
(2), 136
–147
(1989). http://dx.doi.org/10.1016/0026-2862(89)90022-8 MIVRA6 0026-2862 Google Scholar
A. Weiss et al.,
“Low-dose angiostatic tyrosine kinase inhibitors improve photodynamic therapy for cancer: lack of vascular normalization,”
J. Cell. Mol. Med., 18
(3), 480
–491
(2014). http://dx.doi.org/10.1111/jcmm.12199 Google Scholar
J. H. Park et al.,
“Photodynamic therapy with hexenyl ester of 5-aminolevulinic acid induces necrotic cell death in salivary gland adenocarcinoma cells,”
Oncol. Rep., 24 177
–181
(2010). http://dx.doi.org/10.3892/or_00000843 OCRPEW 1021-335X Google Scholar
M. Ethirajan et al.,
“Photosensitizers for photodynamic therapy and imaging,”
Advances in Photodynamic Therapy, 13
–40 Artech House, Norwood, Massachusetts
(2008). Google Scholar
J. W. Pickering et al.,
“Double-integrating-sphere system for measuring the optical properties of tissue,”
Appl. Opt., 32
(4), 399
–410
(1993). http://dx.doi.org/10.1364/AO.32.000399 APOPAI 0003-6935 Google Scholar
G. de Vries et al.,
“The effect of light losses in double integrating spheres on optical properties estimation,”
IEEE J. Sel. Top. Quantum Electron., 5
(4), 944
–947
(1993). http://dx.doi.org/10.1109/2944.796315 IJSQEN 1077-260X Google Scholar
A. Roggan et al.,
“Optical properties of circulating human blood in the wavelength range 400–2500 nm,”
J. Biomed. Opt., 4
(1), 36
–46
(1999). http://dx.doi.org/10.1117/1.429919 JBOPFO 1083-3668 Google Scholar
T. L. Troy and S. N. Thennadil,
“Optical properties of human skin in the near infrared wavelength range of 1000 to 2200 nm,”
J. Biomed. Opt., 6
(2), 167
–176
(2001). http://dx.doi.org/10.1117/1.1344191 JBOPFO 1083-3668 Google Scholar
H. J. Wei et al.,
“Differences in optical properties between healthy and pathological human colon tissues using a Ti:sapphire laser: an in vitro study using the Monte Carlo inversion technique,”
J. Biomed. Opt., 10
(4), 044022
(2005). http://dx.doi.org/10.1117/1.1990125 JBOPFO 1083-3668 Google Scholar
M. Meinke et al.,
“Optical properties of platelets and blood plasma and their influence on the optical behavior of whole blood in the visible to near infrared wavelength range,”
J. Biomed. Opt., 12
(1), 014024
(2007). http://dx.doi.org/10.1117/1.2435177 JBOPFO 1083-3668 Google Scholar
M. Friebel et al.,
“Determination of optical properties of human blood in the spectral range 250 to 1100 nm using Monte Carlo simulations with hematocrit-dependent effective scattering phase functions,”
J. Biomed. Opt., 11
(3), 034021
(2006). http://dx.doi.org/10.1117/1.2203659 JBOPFO 1083-3668 Google Scholar
E. Salomatina et al.,
“Optical properties of normal and cancerous human skin in the visible and near-infrared spectral range,”
J. Biomed. Opt., 11
(6), 064026
(2006). http://dx.doi.org/10.1117/1.2398928 JBOPFO 1083-3668 Google Scholar
L. Wang, S. L. Jacques and L. Zheng,
“MCML-Monte Carlo modeling of light transport in multi-layered tissues,”
Comput. Methods Programs Biomed., 47
(2), 131
–146
(1995). http://dx.doi.org/10.1016/0169-2607(95)01640-F CMPBEK 0169-2607 Google Scholar
N. Honda et al.,
“Development of the tissue optical properties measurement system with double integrating sphere and inverse Monte Carlo technique in the visible and near-infrared wavelength range,”
J. Jpn. Soc. Laser Med., 32
(4), 421
–428
(2012). http://dx.doi.org/10.2530/jslsm.32.421 Google Scholar
“Optical properties of tissues with strong (multiple) scattering,”
Tissue Optics: Light Scattering Methods and Instruments for Medical Diagnosis, 3
–17 SPIE Press, Bellingham, WA
(2007). Google Scholar
B. Kemper et al.,
“Integral refractive index determination of living suspension cells by multifocus digital holographic phase contrast microscopy,”
J. Biomed. Opt., 12
(5), 054009
(2007). http://dx.doi.org/10.1117/1.2798639 JBOPFO 1083-3668 Google Scholar
“Methods and algorithms for the measurement of the optical parameters of tissues,”
Tissue Optics: Light Scattering Methods and Instruments for Medical Diagnosis, 143
–256 SPIE Press, Bellingham, WA
(2007). Google Scholar
“Scattering and absorption properties of diffusive media,”
Light Propagation Through Biological Tissue and Other Diffusive Media, 9
–28 SPIE Press, Bellingham, WA
(2010). Google Scholar
J. W. Pickering et al.,
“Two integrating spheres with an intervening scattering sample,”
J. Opt. Soc. Am. A, 9
(4), 621
–631
(1992). http://dx.doi.org/10.1364/JOSAA.9.000621 JOAOD6 0740-3232 Google Scholar
“Light-tissue interaction variables,”
An Introduction to Biomedical Optics, 121
–154 Taylor & Francis, London
(2007). Google Scholar
S. L. Jacques and S. A. Prahl,
“Limits of diffusion theory,”
(2015) http://omlc.org/classroom/ece532/class5/limits.html October ). 2015). Google Scholar
S. Prahl,
“Optical absorption of hemoglobin,”
(1999) http://omlc.ogi.edu/spectra/hemoglobin/index.html December ). 1999). Google Scholar
S. Prahl,
“Optical absorption of water,”
(1998) http://omlc.ogi.edu/spectra/water/index.html May ). 1998). Google Scholar
S. L. Jacques,
“Optical properties of biological tissues: a review,”
Phys. Med. Biol., 58 R37
–R61
(2013). http://dx.doi.org/10.1088/0031-9155/58/11/R37 PHMBA7 0031-9155 Google Scholar
P. R. Bargo et al.,
“In vivo determination of optical properties of normal and tumor tissue with white light reflectance and an empirical light transport model during endoscopy,”
J. Biomed. Opt., 10
(3), 034018
(2005). http://dx.doi.org/10.1117/1.1921907 JBOPFO 1083-3668 Google Scholar
T. Strojnik et al.,
“Experimental model and immunohistochemical comparison of U87 human glioblastoma cell xenografts on the chicken chorioallantoic membrane and in rat brains,”
Anticancer Res., 30
(12), 4851
–4860
(2010). ANTRD4 0250-7005 Google Scholar
S. L. Gibson et al.,
“-Aminolaevulinic acid-induced photodynamic therapy inhibits protoporphyrin IX biosynthesis and reduces subsequent treatment efficacy in vitro,”
Br. J. Cancer, 80
(7), 998
–1004
(1999). http://dx.doi.org/10.1038/sj.bjc.6690454 BJCAAI 0007-0920 Google Scholar
T. Ogasawara et al.,
“Influence of administration methods on the accumulation of ALA-induced Pp-IX in mouse tongue tumors,”
Oral Dis., 12
(4), 415
–419
(2006). http://dx.doi.org/10.1111/j.1601-0825.2006.01216.x Google Scholar
S. Iinuma et al.,
“Biodistribution and phototoxicity of 5-aminolevulinic acid-induced PpIX in an orthotopic rat bladder tumor model,”
J. Urol., 153 802
–806
(1995). http://dx.doi.org/10.1016/S0022-5347(01)67726-7 Google Scholar
Biography |