|
|
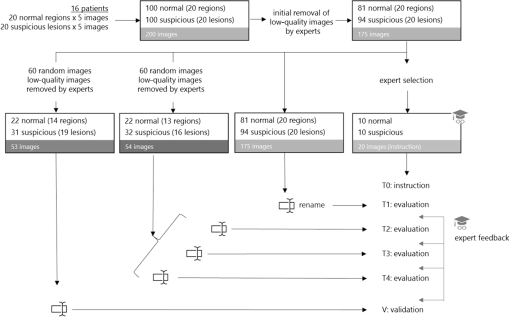
1.IntroductionOptical coherence tomography (OCT) is the optical equivalent of ultrasound, using light instead of sound to produce cross-sectional images of tissue. Resolutions up to 1 to can be achieved, which are 10 to 25 times higher than high-frequency ultrasound and approach that of microscopy, thus allowing tissue differentiation based on morphology. OCT images range to approximately 2 mm in depth: a limitation mainly due to light scattering, which causes a decrease of OCT signal magnitude with increasing depth. This decay of OCT signal is directly related to the optical properties of the tissue and is quantified by the attenuation coefficient . Several studies have shown that the quantitative analysis of the OCT-signal attenuation allows in vivo differentiation between dissimilar tissue types, for example, in retinal imaging1,2 and in cardiovascular plaque differentiation.3–5 In addition, in the kidney,6,7 in the upper urinary tract,8 in the bladder,9 and in axillary lymph node imaging,10,11 quantitative analysis of the OCT-signal attenuation has shown differences between normal tissue and cancerous tissue. In the gynecological clinic, quantitative OCT has been shown to be helpful in distinguishing normal vulvar tissue from vulvar intraepithelial neoplasia (VIN).12 VIN is a premalignant lesion that can develop into vulvar squamous cell carcinoma, which is the fourth most common gynecological type of cancer.13 VIN is diagnosed by punch biopsy, which is painful and may harm cosmetic appearance. Since VIN often recurs, and biopsies are required to determine the abnormality of the skin, some patients are required to undergo many biopsies throughout their lifetime. Quantitative analysis of the OCT signals may be an alternative method to distinguish VIN from normal vulvar skin.12 In the quantitative analysis, a mathematical model based on Beer’s law containing the attenuation coefficient and accounting for OCT system parameters, is fitted to the OCT signal in a user-selected region of interest (ROI). Clearly, correct region selection is important for accurate quantification of the OCT signal-derived . Because OCT and quantitative attenuation analysis are increasingly used as diagnostic tools in clinical research, information on the observer differences and learning curves associated with this analysis is needed. The aim of this study is to investigate the learning curve and the interobserver variance of quantitative OCT-imaging analysis of suspicious lesions of the vulva. Therefore, the of normal and suspicious vulvar lesions (including VIN lesions) was determined from OCT images acquired earlier at five time points by three students and by three OCT experts, who form a reference consensus. Previous analysis12 revealed a statistically significant difference between of healthy () and VIN (). We use the area under the curve of the receiver operating characteristic (ROC-AUC) as the primary metric for the learning of individual observers. In our previous study, a ROC-AUC of 0.95 was found. The interobserver differences between the three students are analyzed by a linear mixed effects model. Bland–Altman plots are used to compare the results of the three students to the consensus. 2.Materials and Methods2.1.Optical Coherence Tomography ImagingImaging of 20 suspicious vulvar lesions and normal appearing regions in 16 consecutive patients was previously performed12 with a commercially available swept-source OCT system (Santec Inner Vision 2000; 50-kHz A-line rate, axial resolution, lateral resolution, operating at 1300 nm). From every suspicious lesion and every normal region, five OCT images were acquired so that 100 OCT images of normal vulvar tissue and 100 OCT images of suspicious vulvar lesions were available for analysis. The size of OCT B-scans is 3 mm in the axial dimension and 15 mm in the lateral. After imaging, a punch biopsy of the suspicious vulvar lesions was taken for pathological evaluation. Histopathology was used as the reference standard. The study was approved by the Medical Ethical Committee of our institute and performed according to the Declaration of Helsinki. 2.2.Optical Coherence Tomography Data AnalysisThe OCT data were fitted with a single exponential decay model in which the amplitude () and decay coefficient () were the free running parameters and the offset noise () was fixed at the noise level derived from a region of the image where no tissue was present.14,15 The term accounts for attenuation due to the OCT system itself: the confocal point spread function and sensitivity roll-off in depth.14,15 This factor can be calibrated from an attenuation measurement on a very weakly scattering sample, in our case a 1000-fold dilution of Intralipid 20%. Note that using this method, water absorption is accounted for by . In our model, is a measure for the scattering of the tissue under study and a parameter to discriminate between normal vulvar tissue and diseased vulvar tissue. Within a cross-sectional OCT image, the epidermal layer appears as a dark gray band (Fig. 1). The OCT image of the tissue was straightened before selecting the ROI. In normal vulvar tissue, the investigator selected the ROI in this epidermal homogenous layer. In diseased vulvar tissue (with a visual suspicious lesion present), the ROI in the epidermal layer within the lesion was selected by the investigator. A digital record is stored for each analysis including geometrical coordinates of the chosen ROI in the image as well as all fit parameters and their 95% confidence intervals. This way, the OCT analysis can be reviewed a posteriori. Fig. 1Selection of the region of interest (ROI) and determination of accompanied value are shown in normal vulvar tissue (a) and in diseased vulvar tissue (b). The ROI is selected with green (vertical and horizontal) lines from the epidermal layer. The average intensity versus depth is plotted in the line graphs and is calculated from data between the vertical green lines. The region from which the signal is fitted is depicted by the horizontal green lines. 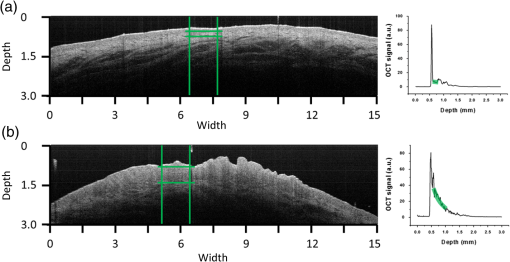 2.3.Study DesignOCT images were evaluated at five time points (T1, T2, T3, T4, V) by three students and a consensus team consisting of three experts [Daniel M. de Bruin (DMdB), Ronni Wessels (RW), and Dirk J. Fabers]. Prior to each time point, all images were renamed using nondescript random names to prevent name recognition. At T1, the expert team first excluded images with poor quality (e.g., low signal-to-noise ratio, out-of-focus, and saturation by specular reflection). Of the remaining 175 images (81 normal regions and 94 suspicious regions), consensus values were determined. Next, three medical students, with no prior OCT experience, were introduced to this technique and taught how to interpret OCT images and how to select the ROI and calculate the as described above. To gain familiarity with the OCT images and the analysis procedure, their assessment at T1 was performed on the complete dataset of 175 OCT images. The was subsequently determined at T2, T3, and T4 separated by 2 to 3 days by all three students and the expert consensus. These assessments were performed on a 60-image, randomly selected subset of the original dataset of the 175 images. The expert team reviewed the dataset to include only images that showed either clear normal or suspicious regions, after which 54 OCT images remained (22 OCT images from 13 normal regions and 32 OCT images from 16 suspicious lesions). After the fourth assessment, a validation (V) was performed on a newly randomly selected 60-image subset. After expert review, this set contained 53 OCT images (22 OCT images from 14 normal regions and 31 OCT images from 19 suspicious lesions). Figure 2 shows the study design. The students and experts were blinded for tissue-type (normal or suspicious) throughout the whole study. 2.4.Instructions and FeedbackTwo experts operated as instructors: one expert in the field of OCT in general (DMdB) and one physician experienced in vulvar pathology and OCT analysis (RW). Initially, the students received essential instructions from expert 1 on how to use the analysis software. Subsequently, the entire OCT assessment procedure was demonstrated using three randomly chosen OCT images. When the image contained a suspicious lesion, the students were instructed to select the “most suspicious” part of the epidermal layer. If the OCT image was taken from normal skin with normal appearing layered architecture, then they were told to select and analyze the most homogenous part of the epidermal layer. Between sessions, feedback was provided to the students by one of the instructors. Feedback consisted of reviewing four randomly chosen OCT images and performing analyses of these images of the students which were stored while performing the analysis. Based on that report, the students explained which region they selected to perform the analysis. Then one of the instructors presented which region he or she would select and how the would be determined. The results on the selected region and outcomes were compared and discussed. 2.5.Assessment of Learning: Statistical MethodsA ROC curve was constructed after each time point for each observer (students 1, 2, 3 and the consensus team). The ROC curve plots (1 − specificity) versus sensitivity of the discrimination between normal and diseased vulvar tissues with varying cutoff values for . The ROC-AUC quantifies the overall ability of the procedure to discriminate between normal and diseased vulvar tissues. Its value equals the probability that a randomly selected vulvar lesion will yield a higher value than a randomly selected normal vulvar tissue. As ROC analyses assume independent observations, only one scan per lesion, randomly chosen, was included in these calculations. Monte Carlo boot-strap sampling was performed to assess the variability due to scan selection and to provide confidence intervals on the ROC-AUC values. To estimate the mean of normal and diseased tissues, linear mixed effects models (containing both fixed effects and random effects) were constructed and applied at each of the five time points. When considering all values at a given time point, variance in values can be attributed to different causes, e.g., pathology status, variance due to the patient (e.g., caused by different skin types), and variance due to observer-related choices in the analysis. The models included pathology (normal versus diseased) as a fixed cause (it cannot vary because pathology is the reference standard). The so-called “random intercepts”—variable causes—are the variations between patients and observers. Therefore, a decrease in variance over time indicates convergence of values and can be regarded as a learning effect of the observers as a group. The ratio of the variance between lesions compared with the variance due to all sources can be found by computing the intraclass correlation coefficient (ICC). High ICC implies high repeatability of the measurements. An increase of the ICC can be indicative of the diminishing effect of differences between observers, in other words: of learning of the group. Bland–Altman type plots were constructed to compare the students’ values with those of the consensus for all five sessions. 3.ResultsFor each student and the consensus, ROC-AUCs were calculated. The medians and interquartile ranges (IQRs) of the ROC-AUCs for the three students and the consensus are presented in Table 1, Fig. 3, and Fig. 4. In Fig. 4, the solid line represents the median values, the boxes the IQRs, and the whiskers the smallest and the largest nonoutliers. Each data point outside the range of the whiskers is shown individually. The consensus has a very stable discrimination with accuracy around 0.80. Student 1 attained a greater accuracy at the last session (session 4) and the validation round (0.88 and 0.90, respectively). Student 2 performed quite well already at session 1 with an ROC-AUC of 0.78 (0.71 to 0.85), while the consensus had an ROC-AUC of 0.83 (0.77 to 0.89). Student 2 stayed at this level, but then performed worse on the validation set. Student 3 performed better at session 2 compared with 1, but declined in performance at sessions 3 and 4. At the validation set, however, ROC-AUC was 0.75 (0.69 to 0.82), which was only slightly worse than the consensus [ROC-AUC 0.81 (0.76 to 0.86)]. When looking at the validation session, students 1 and 3 performed better than at session 1, indicating that determination can, in principle, be learned rapidly after a short training session. The ability to differentiate between normal vulvar tissue and diseased vulvar tissue is also shown in ROC curves at each time point. Figure 5 presents these ROC analyses for the three students and the consensus. Table 1The median [interquartile range (IQR)] ROC-AUCs for the three students and the consensus group at each time point (T1–T4) and the validation set. Evaluation at T1 is performed on a 175-image dataset; and T2–T4 on a 54-image dataset, which was randomly renamed between sessions. The validation set consisted of 53 new randomly drawn images.
Fig. 3Learning curves. Graphical respresentation of the area under the curve of the receiver operating characteristic (ROC-AUC) of the consensus and students 1 to 3 at different time points shown in Table 1. 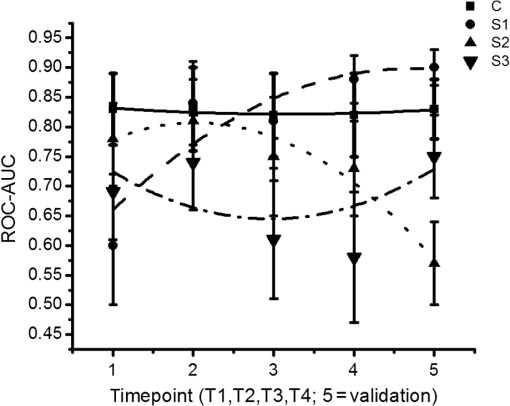 Fig. 4The median [interquartile range (IQR)] ROC-AUCs for the three students and the consensus group at each time point (T1–T4) and the validation set. Box = IQR; whisker = smallest and largest nonoutliers. Data-points are the points outside the whiskers. 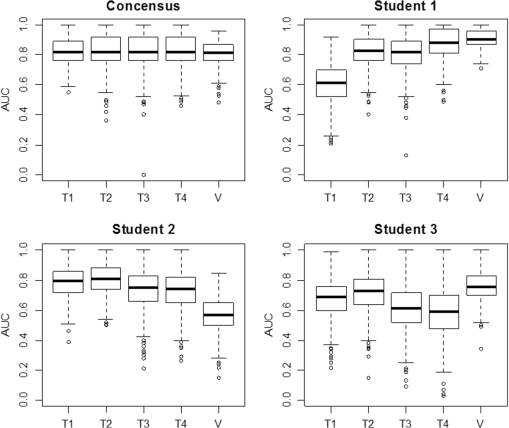 Fig. 5ROC curves at each time point (T1–T4) and the validation assessment for the three students (S1–S3) and the consensus group (C). 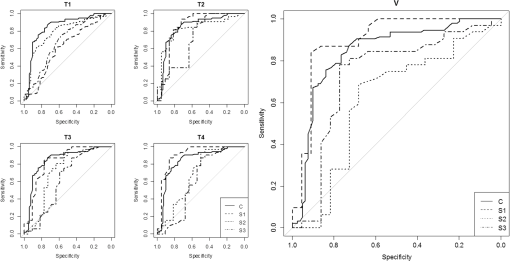 The mixed effects models show that the mean -value determined by the consensus group and three students pooled together remained stable over the five assessments for both the normal vulvar tissue samples () and for the diseased tissue samples (). The -values of normal vulvar and diseased vulvar tissues were significantly different at all five time points (). The median within-lesion variance of the three students (without the consensus group) in observed over the assessments for normal vulvar tissue was ; for diseased tissue, there was a notable reduction in variance in time . The within-lesion ICC for normal tissue samples for the five assessment time points was 0.25/0.21/0.19/0.14/0.25. For the diseased tissue samples, it was slightly higher, with the exception of the final validation assessment, 0.37/0.34/0.44/0.46/0.18. The difference in values between the consensus and the students is presented using Bland–Altman plots (Fig. 6) at the five different time points. All three students appeared better at estimating high values and worse at estimating low values of . Fig. 6Bland–Altman plots showing the differences between the student’s (S1–S3) calculated values and those of the consensus group at each of the four time points (T1–T4). The vertical axis depicts the difference between the values of the student and the values of the consensus group in . On the horizontal axis, the values of the consensus group (in ) are given. 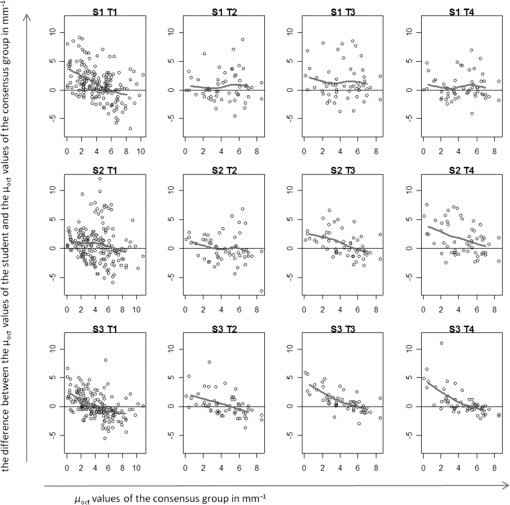 4.Discussion and ConclusionThe potential of OCT to discriminate normal from diseased tissues using quantification of optical properties has been demonstrated in a number of recent studies.6,7,9,12,16 Preferential clinical application of this technique is during diagnostic or therapeutic intervention, operated by the physician, providing real-time accurate assessment of tissue status. Because the currently used method requires operator-based choices (most importantly, the selection of a ROI), assessment of operator-induced variance in the tissue assessment is of great importance. The IDEAL framework17 describes the stages through which innovative interventional techniques normally pass upon clinical introduction: Idea (proof of concept), Development, Exploration (learning), Assessment, and Long-term study (surveillance). IDEAL characterizes all of these stages and recommends study design types for each. For applications other than ophthalmology and cardiology, OCT is currently in the Development/Exploration stage, which makes it opportune to conduct a learning study. In this study, we define “learning” as the increased ability to discriminate healthy from diseased tissue based on the OCT attenuation coefficient. For this purpose, we used the area under the ROC-AUC as the primary metric of learning, where higher values indicate better discrimination. From the ROC curves, we conclude that forming a consensus between experienced observers results in repeatable differentiation of normal vulvar tissue from diseased vulvar tissue based on (ROC-AUC of , see Table 1). This indicates that using expert consensus as a benchmark is indeed feasible in this type of learning study. Student 1 performed almost at the same level as the consensus (in assessments 2 and 4, even better). On the contrary, student 2 showed a decline in ROC-AUC, indicating less accurate tissue classification. Student 3’s results were constant, yet consistently below the consensus results. Interestingly, the performance of student 3 declined during the training period, but was again closer to the consensus in the validation round. Assessments at time points T2, T3, T4 were performed on a fixed, 54-image subset of the primary dataset, where the images were randomly renamed between each session. An image-based “memorizing effect” may have taken place, leading to an artificial stabilization of the (because students remember which ROI they selected previously). We expect this effect to be more pronounced for “diseased” images where the epithelial layers are thicker compared with normal epithelium. Thus “memorized” selection of the ROI is easier for diseased tissues. On the other hand, repeated assessment of gray-scale images as in this study may lead to “analysis fatigue” resulting in less accurate ROI determination which would particularly influence the smaller ROIs associated with normal tissue. Evidence of either, which are essentially psychological effects, are not clearly found from Table 1, Fig. 3, or Fig. 4, but can be investigated in future studies by repeated evaluation of carefully designed layered phantoms.14 We constructed linear mixed effects models to estimate means and variances between normal and diseased tissues. The mean values, averaged over all observers (consensus + students 1 to 3), were stable over all time points for both normal and diseased tissues, which again indicates the value of consensus measurements. To further quantify the learning process, we analyzed the variance of the values of the students alone. Of specific interest is the development from the last training session (T4) to the validation round (V) where the dataset under analysis was changed. For normal tissue, the within-tissue variance slightly decreased (from 4.1 to ), indicating convergence of the assessments over all observers (students 1 to 3). Correspondingly, the within-tissue ICC increased (the proportion of variance attributable to tissue variation), implying stable variance due to observer influence. On the other hand, the within-tissue variance for diseased tissue increased (from 1.1 to ), again indicating convergence of the assessment over all observers while ICC decreased from 0.46 to 0.18. The latter finding implies increased variance due to observer influence which we consider to be consistent with the decrease in the performance of student 2. Bland–Altman plots were constructed to show the difference between each student’s assessment and consensus, versus consensus. For all students, the difference was higher for smaller values of the attenuation coefficient. Normal tissue samples generally showed smaller values of than diseased samples; moreover, the ROI selection of normal tissue is complicated by the generally thinner epithelial layer. In time, student 1 showed improvement in assessing lower (normal) attenuation coefficients, resulting in overall improvement in discrimination as expressed by increased ROC-AUC. The performance of student 2 to assess lower (normal) values of decreased in time. Interestingly, the ability of student 3 to assess high values of the attenuation coefficient (diseased tissue) slightly increased during the training rounds, whereas the ability to assess low values (normal tissue) slightly decreased leading to stable, but low, ROC-AUC over time. This overestimation of low values of compared with the consensus values might be attributed to the fact that thinner layers have fewer pixels to which the signal can be fitted, therefore, the determination of the attenuation coefficient of thinner layers is less accurate than for thicker layers. We demonstrate this using an increasing layered stack of -thick silicone elastomer-based optical phantom building blocks developed following the recipe described in Ref. 14. Using an 800-nm OCT system with an axial resolution of , we find that thinner phantoms give larger variances in determined attenuation coefficients (see Fig. 7). Fig. 7OCT image of a phantom with various layer thicknesses. The graph shows fitted attenuation coefficients versus layer thickness. The vertical axis depicts the values with the standard deviation of the different phantoms in the upper picture. On the horizontal axis, the thickness of the phantoms is given. 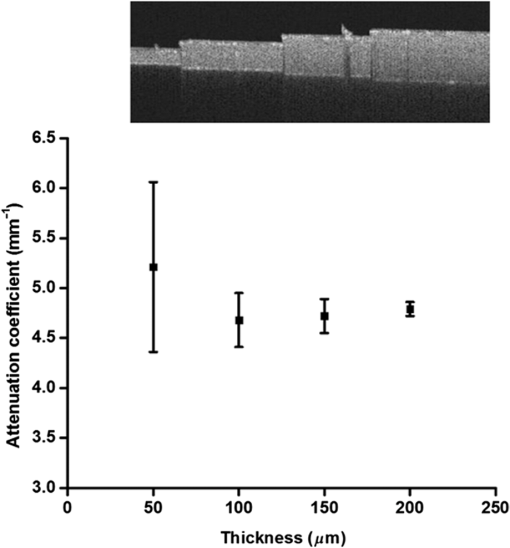 5.Implications and PerspectiveOur study shows that OCT attenuation analysis can be learned after a few training and feedback sessions. All students improved from T1 (instruction) to T2. After T2, their results diverged, but from the decrease of the ICC, we see that operator-induced variance remains a dominating factor. For large-scale clinical studies (IDEAL stages 3 to 5), automatic analysis of OCT data will be a practical necessity given the large amount of data to be analyzed. Automatic analysis may in part overcome the difficulties described here. Several strategies are possible, ranging from segmentation algorithms borrowed from ophthalmic application to delineation of (thin) layers to “per-pixel” assessment of the attenuation coefficient as recently proposed by Vermeer et al.18 Improvement of the analysis using these approaches remains to be evaluated by extensive benchmarking against manual assessment, preferably by expert consensus. We conclude that the technical procedure for determination for tissue classification does not require extensive training since all observers improved in performance after one training and feedback cycle. Paramount, however, to reduce observer-induced variance, is accurate identification of suspected lesions within the OCT images. Analysis of diseased, often thicker, layers proved to be more accurate for novices compared with analysis of healthy, often thinner, tissue layers. Analysis of the latter tissues may be improved by automated approaches based on image segmentation19 and per-pixel attenuation analysis.18 For smaller-scale clinical studies (IDEAL stages 1 and 2), a consensus evaluation of OCT attenuation data is recommendable. Automation inherently overcomes user-induced variance, yet will require thorough validation. For large-scale studies (IDEAL stages 3 to 5), automatic analysis, as described in Ref. 18, becomes a practical necessity. AcknowledgmentsThe authors would like to thank the students L. van Ginkel, R. Klaassen, and R-J. Goldhoorn for their time and effort in this study. ReferencesJ. van der Schoot et al.,
“The effect of glaucoma on the optical attenuation coefficient of the retinal nerve fiber layer in spectral domain optical coherence tomography images,”
Invest. Ophthalmol. Visual Sci., 53
(4), 2424
–2430
(2012). http://dx.doi.org/10.1167/iovs.11-8436 Google Scholar
K. A. Vermeer et al.,
“RPE-normalized RNFL attenuation coefficient maps derived from volumetric OCT imaging for glaucoma assessment,”
Invest. Ophthalmol. Visual Sci., 53
(10), 6102
–6108
(2012). http://dx.doi.org/10.1167/iovs.12-9933 Google Scholar
F. J. van der Meer et al.,
“Quantitative optical coherence tomography of arterial wall components,”
Lasers Med. Sci., 20
(1), 45
–51
(2005). http://dx.doi.org/10.1007/s10103-005-0336-z Google Scholar
G. van Soest et al.,
“Atherosclerotic tissue characterization in vivo by optical coherence tomography attenuation imaging,”
J. Biomed. Opt., 15
(1), 011105
(2010). http://dx.doi.org/10.1117/1.3280271 Google Scholar
C. Xu et al.,
“Characterization of atherosclerosis plaques by measuring both backscattering and attenuation coefficients in optical coherence tomography,”
J. Biomed. Opt., 13
(3), 034003
(2008). http://dx.doi.org/10.1117/1.2927464 Google Scholar
K. Barwari et al.,
“Advanced diagnostics in renal mass using optical coherence tomography: a preliminary report,”
J. Endourol., 25
(2), 311
–315
(2010). http://dx.doi.org/10.1089/end.2010.0408 JENDE3 0892-7790 Google Scholar
K. Barwari et al.,
“Differentiation between normal renal tissue and renal tumours using functional optical coherence tomography: a phase I in vivo human study,”
BJU Int., 110
(8b), E415
–E420
(2012). http://dx.doi.org/10.1111/j.1464-410X.2012.11197.x BJINFO 1464-410X Google Scholar
M. T. Bus et al.,
“Volumetric in vivo visualization of upper urinary tract tumors using optical coherence tomography: a pilot study,”
J. Urol., 190
(6), 2236
–2242
(2013). http://dx.doi.org/10.1016/j.juro.2013.08.006 Google Scholar
E. C. C. Cauberg et al.,
“Quantitative measurement of attenuation coefficients of bladder biopsies using optical coherence tomography for grading urothelial carcinoma of the bladder,”
J. Biomed. Opt., 15
(6), 066013
(2010). http://dx.doi.org/10.1117/1.3512206 JBOPFO 1083-3668 Google Scholar
L. Scolaro et al.,
“Parametric imaging of the local attenuation coefficient in human axillary lymph nodes assessed using optical coherence tomography,”
Biomed. Opt. Express, 3
(2), 366
–379
(2012). http://dx.doi.org/10.1364/BOE.3.000366 Google Scholar
R. A. McLaughlin et al.,
“Parametric imaging of cancer with optical coherence tomography,”
J. Biomed. Opt., 15
(4), 046029
(2010). http://dx.doi.org/10.1117/1.3479931 Google Scholar
R. Wessels et al.,
“Optical coherence tomography in vulvar intraepithelial neoplasia,”
J. Biomed. Opt., 17
(11), 116022
(2012). http://dx.doi.org/10.1117/1.JBO.17.11.116022 Google Scholar
P. L. Judson et al.,
“Trends in the incidence of invasive and in situ vulvar carcinoma,”
Obstet. Gynecol., 107
(5), 1018
–1022
(2006). http://dx.doi.org/10.1097/01.AOG.0000210268.57527.a1 Google Scholar
D. M. de Bruin et al.,
“Optical phantoms of varying geometry based on thin building blocks with controlled optical properties,”
J. Biomed. Opt., 15
(2), 025001
(2010). http://dx.doi.org/10.1117/1.3369003 JBOPFO 1083-3668 Google Scholar
D. Faber et al.,
“Quantitative measurement of attenuation coefficients of weakly scattering media using optical coherence tomography,”
Opt. Express, 12
(19), 4353
–4365
(2004). http://dx.doi.org/10.1364/OPEX.12.004353 OPEXFF 1094-4087 Google Scholar
R. Wessels et al.,
“Functional optical coherence tomography of pigmented lesions,”
J. Eur. Acad. Dermatol. Venereol., 29
(4), 738
–744
(2014). http://dx.doi.org/10.1111/jdv.12673 Google Scholar
“No surgical innovation without evaluation: the IDEAL recommendations,”
Lancet, 374
(9695), 1105
–1112
(2009). http://dx.doi.org/10.1016/S0140-6736(09)61116-8 Google Scholar
K. A. Vermeer et al.,
“Depth-resolved model-based reconstruction of attenuation coefficients in optical coherence tomography,”
Biomed. Opt. Express, 5
(1), 322
–337
(2014). http://dx.doi.org/10.1364/BOE.5.000322 Google Scholar
J. Tian et al.,
“Real-time automatic segmentation of optical coherence tomography volume data of the macular region,”
PLoS One, 10
(8), e0133908
(2015). http://dx.doi.org/10.1371/journal.pone.0133908 POLNCL 1932-6203 Google Scholar
|


