|
|
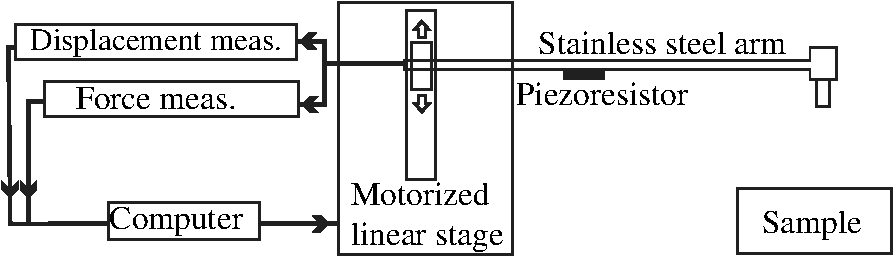
1.IntroductionDiffuse reflectance spectroscopy (DRS) is a noninvasive optical technique used in numerous biomedical applications and studies involving cancer detection1–3 and assessment of soft tissue optical properties.4–11 Spectra are acquired by a fiber-optic probe, which is gently pressed against the tissue surface to assure adequate light coupling and to improve the measurement repeatability. However, the applied contact pressure can induce changes in the soft tissue structure (blood flow reduction, collagen and elastic fibers rearrangement, or muscle and fatty tissue depression) that reflect in altered diffuse reflectance spectra. These changes can lead to substantial errors in the estimation of the tissue optical properties12–16 and affect subsequent analysis (e.g., classification17) of the acquired diffuse reflectance spectra. The contact pressure-induced changes in the diffuse reflectance of human skin depend on the composition of the skin and subcutaneous layers, and therefore vary over the body. Mechanical stress is better dissipated and induces less changes if the probe is applied to a skin site that lies above a thick layer of fatty tissue or muscle (e.g., in gluteal region), than if the probe is applied to a skin site above a thin connective tissue layer, followed directly by a bony prominence18 (e.g., elbow, sacrum, or wrist above ulnar styloid process). In the latter case, the threat of skin viability disruption and breakdown on a cellular level is much higher. Nevertheless, it has been repeatedly shown that body site and skin composition are not the only factors influencing the skin response to mechanical pressure. The other prominent factors also include age,19 body mass index,20 level of vascularization,21 or lifestyle habits including smoking or solar exposure.18 The existing studies on the properties of the operator-induced contact pressure16,22,23 have been primarily focused on a single tissue type and a specific measurement setup. For this purpose, ex vivo samples or phantoms were used and the applied light contact pressure was assessed by a weighing balance. The range of contact pressures and probe contact areas used in the listed studies was from 9 to 90 kPa and from 3.14 to , respectively. The main weakness of these studies was that the mechanical properties of the samples or phantoms were not quantitatively defined. Furthermore, it was assumed that the properties of the applied contact pressure from in vivo measurements would be similar to those observed in the ex vivo tissue samples or phantoms. In general, ex vivo samples are not durable over time and likely do not reflect the mechanical properties of the target in vivo samples. Therefore, existing approaches cannot be used to predict the expected range of contact pressures for in vivo measurement settings that employ different optical probes and/or tissue samples. In contrast, the aim of this study is to systematically assess the properties of contact pressure induced by manually operated probes that are relevant to a number of different measurement settings. Due to the frequent use in various DRS studies and applications10,12,24–29 and complex site-dependent mechanical properties, human skin and human skin-like phantoms were used for the assessment. The first step of this study involved in vivo assessment of the skin mechanical properties at different representative measurement sites. According to the obtained results, three silicone phantoms were prepared encompassing the full range of the observed in vivo tissue mechanical properties. Finally, the silicone phantoms were used to assess the transient and steady-state properties of a light contact pressure induced by manually operated probes. The assessment was based on the recorded time-lapses of the applied contact pressure and involved dependency of the contact pressure on the probe operator, probe contact area, and tissue stiffness. With the methods and results presented in this paper, a set of phantoms with well-defined mechanical properties can be created and relevant statistics on the properties of the applied contact pressure can be obtained. Consequently, such characterization of the applied contact pressure could lead to a better understanding and control of the contact pressure and induced changes for different measurement settings, operators, and tissue samples with different mechanical properties. 2.Materials and MethodsIn this section, we first introduce a so-called indentation test, which provides the means to characterize the mechanical properties of the selected skin sites in vivo that are subsequently used to fabricate silicone phantoms exhibiting similar mechanical properties. Second, we describe the experimental setup used to acquire transient and steady-state contact pressure properties induced by manually operated probes performed exclusively on the fabricated silicone phantoms. 2.1.Characterization of the Skin Sites and Silicone Phantoms2.1.1.InstrumentationAn automated system depicted in Fig. 1 was used to assess the mechanical properties of the selected human skin sites in vivo by an indentation test. A cylindrical indenter was attached to a stainless steel arm equipped with a temperature-compensated silicon piezoresistive force sensor fabricated at the UL-FE, LMSE (Ljubljana, Slovenia). The applied force was measured with a submilligram resolution at a rate of 250 Hz. The contact pressure was calculated as the quotient between the measured force and the probe contact area. The outer diameter of the indenter was 6.35 mm with an effective pressure area of . A precise and accurate control of the applied force was ensured by a motorized linear stage and custom-control logic. 2.1.2.SamplesThe mechanical properties of human skin were assessed at four different skin sites (Fig. 2, at the lateral part of the wrist above ulnar styloid process, on the index finger, above abductor policies brevis muscle, and on the antecubital fossa) of four human volunteers. The four measurement sites were carefully selected to capture the natural variability of the skin structure and underlying tissue. The recorded load-displacement curves of the investigated skin sites served as a reference for creating three homogeneous silicone phantoms with different stiffness levels: hard (), medium (), and soft (). They were subsequently used for the assessment of the probe contact pressure properties. The hard phantom () was made from a silicone rubber skin pasta, the medium phantom () was made from a silicone gel shore 00, and the soft phantom () was made from a mixture of silicone gel shore 00 and silicone oil M50 (all silicones were produced by Samson Kamnik d.o.o., Slovenia). To make the obtained probe contact pressure properties useful to other studies and applications, the three silicone phantoms considerably differed in stiffness and reflected the stiffness range observed at the four selected human skin sites. The phantoms were made at room temperature by thoroughly mixing the individual components in a mixer and placing the phantom mold in a vacuum for about 3 min. In this way, three cylindrical silicone phantoms (diameter 60 mm and height 20 mm) exhibiting different degrees of stiffness were obtained. Finally, the center of each silicone phantom was marked to assure that the indentation system and operators always applied the contact pressure to the same location. The conducted research study involving human volunteers was approved by the National Medical Ethics Committee of the Republic of Slovenia. 2.1.3.MeasurementsThe system performing automated indentation tests was programmed to apply the load at a rate of . The test was terminated when the load reached 2 N after which the indenter was returned to the initial position. During the load application toward the sample, the force of the indenter and the indentation depth were recorded. Ten indentation cycles were performed at each of the four selected skin sites, with a rest period of 30 s. The same procedure was followed to characterize the three silicone tissue-like phantoms. 2.1.4.Data processingTo eliminate fluctuations due to the mechanical vibrations of the linear actuator, the recorded indentation measurements were filtered through a Butterworth low-pass filter with the cutoff frequency set to 12 Hz. The indentation stiffness of the samples was calculated according to the measure,30,31 which is expressed as the gradient of the load-displacement curve: where and denote the subrange of indentation force and indentation depth, respectively.2.2.Characterization of the Probe Operators2.2.1.InstrumentationThe measurement system used for the assessment of the light contact pressure applied by the probe operators is shown in Fig. 3. The system comprises a sample holder fixed to a rigid stainless steel arm equipped with a temperature-compensated silicon piezoresistive force sensor. During the experiment, each operator used a manual fiber-optic probe (FCR-19IR200-2-ME, Avantes) with a 6.35-mm outer diameter, corresponding to a contact area of . The probe area was further extended by using external cylindrical rings of diameters 14.2 and 20 mm, corresponding to contact areas of 158.4 and , respectively. The acquisition of contact pressure and spectra was synchronized by a custom logic. The spectrometer (NIR-512L-1.7T1, 901 to 1685 nm, Control Development) exposure time was set to 3 ms, while the force was measured at a rate of 250 Hz. 2.2.2.MeasurementsTen probe operators were familiarized with the measurement setting and asked to apply a light contact pressure to the silicone phantoms by following a three-step sequence: (a) move the probe perpendicularly toward the skin surface, (b) place the probe in a full contact with the phantom, and (c) apply and maintain a light pressure for approximately 3 s. The measurements were repeated on all the three silicone phantoms (, , and ), by employing three different probes with large (), medium (), and small () contact areas. For each probe operator, the order of the measurement process was randomized over the phantoms and probe contact areas to avoid biased results. The described sequence was repeated 20 times for each combination of the probe contact area and phantom stiffness, with 30 s breaks between the measurements. A special user interface with sound instructions was used to aid the timing of the measurements. 2.2.3.MethodologyThe duration of each light contact pressure measurement was approximately 3 s. Independent of the operator, a common pattern in the recorded contact pressure and diffuse reflectance emerged, where each measurement was primarily composed of two temporal windows, a transient window of increasing contact pressure, followed by a steady-state window exhibiting stable light contact pressure [Fig. 4(a)]. The conducted experiments showed that the transient force changes were limited to the first second of the raw measurements after which the force stabilized for the remaining 2 s. For further analysis of the contact pressure, only the stable force measurements () collected in the window were used. Fig. 4Example of a raw measurement obtained for a single operator. Each raw measurement comprises (a) a contact pressure and (b) average diffuse reflectance time-lapse. Time point marks the initial contact between the probe and the sample, at time point the probe becomes optically coupled to the sample surface, and at time point the applied contact pressure reaches 90% of the average contact pressure observed in the steady-state window . 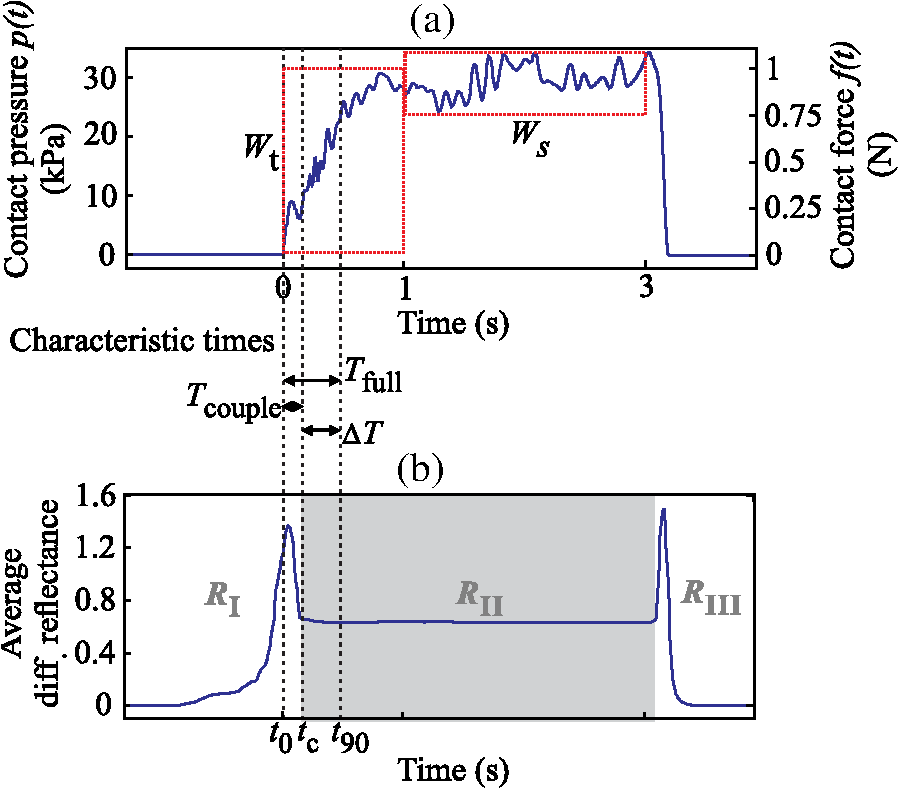 Figure 4(b) shows a typical time-lapse of the average diffuse reflectance spectra for a homogeneous silicone sample (phantom stiffness and probe contact area ), which can be decomposed into three regions. In the first region, , the probe is moving toward the sample surface until it becomes optically coupled to the sample. The time point of optical coupling is wavelength independent for both the homogeneous silicone phantoms and biological tissue. At this point, the diffuse reflectance stabilizes; however, this holds only for the homogenous silicone phantoms and not for the biological tissues, where the rising contact pressure induces structural- and thereby wavelength-dependent changes in the diffuse reflectance. In the second region, , the probe is optically coupled to the sample. The diffuse reflectance of silicone phantoms is stable, while the diffuse reflectance of biological tissues can exhibit changes due to the delayed structural and physiological tissue response. In the third region, , the diffuse reflectance changes as the probe is moved away from the sample. Three time points were defined with respect to the recorded contact pressure and reflectance time-lapse [Fig. 4(b)]: at the initial contact between the probe and the sample surface, at complete optical coupling, and at time when the applied contact pressure reaches 90% of the average contact pressure in . Accordingly, two characteristic times were introduced. The coupling time was defined as the time required by the operator to optically couple the probe after making initial contact with the sample surface (). The full time required for the applied contact pressure to reach 90% of the average contact pressure was denoted as (). The raw contact force data were first normalized by the probe contact area to obtain equivalent applied contact pressure . Subsequently, the applied contact pressure for each raw measurement () obtained for a given operator , silicone phantom , and probe contact area was defined as the average contact pressure observed in the window [Fig. 4(a)]. In addition, the absolute values of the contact pressures for each silicone phantom () and probe () were calculated across the repeated measurements and operators. The contact pressure variability observed within a raw measurement () was characterized as the standard deviation of the contact pressures within the window representing an estimate of the operator’s tremor during the measurement. Finally, was calculated by averaging across the measurements and operators. To assess the average repeatability of a single operator for a specific phantom () and probe (), the intraoperator contact pressure variability was introduced and defined as the average standard deviation of the applied contact pressures : To assess the variability of pressure application among all the operators for a specific phantom () and probe (), the interoperator variability was defined as the standard deviation of the mean applied contact pressures of the individual operators: The same definitions were followed to characterize the raw contact force measurements.2.2.4.Statistical analysisIn this study, all the comparisons between the groups were analyzed by a two-way analysis of variance (ANOVA) with Fisher least significant difference (LSD) post hoc test. The data used in the statistical tests were log transformed to improve the homogeneity of variances, which was confirmed with Leven’s test. Statistical significance was considered for -values less than 0.05. To ensure the dataset followed a normal distribution, a Shapiro–Wilk test was performed. 3.Results and Discussion3.1.Mechanical Properties of the Skin Sites and Silicone PhantomsAs pointed out in Sec. 1, previous studies did not present quantitative data on the mechanical properties of the observed specimen and phantoms that were used to characterize the light contact pressure induced by the probe. In contrast, all the samples used in this study, including the human skin sites and silicone phantoms, were characterized by load-displacement curves, which were measured for indentation forces of up to 2 N. The indentation tests performed with the system depicted in Fig. 1 were used to extract the mechanical properties of the selected human skin sites and silicone phantoms. The measured load-displacement curves obtained for the four skin sites of the four volunteers and for the three silicone phantoms are presented in Fig. 5. Fig. 5Load-displacement curves of the four selected human skin sites (, , , and ), and of the three silicone phantoms (, , and ). The results obtained for each volunteer are represented with a different color. 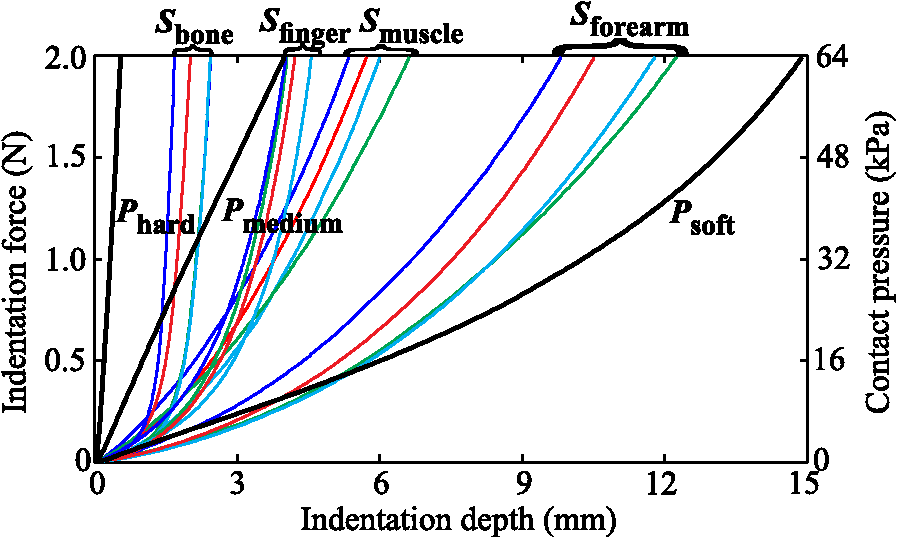 The results show significant variability of the stiffness profiles (load-displacement curves) among the skin sites. The main cause for the phenomenon lies in the variability of the underlying tissue structure at the observed skin sites. As expected, the largest displacement at maximum force was observed on the forearm and the smallest on the skin site above the bone. We assume that the observed differences are due to the fact that the skin layers, including epidermis, dermis, and subcutis, are allowed to deform much more freely above the soft tissues (e.g., skin site above the forearm) than above a bony prominence. As shown in Fig. 5, the fabricated silicone phantoms accommodated the full range of the load-displacement curves observed at the four skin sites. The stiffest phantom [] is comparable to the indentation stiffness of the skin site [] for forces from 1.5 to 2 N. In contrast, the softest phantom [] is comparable to the indentation stiffness of the skin site [] on the forearm for forces from 0 to 0.5 N. The phantom exhibits an intermediate stiffness. 3.2.Characteristic TimesThe time-lapse of contact force and diffuse reflectance spectra collected from the silicone phantoms were used to study the time required by an operator to establish a stable contact pressure. The characteristic times are of great importance when designing the probe and laying out the measurement protocol, all with the aim to maximize the repeatability of the measurements. In general, repeatable measurements can be achieved only after the applied contact pressure has stabilized. The mean characteristic times across all the operators as a function of the probe contact area and phantom stiffness are collected in Table 1. Table 1Mean characteristic times across all the operators as a function of the probe contact area (A) and phantom stiffness (P).
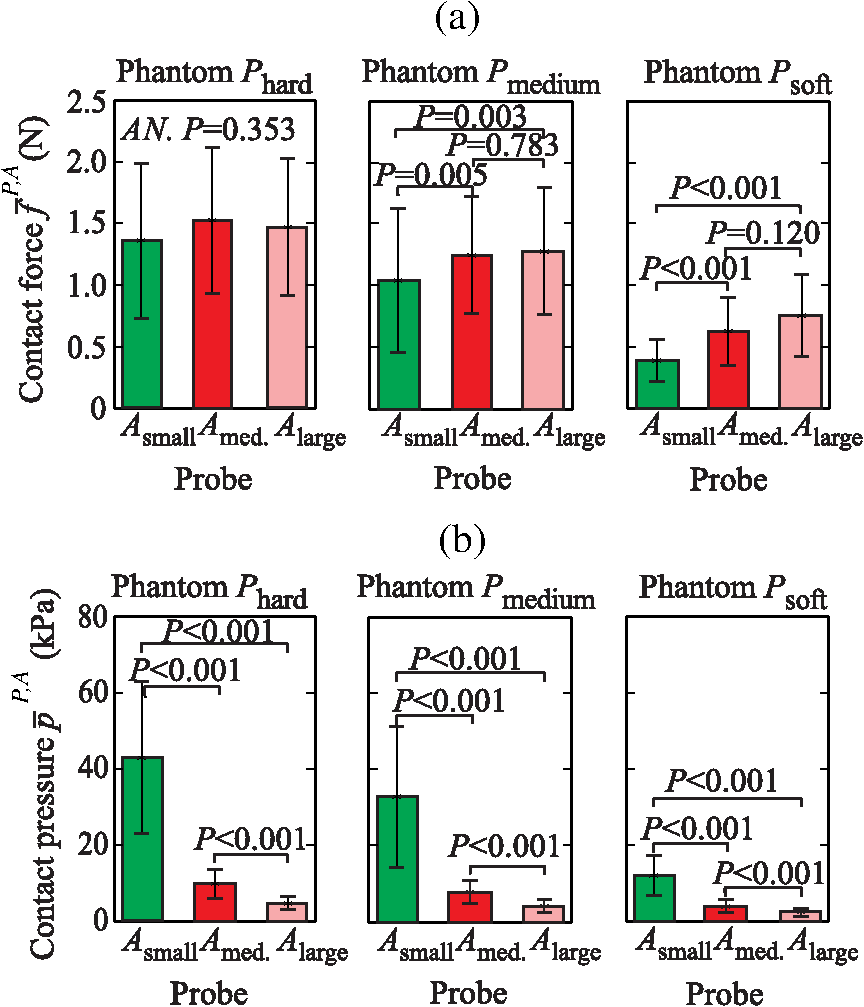
The results show that on average, the operators require about 0.45 s () to reach 90% of the average contact pressure observed in , measured from the initial contact between the probe and the sample surface (). Additionally, it can be observed that the full time () increases with the size of the probe contact area. The reason for that lies in the coupling time (), i.e., the time between the initial contact () and complete optical coupling () [Fig. 6(a)]. The observed increase in could be explained by the deviation of probe incidence angle from normal during the initial contact with the sample surface, resulting in a larger force and longer time required to establish a full optical coupling between the probes with larger contact areas and the sample. This trend is particularly pronounced and statistically significant (ANOVA ) for the data collected from the stiffest silicone phantoms ( and ). In contrast [Fig. 6(b)], does not show a statistically significant dependence on the phantom stiffness for a particular probe contact area, except in the case of the contact area exhibiting a decreasing with decreasing phantom stiffness. Fig. 6Mean and standard deviation of the coupling time as a function of (a) the probe contact area () and (b) phantom stiffness (). 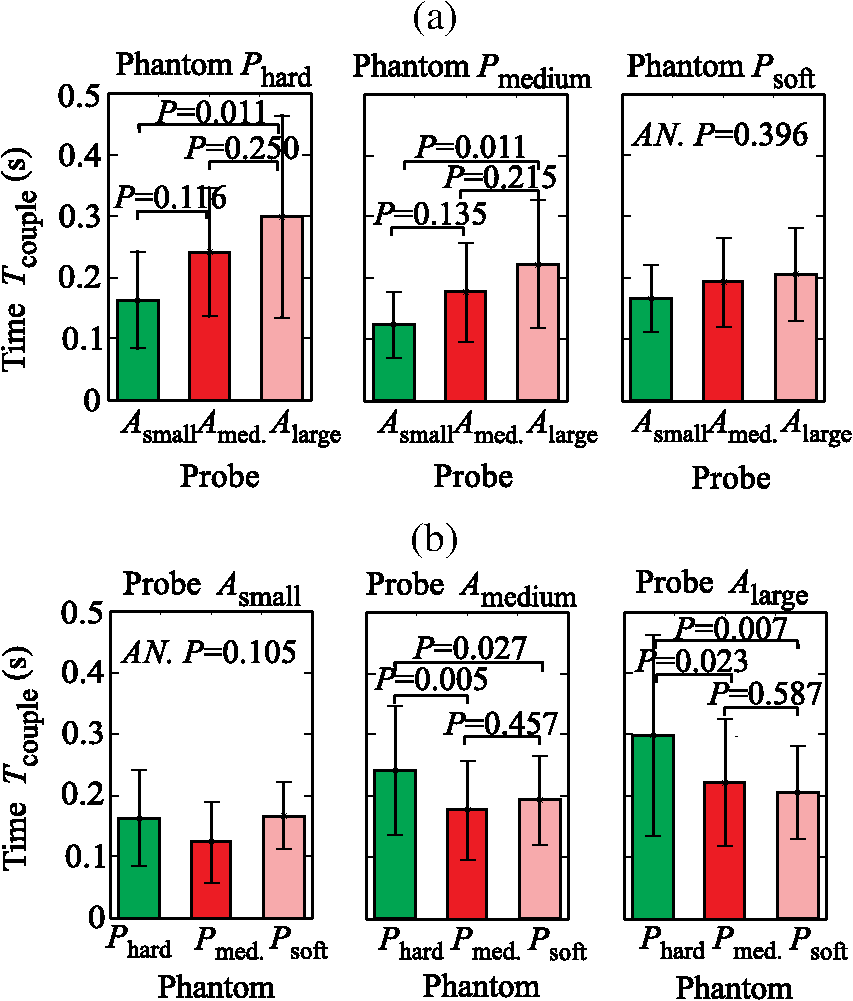 The difference between the two characteristic times () yields the time required to establish stable contact pressure after a complete optical coupling between the probe and sample is achieved. No significant dependence of on the phantom stiffness or probe contact area was discovered. The introduced characteristic times are useful to properly time the acquisition of diffuse reflectance spectra when a high measurement repeatability is required in a limited time window. In general, two conditions for repeatable acquisition of diffuse reflectance spectra have to be satisfied for samples that are sensitive to the contact pressure, namely full optical coupling and contact pressure stabilization. We observed that the contact pressure stabilizes within 0.6 s from the point of full optical coupling between the sample and the probe, and 0.8 s from the initial contact between the probe and the sample surface. The provided values are a worst-case estimate of the characteristic times that accounts for the maximum variability observed within the measurements. We can conclude that it is not advisable to process the spectra within the transient window , up to the time point . This can become important when the available measurement time is on the order of the transient window. In this case, the estimated can be used to properly time the measurements. 3.3.Influence of the Phantom Stiffness, Probe, and Operator on the Light Contact PressureIn order to assure simple comparison of the obtained results to the results reported by other studies, all the values listed in this section are provided in terms of contact pressure and contact force. Both data are important because the contact pressure reflects the influence of the probe on the sample (e.g., biological tissue), while the contact force describes the operator’s perception during the measurements. 3.3.1.Phantom stiffnessA comparison of the contact force and contact pressures as a function of the phantom stiffness () for the three probe contact areas () is highlighted in Fig. 7. In this case, the applied force and contact pressure are equivalent. A two-way ANOVA was conducted to evaluate the effect of stiffness on the applied force for each of the three probe contact areas. All three probes showed significant dependence of the applied force on the phantom stiffness (at the level). The result clearly shows that the phantom stiffness influences the operator perception of the applied force, which increases with the increasing phantom stiffness, independently of the probe contact area. Likewise, the highest interoperator contact force variability was observed for the stiffest phantom (), while the lowest variability was observed for the softest phantom (). These observations could be explained by the larger displacement of the soft phantom exposed to equal amount of force (Fig. 5), and the fact that control of the applied force is related to the control of the displacement; hence, a lower contact force variability is observed for the softer phantom. A similar reasoning could be used to explain the consistent increase in the average applied force with the phantom stiffness, which is required to maintain the displacement level. Additionally, we believe that each operator greatly relies on the visual indentation information. When the probe is applied to a soft material, the indentation is easily observable and the operators rely more on the visual rather than the touch-sensing information. In contrast, with the increasing phantom stiffness, the indentation is decreasing and the operators increasingly rely on the touch-sensing information. 3.3.2.Probe contact areaTo analyze the influence of the probe contact areas () on the contact force and pressure , the contact pressure and contact force have to be observed separately. Figure 8(a) reveals a possible positive correlation between the level of the applied force and the size of the probe contact area. A two-way ANOVA was conducted to study the effect of the probe contact area on the applied force. A significant effect of the probe contact area on the applied force (at the level) has been observed for phantoms and , while for the stiffest phantom , statistical significance was not observed (ANOVA ). Post hoc comparisons using the Fisher LSD test indicated significant difference between the probe pairs () and (). The difference between the probes and was not found significant, which can be attributed to the fact that the relative difference between the contact areas of the two probes is the smallest. The observed increase in the force is particularly pronounced for the softest silicone phantom. One reason for the observed increase might be connected to the fact that a larger probe requires a higher force to compensate for the deviation of the probe incidence from normal, making it increasingly difficult to establish a full contact with the sample surface by employing the same amount of force. As summarized by the results shown in Fig. 8(b), the amount of applied contact pressure is, as expected, dominated by the probe contact area. 3.3.3.OperatorTables 2Table 3–4 summarize the measured contact pressure and force obtained for the three probe contact areas and the three silicone phantoms across all the operators. The applied contact pressure significantly decreases with the increasing probe contact area and decreasing phantom stiffness [Figs. 7 and 8(b)]. The applied contact pressure observed for the three different probes and the three different phantoms ranged from 2.40 to 42.7 kPa. As shown by the existing studies, such contact pressure levels are likely to have a significant effect on the tissue and thereby on the spectral measurements. The contact pressure-induced changes usually include decrease in the tissue blood and water content, oxygenation, and thereby absorption and scattering. The study on human skin by Lim et al.12 showed that a probe pressure of 22 kPa applied to an index finger and forehead decreases the total blood volume and oxygen saturation, while Atencio et al.32 observed significant spectral changes of forearm when exposed to 20.2 kPa. In a study13 of rat liver tissues by DRS, significant spectral changes were observed for a contact pressure of 25.8 kPa. Many of the other studies have observed similar spectral changes; however, the contact pressure and force were not quantified.14,33 Table 2Summary of the measured contact pressures and corresponding forces for the three silicone phantoms Phard, Pmedium, and Psoft across all the operators for the probe contact area Asmall.
Table 3Summary of the measured contact pressures and corresponding forces for the three silicone phantoms Phard, Pmedium, and Psoft across all the operators for the probe contact area Amedium.
Table 4Summary of the measured contact pressures and corresponding forces for the three silicone phantoms Phard, Pmedium, and Psoft across all the operators for the probe contact area Alarge.
In addition to the changes in the applied contact pressure , the results also show that the contact pressure variability depends on both the probe contact area and the phantom stiffness. The average contact pressure variability observed during the individual measurements was estimated between 0.24 and 2.8 kPa, the average intraoperator contact pressure variability between 0.45 and 9.2 kPa, and the interoperator contact pressure variability between 1.06 and 19.9 kPa. The observed intraoperator contact pressure variability is approximately two times lower than the interoperator variability, independently of the phantom stiffness and of the probe contact area. These results are somewhat expected, as the perception of a light contact pressure is operator-specific. In all the cases, the average tremor contact pressure variability observed during the individual measurements exhibits significant decrease with increasing contact area and decreasing phantom stiffness. However, the observed variability is negligible in comparison to the interoperator variability , and thus should be considered only when a single operator is handling the probe. In terms of phantom stiffness, the results show a significant increase in the applied contact pressure and its variability with increasing phantom stiffness. Contact pressure repeatability is of great importance when creating large spectral datasets for classification purposes, where all the spectra should be acquired under the same conditions, and not influenced by the operator. While a manual probe operator can provide a reasonably repeatable contact pressure application for a particular phantom stiffness, the applied contact pressure may change considerably for a phantom of a different stiffness. This observation leads to an important implication for probing tissues with varying stiffness properties. For example, the four selected measurement sites of the human skin exhibit considerably different degrees of stiffness (Fig. 5) arising from the skin thickness variability and, more importantly, from the structure of the underlying tissue. As a result, a probe operator might apply different contact pressures at different measurement sites and thus distort the spectra by operator-specific site-dependent variations. As already pointed out, such variations can significantly affect the estimation of optical properties and thereby the quantification of chromophores frequently used in DRS. 4.ConclusionThe presented results on the applied contact pressure and the contact pressure variability as a function of the probe contact area and sample stiffness can be used to estimate the contact pressure in various applications involving biological samples with characterized load-displacement properties. Based on the presented results, we propose the following set of practical guidelines for operators of manual probes:
Because manually operated optical fiber probes are used in many clinical and research application settings, it is essential to carefully assess and plan the measurement procedure and account for the variability of the applied contact pressure. This study aims at providing relevant data on the transient and steady-state contact pressure and force properties useful in various measurement settings, by taking into account the sample stiffness, probe contact area, and performance of the operator. AcknowledgmentsThis research was supported by the Slovenian Research Agency under the Grants J7-6781, J2-5473, L2-5472, and L2-4072. ReferencesE. Salomatina et al.,
“Optical properties of normal and cancerous human skin in the visible and near-infrared spectral range,”
J. Biomed. Opt., 11
(6), 064026
(2006). http://dx.doi.org/10.1117/1.2398928 JBOPFO 1083-3668 Google Scholar
J. Z. Alejandro Garcia-Uribe,
“In vivo diagnosis of melanoma and nonmelanoma skin cancer using oblique incidence diffuse reflectance spectrometry,”
Cancer Res., 72
(11), 2738
–2745
(2012). http://dx.doi.org/10.1158/0008-5472.CAN-11-4027 CNREA8 0008-5472 Google Scholar
B. Cugmas et al.,
“Detection of canine skin and subcutaneous tumors by visible and near-infrared diffuse reflectance spectroscopy,”
J. Biomed. Opt., 20
(3), 037003
(2015). http://dx.doi.org/10.1117/1.JBO.20.3.037003 JBOPFO 1083-3668 Google Scholar
S.-H. Tseng et al.,
“Chromophore concentrations, absorption and scattering properties of human skin in-vivo,”
Opt. Express, 17
(17), 14599
–14617
(2009). http://dx.doi.org/10.1364/OE.17.014599 OPEXFF 1094-4087 Google Scholar
S.-H. Tseng, A. Grant and A. J. Durkin,
“In vivo determination of skin near-infrared optical properties using diffuse optical spectroscopy,”
J. Biomed. Opt., 13
(1), 014016
(2008). http://dx.doi.org/10.1117/1.2829772 JBOPFO 1083-3668 Google Scholar
A. Kienle et al.,
“Spatially resolved absolute diffuse reflectance measurements for noninvasive determination of the optical scattering and absorption coefficients of biological tissue,”
Appl. Opt., 35
(13), 2304
–2314
(1996). http://dx.doi.org/10.1364/AO.35.002304 APOPAI 0003-6935 Google Scholar
R. M. P. Doornbos et al.,
“The determination of in vivo human tissue optical properties and absolute chromophore concentrations using spatially resolved steady-state diffuse reflectance spectroscopy,”
Phys. Med. Biol., 44
(4), 967
(1999). http://dx.doi.org/10.1088/0031-9155/44/4/012 PHMBA7 0031-9155 Google Scholar
P. R. Bargo et al.,
“In vivo determination of optical properties of normal and tumor tissue with white light reflectance and an empirical light transport model during endoscopy,”
J. Biomed. Opt., 10
(3), 034018
(2005). http://dx.doi.org/10.1117/1.1921907 JBOPFO 1083-3668 Google Scholar
G. Zonios et al.,
“Diffuse reflectance spectroscopy of human adenomatous colon polyps in vivo,”
Appl. Opt., 38
(31), 6628
–6637
(1999). http://dx.doi.org/10.1364/AO.38.006628 APOPAI 0003-6935 Google Scholar
G. Zonios, J. Bykowski and N. Kollias,
“Skin melanin, hemoglobin, and light scattering properties can be quantitatively assessed in vivo using diffuse reflectance spectroscopy,”
J. Invest. Dermatol., 117
(6), 1452
–1457
(2001). http://dx.doi.org/10.1046/j.0022-202x.2001.01577.x JIDEAE 0022-202X Google Scholar
N. Rajaram, T. H. Nguyen and J. W. Tunnell,
“Lookup table-based inverse model for determining optical properties of turbid media,”
J. Biomed. Opt., 13
(5), 050501
(2008). http://dx.doi.org/10.1117/1.2981797 JBOPFO 1083-3668 Google Scholar
L. Lim et al.,
“Probe pressure effects on human skin diffuse reflectance and fluorescence spectroscopy measurements,”
J. Biomed. Opt., 16
(1), 011012
(2011). http://dx.doi.org/10.1117/1.3525288 JBOPFO 1083-3668 Google Scholar
Y. Ti and W.-C. Lin,
“Effects of probe contact pressure on in vivo optical spectroscopy,”
Opt. Express, 16
(6), 4250
–4262
(2008). http://dx.doi.org/10.1364/OE.16.004250 OPEXFF 1094-4087 Google Scholar
V. T.-C. Chang et al.,
“Towards a field-compatible optical spectroscopic device for cervical cancer screening in resource-limited settings: effects of calibration and pressure,”
Opt. Express, 19
(19), 17908
–17924
(2011). http://dx.doi.org/10.1364/OE.19.017908 OPEXFF 1094-4087 Google Scholar
R. Reif et al.,
“Analysis of changes in reflectance measurements on biological tissues subjected to different probe pressures,”
J. Biomed. Opt., 13
(1), 010502
(2008). http://dx.doi.org/10.1117/1.2870115 JBOPFO 1083-3668 Google Scholar
S. Ruderman et al.,
“Analysis of pressure, angle and temporal effects on tissue optical properties from polarization-gated spectroscopic probe measurements,”
Biomed. Opt. Express, 1
(2), 489
–499
(2010). http://dx.doi.org/10.1364/BOE.1.000489 BOEICL 2156-7085 Google Scholar
B. Cugmas et al.,
“Impact of contact pressure-induced spectral changes on soft-tissue classification in diffuse reflectance spectroscopy: problems and solutions,”
J. Biomed. Opt., 19
(3), 037002
(2014). http://dx.doi.org/10.1117/1.JBO.19.3.037002 JBOPFO 1083-3668 Google Scholar
J. E. Sanders, B. S. Goldstein and D. F. Leotta,
“Skin response to mechanical stress: adaptation rather than breakdown—a review of the literature,”
J. Rehabil. Res. Dev., 32
(3), 214
–226
(1995). JRRDEC 0748-7711 Google Scholar
C. Escoffier et al.,
“Age-related mechanical properties of human skin: an in vivo study,”
J. Invest. Dermatol., 93
(3), 353
–357
(1989). http://dx.doi.org/10.1111/1523-1747.ep12280259 JIDEAE 0022-202X Google Scholar
D. L. Bader and P. Bowker,
“Mechanical characteristics of skin and underlying tissues in vivo,”
Biomaterials, 4
(4), 305
–308
(1983). http://dx.doi.org/10.1016/0142-9612(83)90033-9 BIMADU 0142-9612 Google Scholar
B. Fromy et al.,
“Early decrease of skin blood flow in response to locally applied pressure in diabetic subjects,”
Diabetes, 51
(4), 1214
–1217
(2002). http://dx.doi.org/10.2337/diabetes.51.4.1214 DIAEAZ 0012-1797 Google Scholar
M. G. Shim et al.,
“In vivo near-infrared Raman spectroscopy: demonstration of feasibility during clinical gastrointestinal endoscopy,”
Photochem. Photobiol., 72
(1), 146
–150
(2000). http://dx.doi.org/10.1562/0031-8655(2000)072<0146:IVNIRS>2.0.CO;2 PHCBAP 0031-8655 Google Scholar
A. Nath et al.,
“Effect of probe pressure on cervical fluorescence spectroscopy measurements,”
J. Biomed. Opt., 9
(3), 523
–533
(2004). http://dx.doi.org/10.1117/1.1695562 JBOPFO 1083-3668 Google Scholar
S. Devpura et al.,
“Critical comparison of diffuse reflectance spectroscopy and colorimetry as dermatological diagnostic tools for Acanthosis nigricans: a chemometric approach,”
Biomed. Opt. Express, 2
(6), 1664
–1673
(2011). http://dx.doi.org/10.1364/BOE.2.001664 BOEICL 2156-7085 Google Scholar
B. W. Murphy et al.,
“Toward the discrimination of early melanoma from common and dysplastic nevus using fiber optic diffuse reflectance spectroscopy,”
J. Biomed. Opt., 10
(6), 064020
(2005). http://dx.doi.org/10.1117/1.2135799 JBOPFO 1083-3668 Google Scholar
N. Rajaram et al.,
“Pilot clinical study for quantitative spectral diagnosis of non-melanoma skin cancer,”
Lasers Surg. Med., 42
(10), 716
–727
(2010). http://dx.doi.org/10.1002/lsm.21009 LSMEDI 0196-8092 Google Scholar
M. C. Skala et al.,
“Comparison of a physical model and principal component analysis for the diagnosis of epithelial neoplasias in vivo using diffuse reflectance spectroscopy,”
Opt. Express, 15
(12), 7863
–7875
(2007). http://dx.doi.org/10.1364/OE.15.007863 OPEXFF 1094-4087 Google Scholar
N. Rajaram et al.,
“Design and validation of a clinical instrument for spectral diagnosis of cutaneous malignancy,”
Appl. Opt., 49
(2), 142
–152
(2010). http://dx.doi.org/10.1364/AO.49.000142 APOPAI 0003-6935 Google Scholar
M. Bregar et al.,
“A study on the properties of contact pressure induced by manually operated diffuse reflectance fiber optic probes,”
Proc. SPIE, 9327 932717
(2015). http://dx.doi.org/10.1117/12.2077190 PSISDG 0277-786X Google Scholar
X. Shuping et al.,
“An indentation apparatus for evaluating discomfort and pain thresholds in conjunction with mechanical properties of foot tissue in vivo,”
J. Rehabil. Res. Dev., 47
(7), 629
–642
(2010). http://dx.doi.org/10.1682/JRRD.2009.09.0152 JRRDEC 0748-7711 Google Scholar
R. B. Groves,
“Quantifying the mechanical properties of skin in vivo and ex vivo to optimise microneedle device design,”
253 Cardiff, Wales
(2011). Google Scholar
J. A. D. Atencio et al.,
“Influence of probe pressure on human skin diffuse reflectance spectroscopy measurements,”
Opt. Mem. Neural Networks, 18
(1), 6
–14
(2009). http://dx.doi.org/10.3103/S1060992X09010020 OMNNE8 1060-992X Google Scholar
S. Jiang et al.,
“In vivo near-infrared spectral detection of pressure-induced changes in breast tissue,”
Opt. Lett., 28
(14), 1212
–1214
(2003). http://dx.doi.org/10.1364/OL.28.001212 OPLEDP 0146-9592 Google Scholar
M. Bregar et al.,
“Contact pressure-aided spectroscopy,”
J. Biomed. Opt., 19
(2), 020501
(2014). http://dx.doi.org/10.1117/1.JBO.19.2.020501 JBOPFO 1083-3668 Google Scholar
BiographyMaksimilijan Bregar is a PhD student in the Department of Electrical Engineering, University of Ljubljana. He is a member of the Laboratory of Imaging Technologies, and his research interests focus on contact pressure-aided spectroscopy and experimental techniques for measuring tissue optical properties. Blaž Cugmas is a postdoctoral researcher in the Department of Electrical Engineering, University of Ljubljana. His research interests involve the processing of biomedical signals and the analysis of tissues with diffuse reflectance spectroscopy. Peter Naglič is a PhD student in the Department of Electrical Engineering, University of Ljubljana. He is a member of the Laboratory of Imaging Technologies. His research interests involve computer modeling of light propagation in turbid media and experimental techniques for measuring their optical properties. Daniela Hartmann is currently working in the Division of Dermatologic Surgery at the Department of Dermatology and Allergology in Munich, Germany. Her research interests include in vivo and ex vivo optical imaging of the skin. The area of her main clinical activities covers general dermatology, dermatosurgery, dermatohistopathology, and dermatooncology. Franjo Pernuš is a professor in the Department of Electrical Engineering, University of Ljubljana. He is a head of the Laboratory of Imaging Technologies, and his research interests involve biomedical image processing and analysis, computer vision, and the applications of image processing and analysis techniques to various biomedical and industrial problems. He is a cofounder of the high-tech company Sensum, which supplies machine vision solutions for the pharmaceutical industry. Boštjan Likar is a professor in the Department of Electrical Engineering, University of Ljubljana. He is a member of the Laboratory of Imaging Technologies, and his research interests focus on visual quality inspection, computer and machine vision systems, biomedical image processing, and hyperspectral imaging. He is a cofounder of the high-tech company Sensum, which supplies machine vision solutions for the pharmaceutical industry. Miran Bürmen is an assistant professor at the Department of Electrical Engineering, University of Ljubljana. He is a member of the Laboratory of Imaging Technologies, and his research interests concentrate on the development of hyperspectral imaging systems for various biomedical and industrial applications. |
|||||||||||||||||||||||||||||||||||||||||||||||||||||||||||||||||||||||||||||||||||||||||||||||||||||||||||||||||||||||||||||||||||||||||||||||||||||||||||||||||||||||||||||||||||||