|
|
|
Myoglobin is a primary oxygen-carrying protein expressed in skeletal muscle fibers and cardiac myocytes.1 It functions as an oxygen-storage unit, facilitating the diffusion of oxygen from the cell membrane to mitochondria. Quantification of oxygen saturation of myoglobin () is of great interest in preclinical and clinical applications. For instance, an increased capability of myoglobin to buffer oxygen in skeletal muscle is closely related to chronic heart failure.2 Myoglobin may also be used as a cardiac biomarker in the blood stream to help diagnose a heart attack.3 Myoglobin has been demonstrated, along with hemoglobin, as a main muscle chromophore in the visible and near-infrared (NIR) spectral regions.4–6 Both myoglobin and hemoglobin have oxygen-bound and oxygen-unbound states that are spectrally distinct. Currently, optical spectroscopy,4,7 diffuse optical tomography (DOT),8 and functional magnetic resonance imaging (f-MRI)9are mainly used to quantify in vivo; however, all three techniques have limitations. Optical spectroscopy and DOT have low spatial resolution, and f-MRI is sensitive only to deoxygenated myoglobin.10 Photoacoustic tomography (PAT) can overcome the aforementioned limitations. The conversion of light to ultrasound provides this hybrid imaging technique with ultrasonically defined spatial resolution at depths beyond the optical diffusion limit11 ( in skin). PAT directly measures specific optical absorption (), which is the product of the optical absorption coefficient () and the local optical fluence ().12,13 Without invasive measurements or sophisticated modeling of light propagation to obtain the local optical fluence, we can quantify the absolute by taking advantage of its dynamics.14 Photoacoustic (PA) signal amplitude is proportional to the initial pressure rise as given below: where is the Grüneisen coefficient, is the percentage of the specific optical absorption that is converted into heat, is the local optical fluence, and is the optical absorption coefficient. In muscle tissue, the major absorbers in the visible and NIR optical spectral regions are oxygenated myoglobin (), deoxygenated myoglobin (Mb), oxygenated hemoglobin (), and deoxygenated hemoglobin (Hb).6 Figure 1(a) shows the optical absorption spectra of the major chromophores found in muscle. Their distinct spectra give us an opportunity to differentiate each chromophore. The optical absorption coefficient at wavelength can be expressed as where denotes the oxygenation state; is the total concentration of myoglobin and hemoglobin; , , , and are the respective concentration fractions of , Mb, , and Hb relative to the total concentration . , , , and are the respective molar extinction coefficients of the four chromophores. Between two different oxygenation states ( and ), the ratio of the measured PA signal amplitudes () can be written as follows according to Eqs. (1) and (2):14Fig. 1Optical absorption properties of myoglobin. (a) Absorption spectra of major chromophores found in muscle, measured at wavelengths from 600 to 820 nm. (b) Absorption spectra of a mixture of (60.7%), Mb (24.8%), (6.9%), and Hb (7.6%), measured using a spectrophotometer before and after the photoacoustic (PA) experiment. 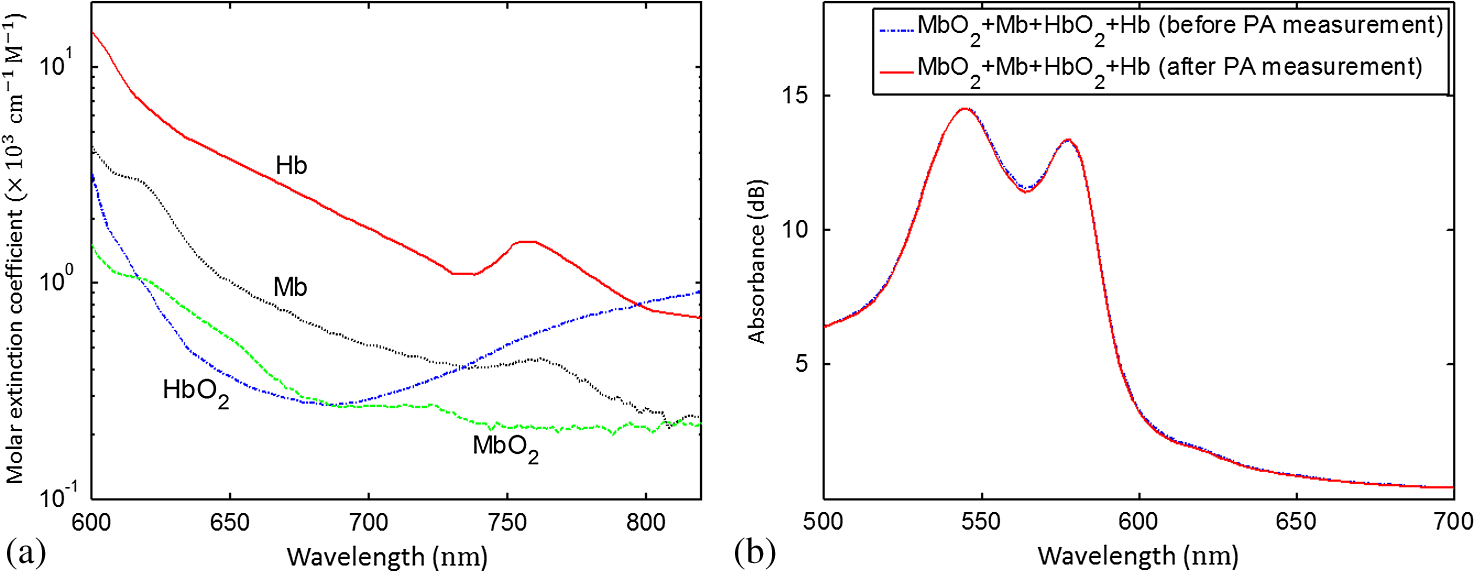 and do not appear in the ratio because they do not change between different states. For red and NIR light, the change in optical attenuation in the skin due to variations in (e.g., from 90% to 30%) is less than 3%,15 mainly because of the high optical scattering and low volume fraction of blood in the skin. Therefore, we can neglect the change in local optical fluence due to variations in , i.e., .14 In addition, if we assume that the total concentration does not change, i.e., , the first two terms on the right-hand side of Eq. (4) can be removed. To solve the remaining six unknowns,, in the and states, we need to measure the PA signals at a minimum of six wavelengths. The source and the method adopted to prepare the solutions of pure , Mb, , and Hb were the same as reported in previous papers.4,7 The absorption spectra of the solutions were measured using a standard spectrophotometer (Varian Cary 50). The spectrophotometer measured the absorbance, which was the product of the molar extinction coefficient, molar concentration, and the path length of the cuvette. From the known molar extinction coefficients at various wavelengths and the path length of the cuvette, we derived the molar concentrations. To the mixture of and , we added a moderate amount of sodium dithionite to partially deoxidize the sample, giving the spectrum shown in Fig. 1(b) (dashed line). From the spectrum, we calculated the concentration fractions of the four chromophores as a reference. After PA measurement, we repeated the spectral measurement [solid line in Fig. 1(b)]. We covered the cuvettes and the phantom with a piece of transparent film to avoid exposing the mixtures to air during the two spectrophotometer measurements (). We first performed a phantom study to validate our method. We made an agar cylinder with four square vertical tunnels [Fig. 2(a)]. Each tunnel was 5-mm long, 5-mm wide, and 70-mm high, with a 3-mm spacing between tunnels. Initially, 0.11 mL 20% intralipid (deoxygenated) was injected in each tunnel. The reduced scattering coefficient of the intralipid solution was around at 700 nm.16Three mixtures of , Mb, , and Hb with the same total concentration and different concentration fractions were then added into the first three tunnels, and the fourth tunnel was filled with pure water. The absorption coefficients of the first three samples at 700 nm were 0.23, 0.15, and , respectively. The samples in all tunnels had the same reduced scattering coefficient of at 700 nm. Fig. 2Experimental setup and a representative PA image of the phantom. (a) Schematic of the phantom setup. (b) PA image of the phantom acquired at 600 nm.  To validate our model, we used a photoacoustic computed tomography (PACT) system equipped with a ring-shaped ultrasonic transducer array.17,18 The agar phantom was immersed in water and fixed at the center of the transducer array. The imaging plane was set at 2 mm below the sample’s liquid surface. At the imaging plane, a 0.1-mm radial resolution and tangential resolution were achieved. For multiwavelength imaging, we combined an optical parametric oscillator laser and a Ti-sapphire laser, each pumped by an Nd:YAG laser with a 10-Hz pulse repetition rate. After passing through a ground glass, the light beam was expanded and delivered onto the top of the phantom [Fig. 2(a)]. The laser fluence at the phantom surface was around . We imaged the phantom at 600, 620, 640, 734, 757, and 800 nm, with 60 times averaging at each wavelength. Figure 2(b) shows a representative image of the phantom acquired at 600 nm. From the images acquired at each wavelength, we first averaged the PA signals within each tunnel, and then subtracted the water absorption (PA signal amplitude in tunnel #4) from the first three tunnels before substituting the data into Eq. (4). The spectral unmixing results are summarized in Table 1. In this table, the true concentration fractions were calculated by using the molar extinction coefficient of each chromophore and the spectrophotometer measurements of the mixture, e.g., Fig. 1(b). The measured concentration fractions were in good agreement with the true values, with an average error of 10%. The accuracy is still sufficient to measure the change in vivo from hyperoxia induced with 100% inhalation to hypoxia induced with 10% inhalation.14,19 Table 1Summary of the phantom experimental results.
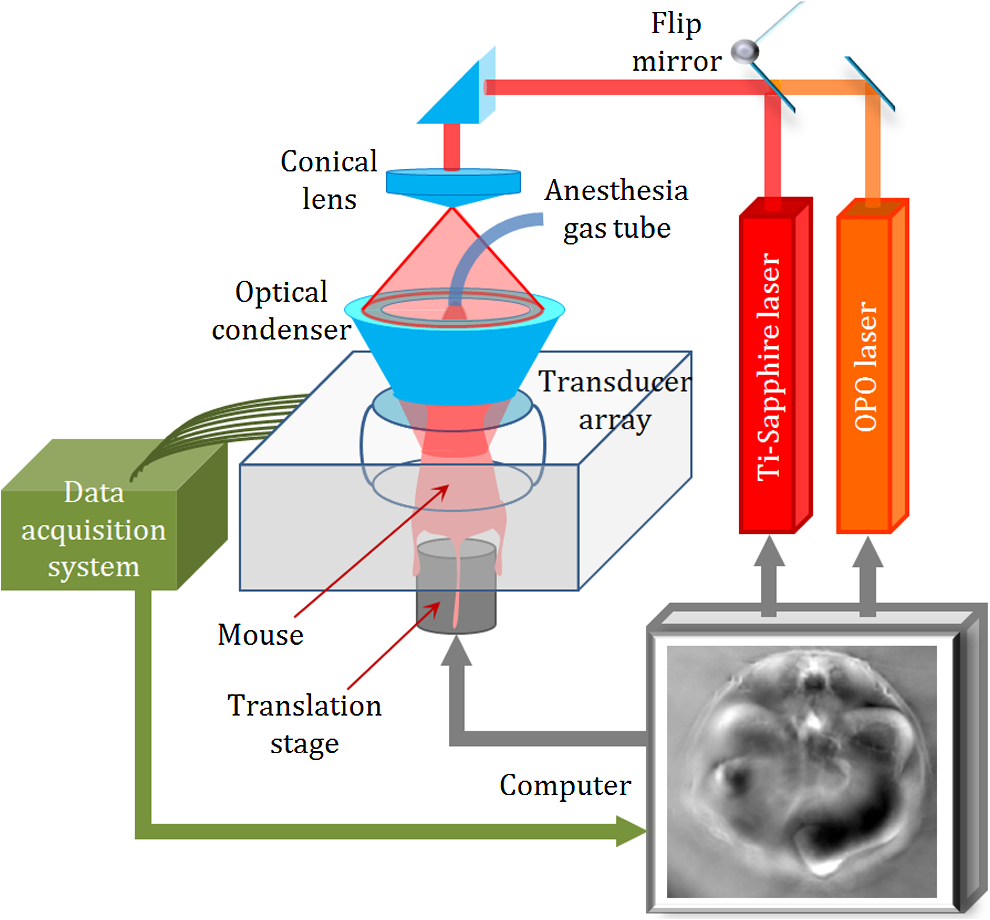
In the above phantom experiment, the first three samples with different oxygenation levels served as the different oxygenation states required for the ratiometric calculation by using Eqs. (2) and (4). The estimated effective attenuation coefficients of the three samples were 2.65, 2.14, and at 700 nm, respectively. Therefore, the optical fluence at the imaging plane was different for each sample. The ratio between the light fluence in tunnel #1 and tunnel #2 was 0.91, and the ratio between the light fluence in tunnel #1 and tunnel #3 was 1.15. Because Eq. (4) assumes that the optical fluence remains constant between different oxygenation states, the actual difference in optical fluence between different samples (i.e., different oxygenation states) was the major source for the measurement errors. To further test the method, we noninvasively imaged a systemic change in the backbone muscle of a mouse in vivo. All experimental procedures were carried out in conformity with the laboratory animal protocols approved by the Animal Studies Committee at Washington University in St. Louis. Before imaging, the hair on the mouse’s body was removed with a depilatory. The mouse was then taped to a lab-made motorized animal holder, which was then mounted to the PACT system. Figure 3 shows a schematic of the experimental setup.20 The level in the backbone muscle was adjusted by challenging the animal with different oxygen concentrations in the inhalation gas. At first, the anesthesia gas was a mixture of pure oxygen and isoflurane, keeping the mouse in hyperoxia. We used 780 nm light with full-ring illumination to obtain a cross-sectional image of the mouse at the kidney level, as shown in Fig. 3. We then adjusted the light to the mouse back to form a half-ring illumination to image the backbone muscle at six wavelengths. The laser fluence on the mouse’s dorsal surface was around . We switched the six wavelengths one by one to image the mouse backbone region during hyperoxia. Then we decreased the inhaled to 10% and increased to 90%, waited 3 min so that the mouse was in hypoxia, and repeated imaging with six wavelengths. Finally, we increased the inhaled back to 100% and repeated the measurements to compare the values in two hyperoxic states. At each wavelength, we averaged 60 times. To calculate the hemoprotein , we first smoothed the PA images with a median filter. We then substituted the measurements into Eq. (4) and calculated the pixelwise concentration fraction of , Mb, , and Hb. Figure 4(a) shows the distribution of myoglobin in hyperoxia (state ), and Fig. 4(b) shows the distribution of hemoglobin in the same state. These two images clearly differentiate the regions of the spinal cord, backbone muscle, and kidney, which conform to the background structural image (shown in Fig. 3). The relative changes in myoglobin and hemoglobin from hyperoxia (state ) to hypoxia (state ) are shown in Figs. 4(c) and 4(d), respectively. In Fig. 4(c), the decreased primarily in the backbone muscle region when we reduced the inhaled concentrations. In Fig. 4(d),we observed that the hemoglobin systemically decreases in both the backbone muscle and other internal organs. Moreover, with the same hypoxic challenge, the hemoglobin decreased faster than the myoglobin , probably due to the fact that myoglobin has higher oxygen affinity than hemoglobin.19 Fig. 4In vivo experimental results. (a, b) Concentration fraction of (a) myoglobin and (b) hemoglobin in hyperoxia (state ) (shown in color) overlaid on the structural image (shown in gray). (c, d) The relative change in (c) myoglobin and (d) hemoglobin from hyperoxia (state ) to hypoxia (state ) (shown in color) overlaid on the structural image (shown in gray). BM, backbone muscle; KN, kidney; and SC, spinal cord.  An accurate measurement requires knowledge of the local optical fluence, which can be estimated through invasive measurements21 or sophisticated modeling of light transportation.22 To address this issue, we used a ratiometric method14 based on the dynamics in , where knowledge of optical fluence was not required. We neglected the change in optical attenuation in tissue due to variations in , mainly because of the high scattering and low volume fraction of blood in the skin. In future studies, a more accurate noninvasive measurement in deep tissue can be achieved by taking into consideration of the light fluence changes in different states. Direct validation of the in vivo measurement in deep tissue is challenging. Invasive partial pressure of oxygen () oximetry23 or fluorescence lifetime-based measurement24 might be a surrogate validation. The spatial resolution of the measurement is around 0.25 mm, which is finer than that of DOT (4 to 7 mm)25 and f-MRI (1 to 5 mm).26 In summary, we reported, for the first time, the PAT of myoglobin based on the dynamics of PA signals at different oxygenation states. Using PACT, we demonstrated this method both in phantoms and in vivo. Because six wavelengths were used, the current in vivo measurements are not fast enough to monitor the dynamics of changes. The imaging speed can potentially be improved by using faster wavelength switching. Noninvasive in vivo measurements of might be useful in medical and surgical procedures.27,28By taking advantage of the high spatial resolution of PACT, applications such as cardiac surgery and sports medicine might particularly benefit. AcknowledgmentsThe authors would like to thank Professor James Ballard for close reading of this paper. We also thank Guo Li, Dr. Junhui Shi, and Dr. Lidai Wang for useful discussions. This work was supported in part by the National Institutes of Health Grants Nos. DP1 EB016986 (NIH Director’s Pioneer Award), R01 CA186567 (NIH Director’s Transformative Research Award), and R01 EB016963. L.V.W. has a financial interest in Microphotoacoustics, Inc. and Endra, Inc., which, however, did not support this work. ReferencesG. Ordway et al.,
“Myoglobin: an essential hemoprotein in striated muscle,”
J. Exp. Biol., 207 3441
–3446
(2004). http://dx.doi.org/10.1242/jeb.01172 JEBIAM 0022-0949 Google Scholar
M. Bekedam et al.,
“Myoglobin concentration in skeletal muscle fibers of chronic heart failure patients,”
J. Appl. Physiol., 107
(4), 1138
–1143
(2009). http://dx.doi.org/10.1152/japplphysiol.00149.2009 Google Scholar
M. Weber et al.,
“Diagnostic utility of new immunoassays for the cardiac markers cTnI, myoglobin and CK-MB mass,”
Clin. Biochem., 38 1027
–1030
(2005). http://dx.doi.org/10.1016/j.clinbiochem.2005.07.011 Google Scholar
L. S. Arakaki et al.,
“Simultaneous optical spectroscopic measurement of hemoglobin and myoglobin saturations and cytochrome aa3 oxidation in vivo,”
Appl. Spectrosc., 64
(9), 973
–979
(2010). http://dx.doi.org/10.1366/000370210792434387 APSPA4 0003-7028 Google Scholar
C. Zhang et al.,
“Label-free photoacoustic microscopy of myocardial sheet architecture,”
J. Biomed. Opt., 17
(6), 060506
(2012). http://dx.doi.org/10.1117/1.JBO.17.6.060506 JBOPFO 1083-3668 Google Scholar
K. Alev et al.,
“Physiological role of myosin light and heavy chain isoforms in fast- and slow-twitch muscles: effect of exercise,”
Biol. Sport, 26
(3), 215
–234
(2009). http://dx.doi.org/10.5604/20831862.894654 Google Scholar
L. S. Arakaki et al.,
“Accurate myoglobin oxygen saturation by optical spectroscopy measured in blood-perfused rat muscle,”
Appl. Spectrosc., 61
(9), 978
–985
(2007). http://dx.doi.org/10.1366/000370207781745928 APSPA4 0003-7028 Google Scholar
V. Hartwig et al.,
“First prototype of a near infrared tomograph for mapping the myocardial oxygenation in small animal isolated hearts,”
in IEEE Int. Workshop on Imaging Systems and Techniques, 2008 (IST 2008),
94
–97
(2008). Google Scholar
V. Lebon et al.,
“Simultaneous measurement of perfusion and oxygenation changes using a multiple gradient-echo sequence: application to human muscle study,”
Magn. Reson. Imaging, 16
(7), 721
–729
(1998). http://dx.doi.org/10.1016/S0730-725X(98)00088-5 Google Scholar
D. Befroy et al.,
“Magnetic resonance spectroscopy studies of human metabolism,”
Diabetes, 60
(5), 1361
–1369
(2011). http://dx.doi.org/10.2337/db09-0916 DIAEAZ 0012-1797 Google Scholar
L. V. Wang and S. Hu,
“Photoacoustic tomography: in vivo imaging of organelles to organs,”
Science, 335
(6075), 1458
–1462
(2012). http://dx.doi.org/10.1126/science.1216210 SCIEAS 0036-8075 Google Scholar
J. Xia et al.,
“Whole-body ring-shaped confocal photoacoustic computed tomography of small animals in vivo,”
J. Biomed. Opt., 17
(5), 050506
(2012). http://dx.doi.org/10.1117/1.JBO.17.5.050506 JBOPFO 1083-3668 Google Scholar
M. R. Chatni et al.,
“Tumor glucose metabolism imaged in vivo in small animals with whole-body photoacoustic computed tomography,”
J. Biomed. Opt., 17
(7), 076012
(2012). http://dx.doi.org/10.1117/1.JBO.17.7.076012 JBOPFO 1083-3668 Google Scholar
J. Xia et al.,
“Calibration-free quantification of absolute oxygen saturation based on the dynamics of photoacoustic signals,”
Opt. Lett., 38
(15), 2800
–2803
(2013). http://dx.doi.org/10.1364/OL.38.002800 OPLEDP 0146-9592 Google Scholar
K. Maslov et al.,
“Effects of wavelength-dependent fluence attenuation on the noninvasive photoacoustic imaging of hemoglobin oxygen saturation in subcutaneous vasculature in vivo,”
Inverse Probl., 23
(6), S113
(2007). http://dx.doi.org/10.1088/0266-5611/23/6/S09 INPEEY 0266-5611 Google Scholar
S. Flock et al.,
“The optical properties of intralipid: a phantom medium for light propagation studies,”
Lasers Surg. Med., 12
(5), 510
–519
(1992). http://dx.doi.org/10.1002/lsm.1900120510 LSMEDI 0196-8092 Google Scholar
J. Gamelin et al.,
“A real-time photoacoustic tomography system for small animals,”
Opt. Express, 17
(13), 10489
–10498
(2009). http://dx.doi.org/10.1364/OE.17.010489 OPEXFF 1094-4087 Google Scholar
L. Lin et al.,
“In vivo deep brain imaging of rats using oral-cavity illuminated photoacoustic computed tomography,”
J. Biomed. Opt., 20
(1), 016019
(2015). http://dx.doi.org/10.1117/1.JBO.20.1.016019 JBOPFO 1083-3668 Google Scholar
K. Brandis, The Physiology Viva, 125 Alderbury House, Oxenford, Australia
(1997). Google Scholar
J. Xia et al.,
“Whole-body ring-shaped confocal photoacoustic computed tomography of small animals in vivo,”
J. Biomed. Opt., 17
(5), 050506
(2012). http://dx.doi.org/10.1117/1.JBO.17.5.050506 JBOPFO 1083-3668 Google Scholar
A. Hussain et al.,
“Mapping optical fluence variations in highly scattering media by measuring ultrasonically modulated backscattered light,”
J. Biomed. Opt., 19
(6), 066002
(2014). http://dx.doi.org/10.1117/1.JBO.19.6.066002 JBOPFO 1083-3668 Google Scholar
L. V. Wang et al.,
“MCML—Monte Carlo modeling of light transport in multi-layered tissues,”
Comput. Methods Prog. Biol., 47 131
–146
(1995). http://dx.doi.org/10.1016/0169-2607(95)01640-F CMPBEK 0169-2607 Google Scholar
S. Traustason et al.,
“Spectrophotometric retinal oximetry in pigs,”
Invest. Ophthalmol. Vis. Sci., 54
(4), 2746
–2751
(2013). http://dx.doi.org/10.1167/iovs.12-11284 IOVSDA 0146-0404 Google Scholar
P. Hartmann et al.,
“Fluorescence lifetime imaging of the skin supply,”
Adv. Exp. Med. Biol., 428 605
–611
(1997). http://dx.doi.org/10.1007/978-1-4615-5399-1_85 AEMBAP 0065-2598 Google Scholar
T. Durduran et al.,
“Diffuse optics for tissue monitoring and tomography,”
Rep. Prog. Phys., 73 076701
(2010). http://dx.doi.org/10.1088/0034-4885/73/7/076701 RPPHAG 0034-4885 Google Scholar
M. F. Glabus, Neuroimaging, 295 Elsevier Academic Press, San Diego, California
(2005). Google Scholar
E. Gussakovsky et al.,
“NIR spectroscopic imaging to map hemoglobin + myoglobin oxygenation, their concentration and optical pathlength across a beating pig heart during surgery,”
J. Biophotonics, 5
(2), 128
–139
(2012). http://dx.doi.org/10.1002/jbio.201100031 Google Scholar
BiographyLi Lin is currently a PhD student at Washington University in St. Louis, under the tutelage of Dr. Lihong V. Wang. He earned his master’s degree at the University of Pennsylvania in 2013 and his bachelor’s degree at Tianjin University in 2011. His research focuses on photoacoustic tomography and microscopy. Junjie Yao received his BE and ME degrees in biomedical engineering from Tsinghua University, Beijing, in 2006 and 2008, respectively, under the tutelage of Prof. Jing Bai. He received his PhD in biomedical engineering at Washington University in St. Louis (WUSTL), in 2013, under the tutelage of Prof. Lihong V. Wang. He is currently a postdoctoral research associate at WUSTL. His research interest is in novel photoacoustic, optical, and ultrasound imaging technologies in biomedicine. Lei Li received his bachelor’s and master’s degrees from Harbin Institute of Technology, China, in 2010 and 2012, respectively. Currently, he is working as a graduate research assistant under the tutelage of Dr. Lihong Wang at Washington University in St. Louis. His current research focuses on photoacoustic microscopy and tomography, especially to improve the photoacoustic imaging speed and applying it on brain functional and structural imaging. Lihong V. Wang received his PhD degree at Rice University, Houston, Texas. Currently, he is holding the Gene K. Beare distinguished professorship of biomedical engineering at Washington University in St. Louis. He has published 400 peer-reviewed journal articles and delivered 400 keynote, plenary, or invited talks. His google scholar h-index and citations have reached 92 and over 34,000, respectively. |
||||||||||||||||||||||||||||||||||||||||||||||