|
|
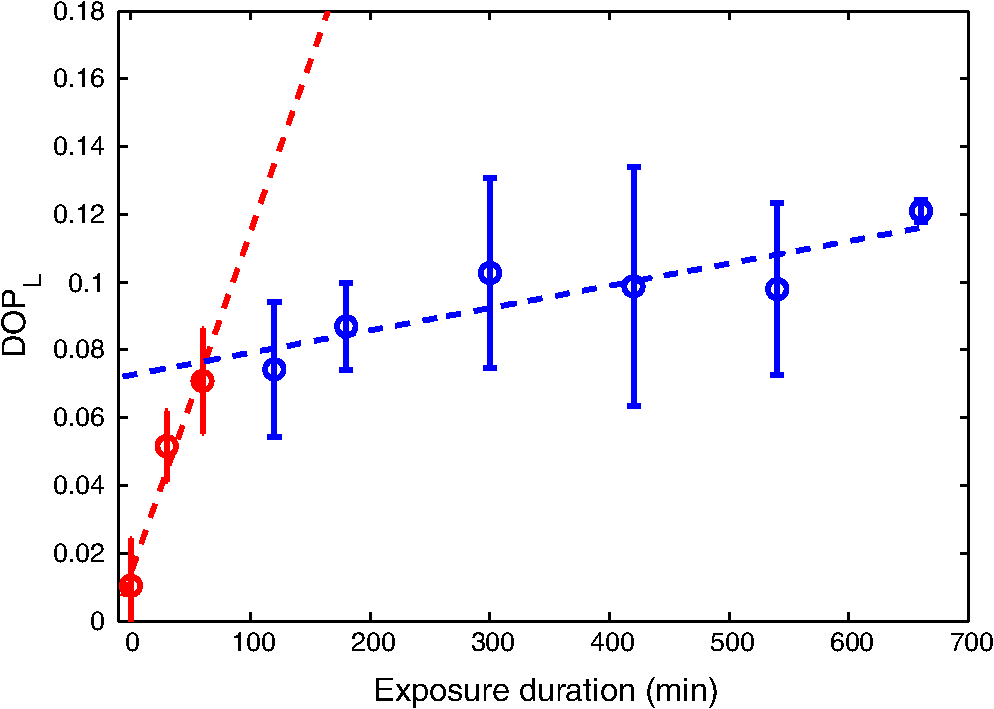
1.IntroductionTooth enamel is a highly mineralized tissue. It is constituted of inorganic material (96%), an organic matrix (enamel proteins, enamelin, and lipids, 3%), and water (1%); this high mineral content gives it strength and hardness. The enamel is a very compact structure demonstrating a low permeability. Tooth erosion and tooth decay are the most commonly encountered problems when it comes to oral health. Due to acid exposure (),1 the enamel is subject to demineralization (loss of minerals) causing dental erosion. This process is defined as the loss of tooth substance by acid exposure not involving bacteria.2 Acidic drink or food intake causes dental erosion that starts with enamel surface softening and progressive tissue loss, making the enamel more susceptible to abrasive wear.3 Tooth decay occurs due to bacterial acid, differently from the erosion process. In fact, certain bacteria adhere to the tooth surface in bacterial communities known as dental plaque, producing acid that causes the demineralization and cavities. The first clinical sign indicating a tooth cavity is the white spot lesion that is characterized by a chalky white appearance. The manifestation of such spots on the tooth surface is a sign of their demineralization. During the demineralization process, calcium and phosphate are dissolved from the enamel and dentin and are lost in the mouth via saliva or plaque. The white spot lesion is thus characterized by dissolution of hard tissues of the subsurface layer. However, it is possible to reverse the demineralization process by acting quickly on these lesions, stimulating and guiding a remineralization process. In fact, even though teeth can naturally remineralize themselves if the ions of phosphorus and calcium remaining in saliva are redeposited, this process cannot persist when there is a change in biological factors. Therefore, various technologies have been developed to prevent the progress of demineralization by delivering calcium, phosphate, and fluoride.4 Patients are strongly advised to use toothpastes containing amorphous calcium phosphate5 or calcium sodium phosphosilicate,6 and mouth rinses supersaturated in soluble calcium and phosphate ions.7 Thus, the sooner tooth erosion and decay are detected, the simpler it is to fix the damage before the onset of serious lesions requiring destructive care for teeth. Multiple methods can be used to detect and study the erosion of enamel. Some rely on chemical analysis of dissolved minerals such as calcium analysis using an ion-selective electrode.4 Although these techniques have been used in vivo,8 they do not give any morphological information and are not sensitive to possible mineral gain. High-cost and destructive methods such as surface profilometry9 and microradiography10 are also used for the detection and quantification of mineral loss due to acid erosion. As alternative methods and due to their relatively affordable price and noninvasive nature, optical methods are being investigated and considered for the detection and quantification of dental erosion. Many methods based on the change in optical properties between healthy, demineralized, eroded, and carious teeth have been proposed for this purpose.2,11–15 Quantitative light-induced fluorescence,3 laser-induced fluorescence (which is the basis of the “diagnodent” device),16 or transillumination with near-infrared light17 have been used to detect and quantify the presence of lesions in subsurface enamel. Indeed, the demineralization process is accompanied by a change in the tooth scattering coefficient,12,13 in the ability of enamel and dentine to depolarize incident light,18 and in the spectral response of teeth. In fact, increased scattering coefficients and ability to depolarize light, as well as a loss in autofluorescence, are demonstrated in the case of enamel lesions. Optical coherence tomography has also demonstrated its capacity to generate surface and subsurface images of enamel samples using near-infrared light19 and to provide precise information. Speckle imaging has emerged over the past decade as a powerful yet low-cost technique for imaging biological media. In addition to its accessibility and simplicity, this method allows in vivo measurements and is not restricted to clinical research in laboratories. It has previously been considered as a tool for assessing dental erosion, where Koshoji et al.20 showed the sensitivity of speckle image contrast ratios toward the degree of dental erosion in early stages after exposure to erosive acidic beverages using coherent visible light. Studies were also undertaken using light polarization to evaluate surface and subsurface structures.21 For instance, Everett et al.18 were able to identify precarious and carious lesions by detecting the change of polarization of incident light backscattered from dental tissues. Both speckle and polarized light imaging were proven to be sensitive for the discrimination of surface and bulk-scattering.22,23 In this study, we report and prove the capacity of polarized laser speckle imaging to detect early demineralization stages, even before the appearance of visible signs that an experienced dentist can spot while performing a checkup. Information given by speckle images is combined with the ones provided by polarization, making it a sensitive technique for the detection of early dental erosion stages. 2.Experimental Study2.1.Sample HandlingFive human molars extracted for orthodontic reasons and showing no signs of visible erosion or decay after a detailed visual examination by experienced dentists were used in our study. The teeth were exposed to an acidic beverage [noncaffeinated soft drink (7-Up), ] during different immersion cycles, day after day for 2 weeks. Before exposure to the acidic beverage, the tooth surface had not been treated. When taken out of the acidic solution, the teeth were washed with mineral water and dried before speckle measurements were performed on both sides of each tooth. Teeth were preserved in a humid environment at room temperature after each experiment. During the period of our study, the samples did not undergo sufficient demineralization (see Fig. 1) for detection to become possible by frequently used conventional methods, such as x-ray measurements, and no white spot lesions were visible to trained dentists. 2.2.Speckle Experimental SetupThe experimental setup is presented in Fig. 2. A green He–Ne laser (543 nm, 5 mW) is shot through a polarizer and onto the sample. The backscattered light then goes through an analyzer where it is collected by a CMOS camera (Photon Focus, pixel size of , 12 bits) in the direction. Speckle images of the samples were acquired at 10 ms exposure time. 2.3.Extracted ParametersIn the analysis of speckle patterns, both spatial and temporal aspects coupled to polarimetric measurements were investigated. The changes taking place in the teeth during the demineralization are accompanied by a change in their ability to depolarize incident light. In order to detect this variation, one of the parameters studied is the extinction ratio, defined in previous studies18 as follows: ER ranges between 0 and 1; an ER value of 1 indicates a total loss of incident polarization, whereas reflects a complete preservation of the incident polarization. Considering our image collection method, is the mean intensity measured at the camera surface when the polarization of the incident light is fully transmitted, and is the mean intensity when the transmitted light results from a cross-linear polarization.We also define the degree of linear polarization given by where indicates a total loss of the initial polarization state and shows a preservation of the initial polarization state.Teeth surface erosion was also monitored previously20 using laser contrast analysis (LASCA). The average contrast of the speckle image is given by where is the speckle image mean intensity and is its standard deviation. The contrast ratio CR is defined by with standing for the contrast of the acquired image on a healthy tooth surface and on an eroded one.Another parameter of interest in our study is the average speckle grain size , estimated by the width at half maximum of a horizontal cut taken from the speckle image autocorrelation function. This function is calculated by computing the inverse Fourier transform of the normalized power spectral density of the diffusing zone that is the square of the modulus of the Fourier transform of the intensity. The autocorrelation function is given by The differences between linearly co- and cross-polarized speckle grains sizes and 24 were also computed as follows: The two dots in Eq. (6) can be replaced by or , referring to the horizontal and vertical axes, respectively.Similarly to the LASCA technique, temporal correlation of speckle images provides information about speckle dynamics. A series of the acquired speckle images was also temporally analyzed using a cross-correlation analysis of the first speckle image with the image number as follows:25 where the time , is the time step, , and are the pixel positions in the image, and is the pixel size.3.Results and Discussion3.1.Polarimetry ResultsThe information carried by light polarization is deduced directly from mean intensities of images recorded using different light polarizations. The ratio of cross- versus copolarized light scattered [Eq. (1)] from the enamel is plotted in Fig. 3. A decrease in the ER is observed as the tooth undergoes demineralization. Fig. 3Variation of the extinction ratio as a function of duration of tooth exposure to acid (in minutes). Error bars correspond to the standard deviation. Circles correspond to experimental data. Lines are guides for the eyes.  Figure 4 represents the variation of the parameter as teeth undergo a cumulative acid attack. As defined in Eq. (2), indicates the depolarization ability of the imaged medium. In fact, both and ER demonstrate sensitivity to structural alteration of the tooth surfaces. The strong depolarization, or in other terms the loss of initial polarization before any acid attack ( and ), can be explained by the predominance of a volume backscattering contribution from subsurface layers of the tooth. Indeed, before the acid attack, tooth surfaces do not scatter highly; therefore, the volume diffusion is essentially captured. Inversely, as teeth become eroded due to an acid attack, the surface degradation leads to more scattering events by the enamel surface, thus less loss of initial polarization. A brutal change of slopes in our curves (as indicated by the eye-guides in Figs. 3 and 4) at around 70 min of acid exposure is observed, indicating that the surface scattering contribution overcomes the volume scattering contribution. These interpretations are supported in the next section by information provided by the analysis of spatial and temporal aspects of speckle images. 3.2.Polarized Speckle ResultsIn this section, we consider the effects of the duration of tooth exposure to acid on first- and second-order statistics parameters and associate the variations to the surface roughness based on results reported in Ref. 26. The measured values of the contrast ratio (CR) defined in Eq. (4) are presented in Fig. 5. As the duration of tooth exposure to acid increased, variations in the image contrast occur; the contrast is larger in the case of eroded enamels. This behavior was also previously measured in Ref. 20. Furthermore, the change of the CR curve slope at around 70 min of acid exposure is similar to the one observed in the curves representing the variations of the extinction ratio and the linear degree of polarization. Similarly, this parameter is connected to tooth surfaces presenting roughness,26 and therefore to the transition from volume to surface scattering. Fig. 5Variation of speckle contrast ratio (CR) as a function of duration of tooth exposure to acid (in minutes). Error bars correspond to the standard deviation. and are related to the linear co- and cross-polarized analysis configuration, respectively. Symbols correspond to experimental data. Lines are guides for the eyes.  Moreover, when considering second-order statistics of speckle images, the size of the speckle grains can provide information about surface roughness and diffusion depth as and are inversely proportional to the diameter of the diffusing area.27 Thus photons backscattered by the surface, and producing a smaller diffusion spot than the ones penetrating more deeply, lead to larger speckle sizes. The use of polarized light for the computation of and allows a better understanding of these parameters. The speckle grain size differences and are plotted in Fig. 6. Curves represent results collected from one tooth due to the large variability in results caused by the unknown history of the teeth, essentially in terms of oral health hygiene and tooth structure that differs from one person to another. However, for all monitored teeth, similar trends were observed as teeth undergo demineralization due to acid exposure. and change with comparable orders of magnitude for all the monitored teeth. Both parameters are larger for teeth with extended acid exposure durations. This behavior was previously observed in situations where surface backscattering is increasing contrary to volume backscattering.27 Fig. 6Variation of the vertical and horizontal speckle grain size differences as a function of duration of tooth exposure to acid (in minutes).  A temporal analysis tracking the time varying correlation of speckle images was also explored on dried teeth. Figure 7 shows the correlation coefficient temporal evolution for teeth undergoing different acid exposure times. The different curves show the same behavior revealed by the parameters presented previously. Decorrelation is reduced with the increase of teeth acid exposure. curves provide information about the penetration depth of backscattered light reaching the CMOS detector; an increase in surface roughness, as previously mentioned, increases the number of shallow backscattered photons, resulting in less depolarization and a correlation coefficient closer to one. 4.ConclusionWe have demonstrated in an ex-vivo study the sensitivity of polarized speckle imaging in the detection of early dental demineralization stages. Information carried by polarized speckle images indicated a transition from volume to surface backscattering before the appearance of visible erosion signs. The described imaging method is a noncontact and simply implemented tool that will not induce any tooth damage. Its low cost makes it affordable for clinical use. This work should be continued by increasing the number of teeth studied and by using standard techniques to examine structural changes induced on the tooth surface by acid attack. Numerous applications in the clinical field can also be considered, such as the evaluation of dental restoration through remineralization or the evaluation of food and beverage impacts on teeth. AcknowledgmentsThe authors thank the Research Council of Saint-Joseph University and CEDRE Program (ref 30950 XC) for funding the project. ReferencesJ. Hicks, F. Garcia-Godoy and C. Flaitz,
“Biological factors in dental caries enamel structure and the caries process in the dynamic process of demineralization and remineralization (part 2),”
J. Clin. Pediatr. Dent., 28
(2), 119
–124
(2005). http://dx.doi.org/10.17796/jcpd.28.2.617404w302446411 Google Scholar
A. Baumgartner et al.,
“Optical coherence tomography of dental structures,”
Proc. SPIE, 3248 130
–136
(1998). http://dx.doi.org/10.1117/12.306017 PSISDG 0277-786X Google Scholar
G. M. Correr et al.,
“In vitro wear of primary and permanent enamel. Simultaneous erosion and abrasion,”
Am. J. Dent., 20
(6), 394
–399
(2007). Google Scholar
A. T. Hara, R. L. Karlinsey and D. T. Zero,
“Dentine remineralisation by simulated saliva formulations with different Ca and P in contents,”
Caries Res., 42 51
–56
(2008). http://dx.doi.org/10.1159/000111750 CAREBK 0008-6568 Google Scholar
A. Papas et al.,
“Caries clinical trial of a remineralizing toothpaste in radiation patients,”
Gerodontology, 25
(2), 76
–88
(2008). http://dx.doi.org/10.1111/j.1741-2358.2007.00199.x GRDND6 0734-0664 Google Scholar
A. K. Burwell, L. J. Likowski and D. C. Greenspan,
“Calcium sodium phosphosilicate (Novamin®) remineralization potential,”
Adv. Dental Res., 21
(1), 35
–39
(2009). http://dx.doi.org/10.1177/0895937409335621 Google Scholar
M. L. Singh and A. S. Papas,
“Long term clinical observation of dental caries in salivary hypofunction patients using supersaturated calcium phosphate remineralizing rinse,”
J. Clin. Dent., 20
(3), 87
–92
(2009). Google Scholar
A. Young et al.,
“Effect of toothpaste on erosion-like lesions: an in vivo study,”
Eur. J. Oral. Sci., 114
(3), 180
–183
(2006). http://dx.doi.org/10.1111/j.1600-0722.2006.00354.x Google Scholar
J. Field, P. Waterhouse and M. German,
“Quantifying and qualifying surface changes on dental hard tissues in vitro,”
J. Dent., 38
(3), 182
–190
(2010). http://dx.doi.org/10.1016/j.jdent.2010.01.002 Google Scholar
A. F. Hall et al.,
“Application of transverse microradiography for measurement of mineral loss by acid erosion,”
Adv. Dent. Res., 11
(4), 420
–425
(1997). http://dx.doi.org/10.1177/08959374970110040701 Google Scholar
N. Schlueter et al.,
“Methods for the measurement and characterization of erosion in enamel and dentine,”
Caries Res., 45
(1), 13
–23
(2011). http://dx.doi.org/10.1159/000326819 Google Scholar
C. C. Ko et al.,
“Optical scattering characterization of mineral loss,”
J. Dent. Res., 79
(8), 1584
–1589
(2000). http://dx.doi.org/10.1177/00220345000790081001 JDREAF 0022-0345 Google Scholar
C. L. Darling, G. D. Huynh and D. Fried,
“Light scattering properties of natural and artificially demineralized dental enamel at 1310 nm,”
J. Biomed. Opt., 11
(3), 034023
(2006). http://dx.doi.org/10.1117/1.2204603 JBOPFO 1083-3668 Google Scholar
E. Borisova, T. Uzunov and L. Avramov,
“Laser-induced autofluorescence study of caries model in vitro,”
Lasers Med. Sci., 21
(1), 34
–41
(2006). http://dx.doi.org/10.1007/s10103-005-0365-7 Google Scholar
C. M. Zakian et al.,
“Occlusal caries detection by using thermal imaging,”
J. Dent., 38
(10), 788
–795
(2010). http://dx.doi.org/10.1016/j.jdent.2010.06.010 Google Scholar
A. Lussi, R. Hibst and R. Paulus,
“DIAGNOdent: an optical method for caries detection,”
J. Dent. Res., 83
(1), C80
–C83
(2004). http://dx.doi.org/10.1177/154405910408301S16 JDREAF 0022-0345 Google Scholar
R. S. Jones et al.,
“Nearinfrared transillumination at 1310-nm for the imaging of early dental decay,”
Opt. Express, 11
(18), 2259
–2265
(2003). http://dx.doi.org/10.1364/OE.11.002259 OPEXFF 1094-4087 Google Scholar
C. H. Wilder-Smith et al.,
“Quantification of dental erosions in patients with GERD using optical coherence tomography before and after double-blind, randomized treatment with esomeprazole or placebo,”
Am. J. Gastroenterol., 104
(11), 2788
–2795
(2009). http://dx.doi.org/10.1038/ajg.2009.441 Google Scholar
N. H. Koshoji et al.,
“Laser speckle imaging: a novel method for detecting dental erosion,”
PLoS One, 10
(2), e0118429
(2015). http://dx.doi.org/10.1371/journal.pone.0118429 POLNCL 1932-6203 Google Scholar
S. L. Jacques, J. C. Ramella-Roman and K. Lee,
“Imaging skin pathology with polarized light,”
J. Biomed. Opt., 7
(3), 329
–340
(2002). http://dx.doi.org/10.1117/1.1484498 JBOPFO 1083-3668 Google Scholar
J. Sorrentini, M. Zerrad and C. Amra,
“Statistical signatures of random media and their correlation to polarization properties,”
Opt. Lett., 34
(16), 2429
–2431
(2009). http://dx.doi.org/10.1364/OL.34.002429 OPLEDP 0146-9592 Google Scholar
A. Ghabbach et al.,
“Depolarization and enpolarization DOP histograms measured for surface and bulk speckle patterns,”
Opt. Express, 22
(18), 21427
–21440
(2014). http://dx.doi.org/10.1364/OE.22.021427 OPEXFF 1094-4087 Google Scholar
C. Abou Nader et al.,
“Influence of size, proportion, and absorption coefficient of spherical scatterers on the degree of light polarization and the grain size of speckle pattern,”
Appl. Opt., 54
(35), 10369
–10375
(2015). APOPAI 0003-6935 Google Scholar
R. Nassif et al.,
“Retrieving controlled motion parameters using two laser speckle pattern analysis techniques: spatiotemporal correlation and the temporal history speckle pattern,”
Appl. Opt., 52
(31), 7564
–7569
(2013). http://dx.doi.org/10.1364/AO.52.007564 APOPAI 0003-6935 Google Scholar
U. Persson,
“Real time measurement of surface roughness on ground surfaces using laser speckle contrast technique,”
Opt. Laser Eng., 17 61
–67
(1992). http://dx.doi.org/10.1016/0143-8166(92)90012-V Google Scholar
R. Nassif et al.,
“Scattering through fruits during ripening: laser speckle technique correlated to biochemical and fluorescence measurements,”
Opt. Express, 20
(21), 23887
–23897
(2012). http://dx.doi.org/10.1364/OE.20.023887 OPEXFF 1094-4087 Google Scholar
BiographyChristelle Abou Nader earned her master’s degree in sensors and instrumentation from University of Western Brittany (UBO), France, and Saint-Joseph University (USJ), Lebanon in 2013. She is currently pursuing her PhD research in Laser Speckle Imaging at UBO and USJ. Her studies cover the field of optical imaging of diffusing media, more specifically polarized light and speckle imaging, for the noninvasive diagnosis of early disease stages and biomedical applications. Fabrice Pellen received his PhD in optics from the University of Brest, France, in 2000. From 2002 to 2004, he was a researcher at the Laboratory E3I2 (EA3876), at ENSTA Brest, working on signal processing and radar images. He is currently an associate professor at the University of Brest, France, working in the LSOL Laboratory. His research focusses on optics in scattering media, polarimetry, speckle, biophotonics, and lidar systems for underwater target detection. Hadi Loutfi earned his bachelor degree in physics from Saint-Joseph University, Beirut, Lebanon in 2015. He is currently preparing his master’s degree in sensors and instrumentation in the same university. Rassoul Mansour earned his bachelor degree in physics from Saint-Joseph University, Beirut, Lebanon in 2015. He is currently preparing his master’s degree in sensors and instrumentation in the same university. Bernard Le Jeune is curently a professor at Spectrometry and Laser Optics Laboratory at Université de Bretagne Occidentale in Brest, France. He received his PhD in marine optics in 1990 at the Université de Bretagne Occidentale. His current research concerns optical metrology in scattering media, and more particularly polarimetric and coherent aspects in biophotonics and marine environment. Guy Le Brun received his PhD in electronics from Laboratoire de Spectrométrie et Optique Laser (LSOL) at Université de Bretagne Occidentale (UBO), Brest, France in 1992. From this date, he works in the permanent staff of the LSOL as Maître de Conférences. His current areas of research interest include light-tissue interactions, laser speckle, and polarimetry. Marie Abboud received her PhD in atomic physics from Laboratoire Kastler Brossel at Ecole Normale Supérieure and Université Pierre et Marie Curie, Paris, France in 2005. From 2005 to 2013, she worked as an assistant professor and since 2013 as an associate professor at the Faculty of Science at Saint-Joseph University, Beirut, Lebanon, specializing on biophotonics and specifically on optical imaging of diffusing media. In 2009, she received the UNESCO-L’Oréal “For Women In Science” prize. |