

|
|
1.IntroductionBlood flow (BF), the primary source of oxygen delivery to tissue, plays a critical role fueling metabolism.1 Thus, measurement of BF is often utilized to inform clinicians about oxygen delivery and metabolism in tissues such as brain2–5 and muscle.6–8 Per muscle, such measurements hold special significance for patients with peripheral artery disease (PAD), wherein insufficient flow can lead to nutrient deficits, tissue damage, and muscle weakness.9–11 To date, several approaches have been developed for tracking BF in muscle; they range from relatively simple bedside techniques, such as strain-gauge plethysmography (SGP) 12–15 and Doppler ultrasound,16–18 to more complex and low-throughput approaches, such as arterial spin labeled magnetic resonance imaging19–21 and positron emission tomography.22–25 The present paper explores state-of-the-art near-infrared optical methods for measurement of blood perfusion in deep tissues. These optical techniques are attractive because they are noninvasive, portable, inexpensive, and because they offer the possibility for quantitative monitoring of both BF and oxy-/deoxyhemoglobin concentration () continuously and concurrently at the bedside. Herein we comprehensively compare and cross-calibrate two qualitatively different and complementary near-infrared optical BF techniques: venous-occlusion diffuse optical spectroscopy (VO-DOS)26–35 and diffuse correlation spectroscopy (DCS).7,36–40 VO-DOS, also known as venous-occlusion near-infrared spectroscopy, estimates absolute muscle BF from measurement of the linear rate-of-change of total hemoglobin concentration () following venous occlusion.26–35 In their pioneering study, De Blasi et al. demonstrated high correlation between measurements of absolute BF in the forearm with VO-DOS and SGP.29 Unfortunately, since venous occlusion interrupts BF, VO-DOS cannot monitor muscle BF continuously. By contrast, DCS monitors a muscle blood flow index (BFI) continuously in real time.41 DCS is a simple noninvasive technique that derives flow information from measurements of the temporal intensity fluctuations of multiply scattered light.39,40,42–46 The DCS BFI has been validated against a plethora of gold-standard techniques;7,47–52 in these studies, the BFI and especially its variation were demonstrated to be approximately proportional to true BF in a range of subjects and tissue types. However, clinical interpretation of the DCS BFI is complicated by its unusual units of []. To remedy this limitation, Gurley et al. recently carried out exercise studies wherein they employed measurements of absolute BF with VO-DOS to calibrate subsequent continuous DCS measurements for the first time.35 After VO-DOS calibration, they monitored absolute muscle BF with DCS and determined oxygen metabolism during exercise. This promising approach combines the best features of both techniques for the patient: quantitative absolute BF (VO-DOS) and continuous relative BF (DCS) monitoring. However, perhaps because the calibration concept was not a central goal of their paper, they simply assumed that the technique worked. They did not validate the method, and their work did not critically examine the technique’s accuracy, repeatability, and, ultimately, its potential for facilitating absolute BF measurements based on the DCS BFI alone (i.e., without venous occlusion). Clinically, absolute muscle BF monitoring with DCS alone is a significant advance that is especially useful for patients wherein venous occlusion is not feasible, e.g., in patients with calcified vessels or pain due to peripheral artery disease. Our study quantified the repeatability of the calibration method, identified the sources and sizes of errors associated with absolute BF calibration, and determined population-averaged values of these calibration coefficients for determination of absolute BF from DCS alone. For error quantification, we tested the accuracy of the key assumption made in the hybrid VO-DOS/DCS technique, i.e., that is constant. Here, denotes the constant of proportionality between VO-DOS absolute BF and DCS BFI. Since the VO-DOS/DCS technique assumes that remains constant for the entire monitoring session, percent variations in translate into percent error in the measured absolute BF. We directly measured the variability in on the arm of healthy adults over a wide range of BF levels (e.g., for resting muscle and during the hyperemic overshoot after arm-cuff ischemia), across measurement days, and across tissue site (e.g., right arm versus left arm, small probe position shifts on the same arm, etc.). From these measurements, we derived a population-averaged estimate of on the dominant arm and assessed its suitability for determining absolute BF from measured DCS BFIs. We found excellent agreement () between relative BF changes measured by DCS and VO-DOS. Further, we found variability in across BF level, variability across slight shifts in probe position, and variability across measurement days. Thus, the current accuracy of hybrid VO-DOS/DCS technique should not be expected to be better than 10%; care should be taken to minimize probe positional shifts from subject motion (e.g., during exercise), and, if possible, it is valuable to carry out a venous-occlusion calibration prior to each monitoring session. For cases wherein VO-DOS/DCS calibration is not feasible, we derived a population-averaged calibration coefficient of to convert DCS BFI to absolute BF on a subject’s dominant arm, i.e., . We found a significant correlation () between and absolute BF measured with VO-DOS across subjects when tissue optical properties are determined on a subject-by-subject basis. However, individual subject deviations between and BF are considerable (interquartile range of 44%). Improvements in experimental design that should reduce this variability are discussed. Ultimately, the VO-DOS/DCS method will permit clinicians and researchers to measure/monitor absolute skeletal BF continuously and noninvasively during many kinds of activities, and the technique facilitates development of strategies for absolute calibration of DCS. 2.Methods2.1.Diffuse Correlation SpectroscopyDCS is a noninvasive optical method that quantitatively measures tissue BF using speckle correlation techniques.39,40,42–46 Herein, aspects of this technique relevant to our study are highlighted; for additional details, the reader should consult comprehensive reviews and papers.7,36–40 DCS measures the temporal intensity fluctuations of coherent near-infrared (NIR) light that has multiply scattered from moving red blood cells in tissue.7,36,39,40 These fluctuations are quantified by computing the temporal intensity autocorrelation function of the collected light, whose transport through tissue is mathematically described by the correlation diffusion equation. 39,40 The solution to the correlation diffusion equation depends on several parameters including tissue geometry, tissue absorption and reduced scattering coefficients (, ), and a tissue BFI []. In practice, BFI can be broken down further; it is the product of an effective diffusion coefficient () that characterizes red blood cell motion and another parameter () that is proportional to the concentration of moving red blood cells. Note that the correlation diffusion equation solution has been compared to data across a wide range of sample length scales and tissue types, and it has been found to best match the measured signals when the mean-square displacement of the red blood cells is modeled diffusively.36 To quantify BF with DCS, the measured intensity autocorrelation function from muscle is fit to the solution of the correlation diffusion equation in the semi-infinite geometry; from this fit, we extract BFI.39,40,53,54 The tissue absorption and reduced scattering coefficients are required inputs for this fit. For the present study, we measured each subject’s baseline tissue absorption () and baseline reduced scattering () coefficient with a frequency-domain diffuse optical spectroscopy device (Sec. 2.4). Subsequent variations in tissue absorption with respect to baseline during the monitoring session were obtained from DOS intensity changes using the semi-infinite modified Beer-Lambert law55,56 (see Sec. 2.5), with tissue scattering assumed to remain constant. Although the BFI has nontraditional units for flow, we and others have shown that BFI is proportional to true tissue BF.8,47–51,57 Here, we define the proportionality constant, , as the DCS calibration coefficient. Note that this proportionality relation is accurate only for physiological conditions; for example, when flow is very low and a biological zero is probed, then an offset is typically observed, and the simple proportionality relation breaks down.From Eq. (1), it is apparent that fractional/relative changes of tissue blood flow (rBF) compared to a baseline blood flow can be derived from corresponding changes in BFI, i.e., Therefore, knowledge of is not required to derive relative changes in BF from relative changes in BFI. However, knowledge of is required to interpret BFI for any problem needing information about flow in absolute (clinical) units [Eq. (1)]. Thus, the primary goal of this in vivo study is to determine and critically characterize using independent measurements of BF with VO-DOS.2.2.Venous-Occlusion Diffuse Optical SpectroscopyDOS is a well-known technique that uses diffuse NIR light to monitor tissue oxygen saturation and blood volume.51,58,59 The technique of VO-DOS employs DOS to measure changes in blood volume during a venous occlusion, and this information permits estimation of absolute muscle BF.26–35 The venous occlusion of skeletal blood vessels is made with a blood pressure cuff set above venous pressure, but below arterial pressure (e.g., the blood pressure cuff is inflated to ). Practitioners assume that during such an occlusion, venous outflow draining the muscle is reduced to zero, but arterial inflow, accommodated by passive expansion of the muscle vasculature, is initially unaltered. With zero outflow and constant inflow, the muscle blood volume initially increases at a constant rate, and the tissue BF in this case is readily modeled as being proportional to the rate of increase in blood volume. In practice, we measure the rate of increase in the concentration of total hemoglobin ([HbT]) with DOS, which is proportional to the rate of increase in blood volume. The tissue BF is then given by29 where is the concentration of hemoglobin in blood, which is assumed or is measured from a blood gas sample. In our measurements, we assumed to be .35 We will revisit and reconsider the VO-DOS assumptions in Sec. 4.2.3.InstrumentationFor subject monitoring during arm-cuff occlusion experiments (Sec. 2.4), we utilized a custom-designed hybrid optical instrument that could continuously obtain continuous-wave DOS and DCS data (Fig. 1); the instrument is described in detail elsewhere.60 Briefly, the DOS measurements employed five laser diodes (685, 730, 785, 808, and 830 nm; OZ Optics, Ottawa, Canada) coupled to an optical switch (DiCon Fiberoptics Inc., Richmond, California) to sequentially illuminate a single tissue location (S in Fig. 1) via a multimode fiber ( core diameter; OZ Optics). Multiply scattered light emerging at tissue location D in Fig. 1 was detected with a multimode fiber bundle (3.5 mm active area diameter; Dolan-Jenner Industries, Boxborough, Massachusetts) and was coupled to a photomultiplier tube (R928, Hamamatsu, Bridgewater, New Jersey). Fig. 1Schematic of the hybrid instrument for diffuse correlation spectroscopy (DCS) monitoring of blood flow and diffuse optical spectroscopy (DOS) monitoring of tissue total hemoglobin in the forearm. The optical probe head is comprised of four optical fibers that form one DCS source–detector separation pair (FS-FD, 2.5 cm) and one DOS source–detector separation pair (S-D, 2.5 cm). As a rough rule of thumb, the approximate depth of measurement below the skin is one third to one half the source-detector separation, i.e., 1.25 cm (for a more precise relation, see Ref. 61). A tourniquet system (Zimmer Inc., Warsaw, Indiana) is utilized to inflate an arm cuff to 50 mm Hg (shown in green) for venous occlusion and 180 mm Hg (shown in red) for arterial occlusion.  For DCS measurements, a continuous-wave, long-coherence-length, fiber-coupled laser (785 nm, DL785-100-SO, CrystaLaser Inc., Reno, Nevada) illuminated the tissue at location FS in Fig. 1 via a multimode optical fiber (200 μm diameter; OZ Optics). Detected light emerged at location FD in Fig. 1, and a single-photon counting avalanche photodiode (SPCM-AQ4C, Excelitas, Quebec, Canada) was coupled to this output light via a single-mode fiber ( diameter; OZ Optics). A commercial multi-tau hardware correlator (Correlator.com, Bridgewater, New Jersey) computed the intensity autocorrelation function of the detected DCS light in real time. For the DCS and DOS measurements, the source–detector separation was 2.5 cm, and the temporal resolutions were 2.5 and 3 s per measurement, respectively. As an alternative to venous-occlusion calibration, we aimed to derive a population-averaged calibration coefficient [i.e., in Eq. (1)] to convert DCS BFI directly to absolute BF. This idea was stymied, in part, by a mediocre correlation between absolute BF and BFI. We later realized that this mediocre correlation was in large part due to errors in our assumed baseline tissue optical properties for the subjects. To ameliorate these errors, we utilized a frequency-domain ISS Imagent (ISS Medical, Champaign, Illinois) for subject-specific measurement of baseline absolute absorption and reduced scattering coefficients at 830 and 785 nm; this frequency-domain spectroscopy measurement was carried out many days after the cuff-occlusion experiments on the same subjects (Sec. 2.4). 2.4.Subjects and ProtocolsTen healthy adult volunteers (six men, four women, age ) participated in this study after giving their written informed consent. All study procedures were approved by the institutional review board of the University of Pennsylvania. Each subject came to the University of Pennsylvania for four visits. In the first visit, the subject lay supine with his/her right arm extended in a comfortable bed (note that all subjects measured in the study were right-handed, hence the right arm was their dominant arm). The optical probe was secured to the subject’s right forearm with an elastic neoprene strap at position A indicated in Fig. 2(b). A blood pressure cuff was placed around the right bicep. Two cuff ischemia trials were carried out in series; for the arterial occlusion (cuff ischemia) measurement, the blood pressure cuff was inflated to 180 mm Hg [indicated in red in Fig. 2(a)]. In the first trial, measurements of [HbT] were utilized to estimate absolute BF with the VO-DOS method at the baseline and postarterial-occlusion intervals [indicated in green with cuff pressure of 50 mm Hg in Fig. 2(a)]. In the second trial, the DCS BFI was continuously monitored. Since the absolute BF was measured twice at site A (baseline and postarterial-occlusion measurement), we use A to denote the baseline measurement and to denote the postarterial-occlusion measurement. Thus, for each venous-occlusion measurement, a DCS calibration coefficient [; see Eq. (1)] is determined. This information enables us to assess the variability in over a range of BF levels. Fig. 2Schematic of experimental protocols and measurement sites. (a) Visit 1, visit 2, and visit 3 measurement protocols for each subject. The blood pressure cuff is inflated to 50 mm Hg (shown in green) for 1 min to create a venous occlusion, and it is inflated to 180 mm Hg (shown in red) for 3 min to create an arterial occlusion. (b) Schematic of the four different probe positions (A, B, C, and D) for blood flow measurements on the forearm. In visit 1, A and denote the baseline and postarterial-occlusion measurements, respectively. The visit 3 protocol is carried out three times, i.e., at positions B, C, and D.  The reproducibility of the cuff ischemia BF response between trials 1 and 2 in each subject was tested with DCS in a second visit (about two months later). As with the first visit, there were two cuff ischemia trials, and DCS BFI monitoring was done for both of them (i.e., VO-DOS measurements were not done). During the third visit (almost a week later), we examined the variability in DCS calibration coefficient () across multiple tissue sites in each subject. While the subject lay supine, the optical probe was attached to the right forearm [B in Fig. 2(b)] and a set of baseline VO-DOS and DCS measurements of BF were carried out sequentially [Fig. 2(a)]. To determine the effect of slight probe positional changes that could occur from subject motion (e.g., exercise), the probe was removed and reattached to roughly the same position on the forearm [C in Fig. 2(b)], and the VO-DOS/DCS measurements of BF were repeated to derive another . Note that comparison of measurements at sites B and C to site A from visit 1 permits assessment of intrasubject variability across different days. Finally, the probe was attached to a corresponding position on the subject’s left forearm [D in Fig. 2(b)] for another set of VO-DOS and DCS measurements (i.e., to examine variability between the left and right forearm). During the fourth visit (about two months later), the baseline tissue optical properties (, ) on the right arm and left arm of each subject [i.e., at indicated positions in Fig. 2(b)] were measured at 830 and 785 nm using a multiple-distance frequency-domain technique.62,63 Specifically, a commercial ISS Imagent connected to a multiple-distance probe (ISS Medical, , 2.5, 3, 3.5 cm) was utilized. The instrument was calibrated using a solid silicon phantom (ISS Medical) with known optical properties62,63 before the arm measurements. As we will show, these subject-specific measurements of absolute tissue optical properties substantially improved the correlation between absolute BF and DCS BFI. Thus, for applications where it is desirable to use the DCS BFI as a measure of absolute BF (i.e., without venous-occlusion calibration), it is optimal to measure absolute tissue optical properties concomitantly with DCS using a frequency- or time-domain DOS instrument. 2.5.Data Analysis: Measurement of Blood Flow and Diffuse Correlation Spectroscopy Calibration CoefficientAs discussed in Sec. 2.2, VO-DOS BF is derived from the rate of change of [HbT] with respect to time following the onset of venous occlusion. The temporal changes in [HbT] are obtained from time-dependent multispectral DOS intensity measurements via the well-known semi-infinite medium modified Beer-Lambert law.36,55,56 The semi-infinite medium differential path lengths utilized in the modified Beer-Lambert law were computed from the photon diffusion model,64 using subject-specific estimates of baseline tissue absorption and reduced scattering coefficients. To compute absorption at all five wavelengths (685, 730, 785, 808, and 830 nm), the baseline tissue oxyhemoglobin and deoxyhemoglobin concentrations were obtained first from the frequency-domain baseline tissue absorption measurements at 785 and 830 nm36 (assuming 70% muscle water volume fraction63). The average measured tissue optical properties at 785 and 830 nm, and the average computed tissue oxygen saturation and total hemoglobin, are shown in Table 1. These oxyhemoglobin and deoxyhemoglobin concentrations were used to compute tissue absorption at the other three wavelengths.36 For baseline tissue scattering, we found the measured reduced scattering coefficients at 785 and 830 nm to be comparable. Therefore, the average of the two measurements was used as the baseline tissue scattering coefficient for all five wavelengths. Table 1Measured tissue optical properties in right and left arm (results reported as mean±SD; these averages are across the study population (N=10).
Figure 3 shows a temporal trace of [HbT] during venous occlusion in a representative subject. Absolute BF is obtained via Eq. (3), where the rate of change, , was estimated from the slope of the linear regression line fit to [HbT] during venous occlusion (e.g., solid red line in Fig. 3). Fig. 3Temporal [HbT] trace during baseline venous occlusion measurement of a healthy subject. is the time interval (shaded green region) used for the linear regression fit of [HbT] (red solid line) during venous occlusion (VO).  Ideally, [HbT] will increase linearly following the onset of venous occlusion. In practice, however, the inflation of the arm cuff to 50 mm Hg is not instantaneous. Thus, the rate of increase in [HbT] is nonlinear at the earliest times, and then it settles to a steady rate of increase obtained at full cuff inflation. Eventually, the vasculature in the muscle approaches maximal dilation, resulting in an increase in venous blood pressure that reduces arterial inflow. At this point, [HbT] starts to level off toward a maximal value as arterial inflow drops to zero. As shown in Fig. 3, blood flow is determined from the slope of [HbT] during the temporal interval , just after the pressure is increased and where the rate of increase is linear. (We note that for some subjects, the linear regime for fitting had fewer data points than in Fig. 3, leading to greater experimental uncertainty.) This procedure provides a quantitative estimate of absolute muscle BF just prior to each venous occlusion performed. For example, in visit 1 (see Fig. 2), two venous occlusions were done, enabling the measurement of baseline absolute BF, , and measurement of the peak BF achieved from the hyperemic overshoot following cuff ischemia, . These measurements of absolute BF with VO-DOS are then combined with corresponding measurements of DCS BFI (Sec. 2.1) to calculate the DCS calibration coefficient, , via Eq. (1). Continuing with the visit 1 example, the baseline DCS BFI, , was obtained by averaging the measured BFI over times corresponding to baseline temporal fitting interval, , in cuff ischemia trial 1 (i.e., that used for the baseline VO-DOS measurement of , see Fig. 2). Similarly, was obtained by averaging the measured BFI over the times corresponding to overshoot fitting interval, , used for the VO-DOS measurement of . Two estimates of are, therefore, obtained from visit 1: and . During a separate visit on a different day (visit 3), three estimates of , i.e., , , and , were obtained from sequential baseline VO-DOS and DCS muscle measurements acquired at positions B, C, and D indicated in Fig. 2(b). Positions B and C on the right arm are roughly the same and similar to position A (i.e., the probe was removed from position B and then reattached in roughly the same position, C); position D is at the corresponding location on the left arm. 3.Results3.1.Venous-Occlusion Diffuse Optical Spectroscopy Measures Resting Skeletal Muscle Blood Flow AccuratelyWe first establish that our VO-DOS protocol described in Sec. 2.5 produces reasonable estimates of resting skeletal muscle BF. For each subject, we acquired three measurements of resting skeletal muscle BF on the right (dominant) forearm [see Fig. 2(b)]. On average, across 30 VO-DOS measurements [], the resting forearm muscle BF () in the dominant arm was . The resting BF on the left (nondominant) arm was . The average resting BF across both right and left arms was . These measurements of resting BF in the forearm are consistent with previously published findings, which are summarized in Table 2. Table 2Comparison of our venous-occlusion diffuse optical spectroscopy (VO-DOS) measurements of resting blood flow in the forearm (bottom row) to other forearm resting blood flow estimates in the literature measured with VO-DOS and with venous-occlusion strain-gauge plethsmography (VO-SGP) (results reported as mean±SD; n/a, not applicable; N, number of subjects).
3.2.Cuff Ischemia due to Arterial Occlusion Produces a Reproducible ResponseSince we do not determine flow with simultaneous measurements of VO-DOS and DCS, we performed a second experiment to ensure that BF measured with the arterial arm-cuff ischemia model is repeatable (see visit 2 in protocol, Fig. 2). Figure 4 shows representative temporal dynamics of BFI estimated with DCS from a healthy male subject during two sequential cuff ischemia experiments. During the artery occlusions (denoted as AO1 and AO2), DCS-BFI decreases by , and then it rapidly reaches a peak hyperemic overshoot above baseline following cuff deflation. The hemodynamics of the two arterial occlusions were characterized by the magnitudes of the peak hyperemic overshoot, and , and the times to reach the peak overshoot, and [see Fig. 4(b), insets]. Fig. 4Reproducibility of blood flow response following arm-cuff ischemia. (a) Protocol of the DCS measurement for assessing reproducibility of cuff ischemia response in visit 2. (b) Representative changes in DCS blood flow index (BFI) during two consecutive artery occlusions. These responses are characterized by their peak hyperemic magnitudes, and , and the time durations from point of cuff deflation to hyperemic peak, and (indicated in insets).  In the 10 healthy subjects, the peak BF overshoot (, ) and the time-to-peak overshoot (, ) for the two arterial occlusions are in excellent agreement (Fig. 5). Figure 5(a) shows the comparison of the peak BF overshoot of two arterial occlusions, plotting the peak BF overshoot of the second arterial occlusion on the vertical axis against the peak BF overshoot of the first arterial occlusion on the horizontal axis. Figure 5(b) shows the analogous comparison of the time-to-peak overshoot of the two arterial occlusions. Both plots are highly linear () with a slope close to unity (0.98 for peak overshoot, 1.00 for time-to-peak). Thus, we conclude the BF response from sequential cuff ischemia experiments is reproducible. Interestingly, although the hyperemic response is reproducible for a single subject, its magnitude is highly heterogeneous across different subjects (Fig. 5). Similar heterogeneous responses to cuff ischemia were observed in the leg across both healthy subjects and patients with peripheral artery disease.65,66 Fig. 5Comparison of peak blood flow overshoot [, , (a) and (b)] and time-to-peak overshoot [, , (c) and (d)] of two artery occlusions in healthy adult subjects (). The arterial occlusions, respectively, are denoted as AO1 and AO2. The hemodynamics of the two arterial occlusions were characterized by the magnitude of their peak hyperemic overshoot (, ) and their time to reach the peak overshoot (, ). Bland-Altman plots are shown in (b) and (d); the solid horizontal line indicates the mean difference between the two parameters computed across the study population, which is not significantly different than zero. The dotted lines indicate the 95% confidence interval (CI) limits for agreement.  3.3.Agreement of Blood Flow Changes Measured by Diffuse Correlation Spectroscopy and Venous-Occlusion Diffuse Optical SpectroscopyOne aim of this paper is to compare BF dynamics during arm-cuff ischemia measured with VO-DOS and with DCS. Accordingly, in another set of measurements on the same subjects (visit 1 in Fig. 2), two sequential arterial occlusions were carried out wherein the BF response in the first occlusion (trial 1) was measured with VO-DOS, and the BF response in the second occlusion (trial 2) was measured with DCS [Fig. 6(a)]. Since the reproducibility of the cuff ischemia response has been validated (Sec. 3.2), it is reasonable to compare the BF dynamics measured with VO-DOS to the dynamics measured with DCS. Figure 6(b) displays the temporal traces of [HbT] and BFI during trials 1 and 2, respectively, in a representative healthy male subject. As before, the BF response was characterized by comparing the ratio of BF during postischemic hyperemia to a baseline value. Fig. 6Time traces of HbT and BFI during the entire measurement (visit 1). The best linear fit lines (black solid lines) are used for calculation of and . Green shaded and red shaded regions represent the VO and arterial occlusion (AO) periods, respectively. The purple shaded regions indicate the fit interval for determination of absolute blood flow (b) and the corresponding intervals for BFI averaging (c). For the representative subject, the baseline and hyperemia blood flows were estimated to be and . The corresponding DCS estimates of BFI were and . Thus, the subject’s relative hyperemic blood flow overshoot measured with DCS and with VO-DOS are and , respectively. 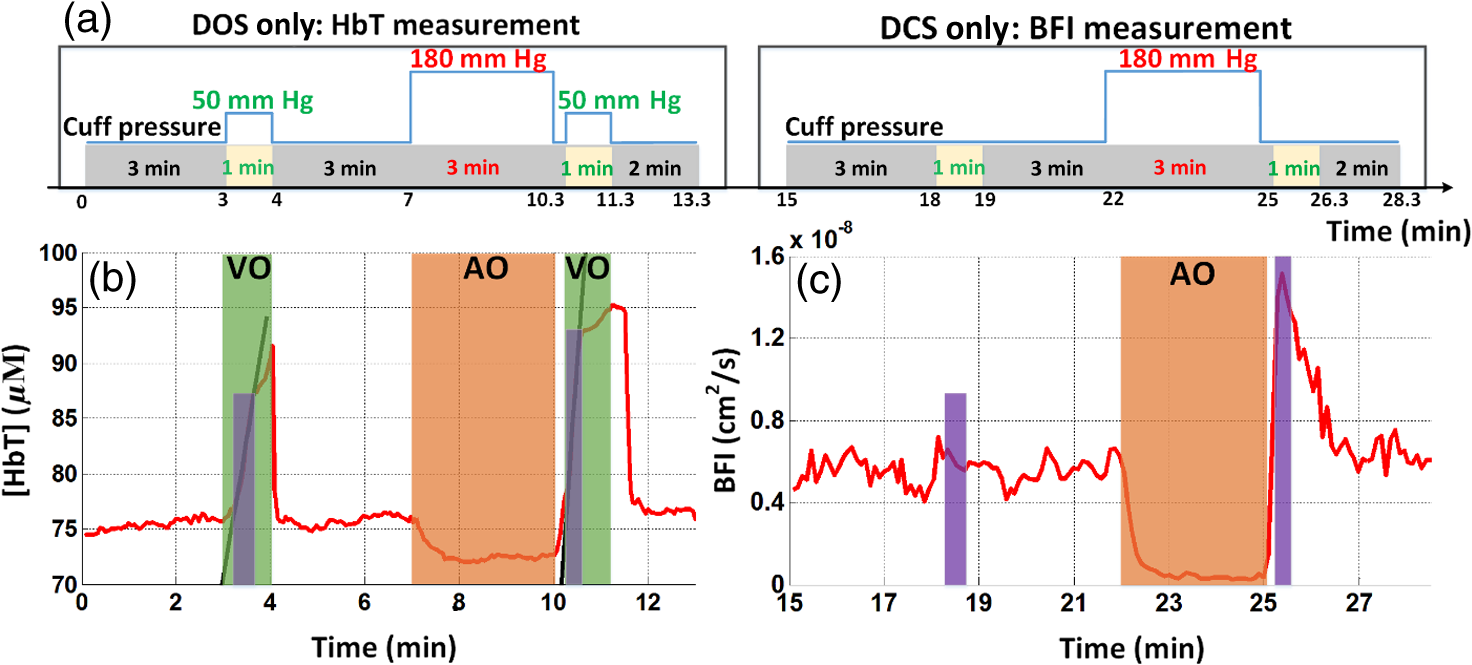 In trial 1, two venous occlusions were performed to estimate the baseline BF to be and the blood flow during hyperemia to be [note that the errors in the BF estimates were calculated by bootstrap resampling of the data over the purple fitting interval in Fig. 6(b)]. As discussed in Sec. 2.5, the baseline and postocclusion DCS BFIs (i.e., , ) were averaged over corresponding time intervals during the venous occlusions of trial 1 [Fig. 6(b)]. For the representative subject in Fig. 6, the DCS measurements in trial 2 were and (). These BFI values were obtained from within the purple averaging interval in Fig. 6(c). Thus, the subject’s relative hyperemic BF overshoot measured with DCS and with VO-DOS are and , respectively. Figure 7(a) is a plot of measured with VO-DOS on the vertical axis against measured with DCS on the horizontal axis for all 10 subjects. A linear regression analysis [Fig. 7(a); solid red regression line, dotted green one-to-one line] and a Tukey mean-difference (or Bland-Altman) analysis67,68 [Fig. 7(b)] show excellent agreement between the two techniques, per estimation of relative BF changes. The slope between relative BF measured by DOS () and DCS () is 0.94 (), and the Pearsons correlation coefficient is . Further, the mean difference in relative BF of between the two techniques was not significantly different from zero (). Fig. 7(a) Relative hyperemic blood flow overshoot from cuff ischemia measured by VO-DOS (vertical axis) and by DCS (horizontal axis) in healthy adults. The solid red line is the linear best-fit with the intercept forced at zero (, ) and the dotted green line is the one-to-one line. is the relative fractional DCS BFI change, i.e., ; is the relative fractional VO-DOS blood flow change, i.e., . (b) Bland-Altman plot of the difference in and versus the mean of these two parameters. The solid horizontal line indicates the mean difference between these two parameters computed across the study population (), which is not significantly different from zero (); the dotted lines indicate the 95% CI limits for agreement.  The observed agreement between the relative flow measured by VO-DOS and DCS in Fig. 7 suggests that the two techniques are sensitive to the same parameter, i.e., muscle BF. The data also further support the notion of using VO-DOS to calibrate DCS for accurate absolute BF monitoring in skeletal muscle. 3.4.Calibration of Diffuse Correlation Spectroscopy Blood Flow With Venous-Occlusion Diffuse Optical Spectroscopy for Absolute Blood FlowWe found that the absolute BF measured with VO-DOS on the right arm significantly correlates with the absolute BFI measured with DCS [, , , see Fig. 8(a)]. We estimate the DCS calibration coefficient [Eq. (1)] from the slope of the best fit line, i.e., ; here, the error is the 95% confidence interval (CI). As an important practical consideration, the subject-specific measurement of baseline optical properties is required to achieve this level of correlation significance. By contrast, when baseline optical properties used to compute the DCS BFI were assumed ( and ),69 the correlation was weaker [, , , see Fig. 8(b)]. Fig. 8Absolute blood flow measured by VO-DOS (vertical axis) compared to the blood flow index measured by DCS (horizontal axis) across measurements []. The labels A, B, and C described in Fig. 2 correspond to three separate measurements on the dominant forearm in each subject using (a) measured optical properties and (b) assumed optical properties (i.e., , ). The red solid line represents the best linear fit to the data. In both panels, the estimate of is the slope of the best linear fit, and the error is the 95% CI for the slope. 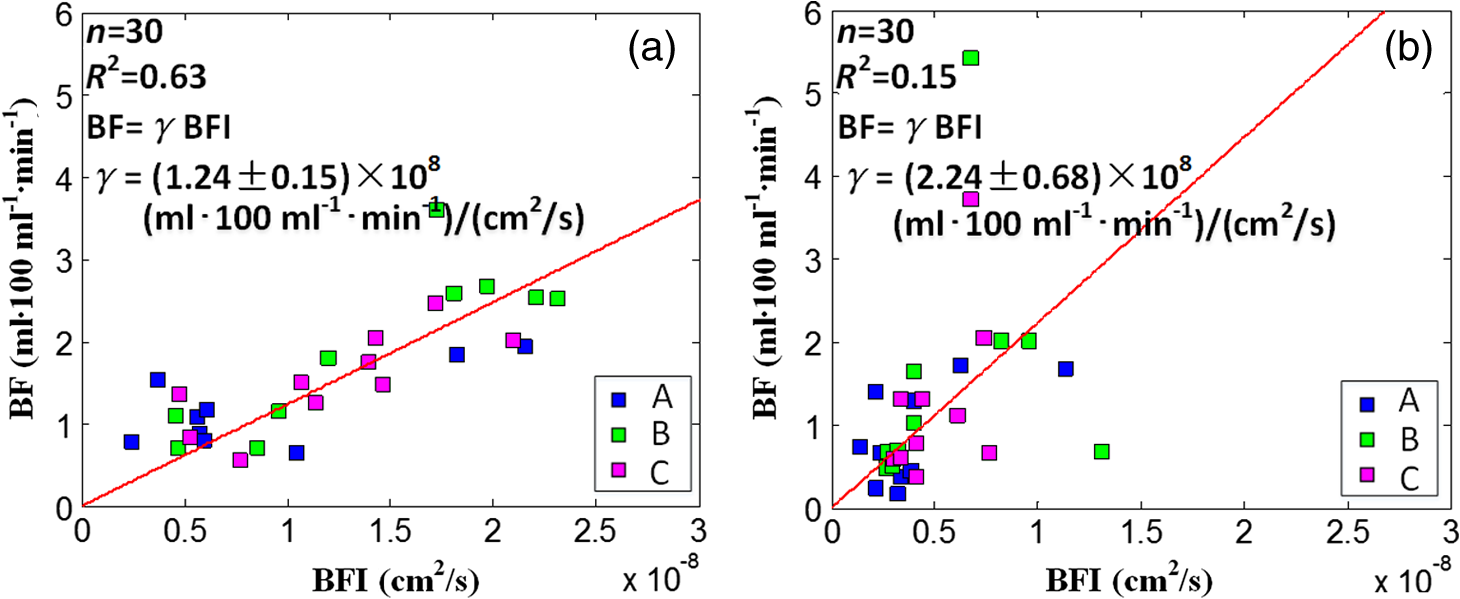 The significant correlation in Fig. 8(a) suggests that the DCS BFI can be used as a surrogate for absolute BF, i.e., . Figure 9(a) is a plot of absolute BF measured with VO-DOS on the vertical axis against absolute calculated from the measured BFI [using on the horizontal axis across measurements. A linear regression line [solid red line in Fig. 9(a)] and a one-to-one line [dotted yellow line in Fig. 9(a)] exhibit moderate correlation () between the two techniques; importantly, there exists considerable variability on a per-subject basis. The interquartile range (75th percentile to 25th percentile, measurements) of the fractional difference is 44%, which is modestly smaller than the intersubject variability in BF of 75% [i.e., has an interquartile range of 75%, where is the mean BF across subjects (Table 2)]. Additionally, the Bland-Altman analysis of these data [Fig. 9(b)] reveals a mean difference in absolute BF of , which is not significantly different than zero (). By contrast to the relative BF results in Fig. 7, however, the mean difference estimated by the 95% CI of the absolute BF results is of order its mean [Fig. 9(b)]; this finding suggests substantial variability on a per-subject basis can exist and should be accounted for, whenever possible. Fig. 9(a) Absolute blood flow measured by VO-DOS (vertical axis; BF) and by DCS [horizontal axis; , as determined from Fig. 8(a)] across measurements []. The labels A, B, and C described in Fig. 2 correspond to three separate measurements on the dominant forearm in each subject using measured optical properties). The solid red line is the linear best-fit () and the dotted yellow line is the one-to-one line. (b) Bland-Altman plot of the difference in and BF versus the mean of these two parameters. The solid horizontal line indicates the mean difference between these two parameters computed across measurements []; the dotted lines indicate the 95% CI limits for agreement.  Thus, it is best to employ in situ calibration of DCS for absolute BF monitoring with VO-DOS on a per-subject basis. For in situ calibration, is derived from the quotient of the absolute BF measurement with VO-DOS and the corresponding BFI measurement with DCS [see Sec. 2.5 and Eq. (1)]. For each subject, we utilized this approach to obtain five estimates of that correspond to the five pairs of VO-DOS and DCS measurements made during visits 1 and 3 (Sec. 2.5). In visit 1 (Fig. 2), two subject-specific estimates of corresponding to the baseline and hyperemic overshoot BF levels were obtained on the dominant arm: and for each subject. In a separate visit on a different day (i.e., visit 3), three subject-specific estimates of were obtained: and , acquired at roughly the same position on the dominant arm (the probe was removed and reattached between measurements), and , acquired at the corresponding position on the nondominant arm. The in situ measurements of , , , , and across subjects are shown in Fig. 10. Interestingly, although the median calibration coefficient is similar for different positions (and flow speeds) on the dominant arm, it is noticeably higher on the nondominant arm (Fig. 10). This observation suggests that the calibration technique can be sensitive to tissue heterogeneities (e.g., differences in tissue vascular structure between right and left arm, discussed further in Sec. 4). Fig. 10Box plots of the five DCS calibration coefficient measurements (, , , , ; see Sec. 2.5) measured on 10 healthy subjects. In both panels, the central mark is the median, the edges of the box are the 25th and 75th percentiles, the whiskers extend to the most extreme data points not considered outliers, and the blue dots represent each subject measurement.  In Table 3, we quantitatively characterize the intrasubject variability in over four paired comparisons across different flow levels (), slightly different positions (), different days (), and different arms (). Both the weighted mean and median were computed for each comparison. The weight that each subject contributes in the weighted mean is set by the inverse of the subject’s variance for the particular variability parameter (see Table 3). To estimate the variance, the standard deviation of the variability parameter (i.e., obtained from the standard deviations of the appropriate coefficients) was added in quadrature with the median of .70 In this procedure, we thus regard the median of as a minimum systematic error to prevent overweighting of particular subjects with small random error bars. To estimate the subject’s random error, the standard deviations in the absolute BF and BFI measurements were employed to compute the standard deviations in the coefficients present in the variability parameter [Eq. (1)]. Here, the standard deviation of the measured slope determined the standard deviation in BF, and the standard deviation in BFI was computed across the measurements in the appropriate venous occlusion time window (e.g., purple shaded regions in Fig. 6). Table 3Comparison of intrasubject variability in the calibration coefficient γ across different blood flow levels, positions, and days. Here, the weighted mean and median are computed over the study population (N=10). The weights used in computing the weighted mean and standard deviation are the inverse variances of the subject measurements (see main text).
As expected from our results in Fig. 7, intrasubject variability in at different BF levels but at the same site and on the same day is small (first comparison in Table 3). Removing and reattaching the probe at a slightly different position on the right forearm had a larger effect on the measured coefficient (second comparison in Table 3). The variability in across different days was even more substantial (notice the large SD of ). Finally, the fourth comparison in Table 3 is a complementary result to Fig. 10, indicating a systematic difference in the coefficient between the dominant (right) and nondominant (left) arms. 4.DiscussionTo our knowledge, the present study is the first direct comparison and characterization of muscle BF changes measured with the techniques of VO-DOS and DCS. An important previous experiment employed the method,35 but it made an implicit assumption that the techniques are comparable and repeatable. Our study rigorously tests this assumption, comprehensively establishes limits of accuracy, provides guidelines for calibration of DCS with VO-DOS, and examines absolute BF monitoring based on DCS BFI without venous-occlusion calibration. First, we used a cuff ischemia paradigm to assess agreement between VO-DOS and DCS per relative BF changes. Interestingly, although the hyperemic BF response to arm-cuff ischemia is reproducible for a single subject, it is highly heterogeneous across different subjects (Figs. 5 and 7). Thus, our experimental scheme facilitated comparison of the two techniques over a wide range of flow levels. Specifically, across 10 subjects, peak hyperemia ranged from 100 to (Fig. 7) and time-to-peak hyperemia ranged from 6 to 24 s (Fig. 5). We observed a high correlation (, ), good agreement [], and small mean difference [i.e., ()] in the cuff ischemia induced BF changes measured with VO-DOS versus DCS (Fig. 7). This observation supports the concept, initially suggested by Gurley et al.,35 of using VO-DOS to calibrate DCS for continuous absolute BF monitoring. This optical technique for absolute muscle BF monitoring is arguably more accurate than the conventional SGP technique, because SGP measures global BF across the whole limb, while VO-DOS and DCS are more localized to muscle tissue,29 i.e., the approximate depth of measurement below the skin is half the source–detector separation (). Calibration of DCS with VO-DOS is also attractive because both methods employ diffuse optical signals that sample approximately the same tissue volume. [Note that variation in depth penetration from absorption differences at NIR wavelengths used for DOS (685 to 830 nm) and DCS (785 nm) is comparatively small and is safely ignored.] Underlying the accuracy of the VO-DOS/DCS BF monitoring technique is the assumption that the constant of proportionality between absolute BF and the DCS BFI, , indeed remains constant for the entire monitoring session. To test this assumption, we measured for muscle at rest (i.e., ) and for the higher hyperemic overshoot BF level following arm-cuff ischemia (i.e., ). On average, differed from by 10% (see variability parameter in Table 3). Thus, when is assumed constant, the percent deviation in corresponds to a percent error in absolute BF [see Eq. (1)]. We therefore expect the percent error in the VO-DOS/DCS measurement of absolute muscle BF to be . Further, during a monitoring session involving muscle motion (e.g., exercise), the optical probe is prone to small position changes that can induce substantial changes in (, see variability parameter in Table 3). This result highlights the importance of firmly securing the probe during a monitoring session to reduce occurrence of positional error. It is also prudent to track probe motion via an accelerometer to aid detection of motion-induced variation. The study revealed a significant correlation between the DCS BFI and absolute muscle BF (VO-DOS) on the dominant right arm [, Fig. 8(a)]. However, we caution that on a per-subject basis, the computation of absolute muscle BF from the DCS BFI using the slope of the best fit line as the coefficient [i.e., ] can deviate considerably from the true BF measured by VO-DOS (, Fig. 9). In fact, the interquartile range (75th percentile to 25th percentile, measurements) of the fractional difference is 44%, which is modestly smaller than the intersubject variability in BF of 75% [i.e., has an interquartile range of 75%, where is the mean BF across subjects (Table 2)]. We will outline strategies to ameliorate these differences below. Based on the present approach without additional strategies (see below), we conclude that it is preferable to carry out an in situ calibration of DCS with VO-DOS prior to every monitoring session. When calibration is personalized to subject and session in this manner, our results suggest that the calibration coefficient will remain roughly constant across a wide range of BF changes (i.e., within 10%, see Fig. 7, Table 3). Our investigation suggests several strategies for improving the accuracy of for measuring absolute BF. First, we found it important to measure and use absolute tissue optical properties for each subject; i.e., when we assumed the same baseline optical properties for every subject, the correlations between DCS BFI and absolute BF were mediocre (see Fig. 8). This conclusion and suggestion is consistent with the findings of Irwin et al.71 Note that our study sets a lower bound on possible improvement due to measurement of absolute optical properties, since we measured baseline optical properties for each subject at only one time-point. We expect further correlation improvements when measurements of absolute optical properties, using frequency- or time-domain instrumentation, accompany each DCS measurement. We stress that these concomitant measurements should be done whenever using DCS BFI to estimate absolute BF. Second, tissue heterogeneity and measurement uniformity across subjects is always a factor when attempting to derive population-averaged calibration. For example, the layer thickness of the adipose tissue located above the muscle72 and the pressure of the probe against the tissue4 are both effects for which we did not control in the present study. Different superficial fat thicknesses can affect the fraction of light that interacts with the muscle; further, muscle typically has a higher blood volume fraction than adipose tissue, and hence, it can have a higher α value and higher BFI even if flow velocities in the two tissues are similar. In our study, we did not measure the thickness of these layers; future studies should attempt to measure/assess tissue heterogeneity. Similarly, increased pressure applied by the probe on the tissue surface can have the effect of reducing the superficial tissue blood flow above the muscle.4 In our study, we did not explicitly control for the probe pressure; in future studies, this effect can be ameliorated by measurement and adjustment of pressure in situ and even by pressure modulation.73 Another source of calibration error can arise from breakdown of the assumptions employed in VO-DOS measurements of BF. The simplest of these issues concerns the factor , i.e., the concentration of hemoglobin in blood, which we assumed to be 35 for all subjects. In the future, direct measurement or estimation of should reduce variation in across subjects. More subtle errors can arise from assumptions about the effects of the 50 mm Hg cuff inflation. VO-DOS assumes that complete venous occlusion occurs at 50 mm Hg. However, depending on the locations of veins and venules in the arm tissues, as well on tissue elastic moduli, it is possible that some veins or venules could remain partially open at 50 mm Hg. Errors associated with this assumption could lead to an underestimation of BF by VO-DOS. Conversely, it is also possible that some arterioles and arteries could decrease in diameter with concomitant increase in vascular resistance at 50 mm Hg; in this case, blood flow at 50 mm Hg would decrease compared to normal. Still other related phenomenology could lead to a breakdown in the assumptions about changing vasculature volume. Indeed, some of these effects could help explain the observed variability in absolute BF across different cuff inflation pressures measured by VO-DOS.33 These sources of VO-DOS error very likely contribute to the observed heterogeneity in our DCS calibration coefficients (see Fig. 10, Table 3). We observed an interesting effect in the calibration of left versus right (dominant) arms. Specifically, substantial variability was found between the calibration coefficients measured on the right and left arms (, Table 3), even when using tissue optical properties measured in-situ for each arm. One potential explanation for this difference derives from tissue microstructure. To further appreciate this argument, recall that the calibration coefficient relates the measured DCS BFI to absolute BF. Formally, DCS BFI is defined as .36 Here, is the fraction of dynamically scattered photons, and characterizes the mean square displacement of the scattering particles (e.g., red blood cells). In general, depends on the nature of the microscopic motions, on the spatial distributions of red blood cell motion, and on photon light paths. The structure of the vasculature is probably different between the right and left arms (the right is the dominant arm in all our subjects) as a result of differences in muscle tone, fat content, size/diameter of arteries/veins, etc. Similarly, could be different between the right and left arms, even though we measured absolute BF to be almost the same ( for the right and for the left arm); this effect could arise as a result of differences in size/diameter/distribution of tissue vasculature. The calibration coefficient implicitly accounts for these and other possible tissue heterogeneities, and detailed explanations for these issues will require further study. Finally, we turn to the potential of this approach for flow measurement in other tissues. Although venous occlusion is easily achieved for skeletal muscle in the limbs (e.g., arms and legs), it is difficult to implement for tissues such as the brain. Another challenge associated with the brain is its depth below the skin ( for adults73), which is comparable to the approximate depth of measurement. Thus, although the technique is sensitive to the brain, signal contamination from superficial tissue layers is not negligible;73 note that for neonates where the superficial tissue layer thickness is smaller, this issue is less of a concern. Therefore, this VO-DOS calibration approach of DCS is currently limited to skeletal muscle BF. Nevertheless, absolute BF monitoring with DCS and VO-DOS has great clinical relevance. For example, it can be applied to measure and monitor absolute BF continuously in the legs of patients with peripheral artery disease (PAD). Absolute BF, in this case, will provide additional information that complements relative flow changes. For instance, several investigators have explored the use of the hyperemic response to cuff ischemia to assess the health of peripheral vasculature,65,74,75 but interpretation of the hyperemic response measurements as a diagnostic tool for vascular health is complicated by significant response heterogeneity in subjects of similar vascular health (e.g., Figs. 5 and 7). The only requirement for continuous absolute BF measurements with DCS is a one-time VO-DOS calibration measurement. In principle, either the VO-DOS method or the VO-SGP method can provide this absolute BF calibration. Importantly, and unlike the VO-DOS and VO-SGP techniques, DCS does not interrupt BF during measurement and can provide absolute BF continuously even during exercise.35,76 Patients with PAD have lower than normal BF to the skeletal muscle, resulting in a mismatch of oxygen supply and metabolic demand.77,78 Knowledge of absolute BF at rest and during exercise has potential to improve diagnostic and treatment options for muscle diseases (i.e., PAD).65,77,79 5.ConclusionsWe have validated VO-DOS as a measure of relative BF against DCS in humans. We also showed that VO-DOS technique can be used to calibrate DCS for skeletal muscle BF. Provided that baseline tissue optical properties are measured, the variability in the calibration coefficient is small enough that there is a significant correlation between DCS BFI and absolute BF. However, the variability can still be an issue, and if possible, it is best to calibrate DCS with VO-DOS prior to every BF monitoring session. Several parameters were identified that could give rise to calibration coefficient variation; in the future, most of these parameters (e.g., probe pressure, , etc.) can be measured and controlled. AcknowledgmentsWe thank David Busch and ShihYu Tzeng for valuable discussions and assistance with measurements. We acknowledge support from the National Institutes of Health (AGY, R01-NS060653, P41-EB015893), the American Heart Association (ABP, 14POST20460161), the China Scholarship Council (201306250114) and the Application Foundation & Advanced Technology Research Program of Tianjin (14JCZDJC33100). ReferencesD. P. Casey, T. B. Curry and M. J. Joyner,
“Measuring muscle blood flow: a key link between systemic and regional metabolism,”
Curr. Opin. Clin. Nutr. Metab. Care, 11
(5), 580
–586
(2008). http://dx.doi.org/10.1097/MCO.0b013e32830b5b34 Google Scholar
A. Villringer and B. Chance,
“Non-invasive optical spectroscopy and imaging of human brain function,”
Trends Neurosci., 20
(10), 435
–442
(1997). http://dx.doi.org/10.1016/S0166-2236(97)01132-6 TNSCDR 0166-2236 Google Scholar
D. A. Boas, A. M. Dale and M. A. Franceschini,
“Diffuse optical imaging of brain activation: approaches to optimizing image sensitivity, resolution, and accuracy,”
NeuroImage, 23 S275
–S288
(2004). http://dx.doi.org/10.1016/j.neuroimage.2004.07.011 NEIMEF 1053-8119 Google Scholar
R. C. Mesquita et al.,
“Influence of probe pressure on the diffuse correlation spectroscopy blood flow signal: extra-cerebral contributions,”
Biomed. Opt. Express, 4
(7), 978
–994
(2013). http://dx.doi.org/10.1364/BOE.4.000978 BOEICL 2156-7085 Google Scholar
M. N. Kim et al.,
“Continuous optical monitoring of cerebral hemodynamics during head-of-bed manipulation in brain-injured adults,”
Neurocrit. Care, 20
(3), 443
–453
(2014). http://dx.doi.org/10.1007/s12028-013-9849-7 Google Scholar
M. Ferrari, M. Muthalib and V. Quaresima,
“The use of near-infrared spectroscopy in understanding skeletal muscle physiology: recent developments,”
Philos. Trans. Ser. A, Math. Phys. Eng. Sci., 369
(1955), 4577
–4590
(2011). http://dx.doi.org/10.1098/rsta.2011.0230 Google Scholar
R. C. Mesquita et al.,
“Direct measurement of tissue blood flow and metabolism with diffuse optics,”
Philos. Trans. Ser. A, Math. Phys. Eng. Sci., 369
(1955), 4390
–4406
(2011). http://dx.doi.org/10.1098/rsta.2011.0232 Google Scholar
G. Yu et al.,
“Validation of diffuse correlation spectroscopy for muscle blood flow with concurrent arterial spin labeled perfusion MRI,”
Opt. Express, 15
(3), 1064
–1075
(2007). http://dx.doi.org/10.1364/OE.15.001064 OPEXFF 1094-4087 Google Scholar
H. L. Gornik and J. A. Beckman,
“Peripheral arterial disease,”
Circulation, 111
(13), e169
–e172
(2005). http://dx.doi.org/10.1161/01.CIR.0000160581.58633.8B CIRCAZ 0009-7322 Google Scholar
E. Selvin and T. P. Erlinger,
“Prevalence of and risk factors for peripheral arterial disease in the United States: results from the National Health and Nutrition Examination Survey, 1999–2000,”
Circulation, 110
(6), 738
–743
(2004). http://dx.doi.org/10.1161/01.CIR.0000137913.26087.F0 CIRCAZ 0009-7322 Google Scholar
W. R. Hiatt, R. K. Rogers and E. P. Brass,
“The treadmill is a better functional test than the 6-minute walk test in therapeutic trials of patients with peripheral artery disease,”
Circulation, 130
(1), 69
–78
(2014). http://dx.doi.org/10.1161/CIRCULATIONAHA.113.007003 CIRCAZ 0009-7322 Google Scholar
I. B. Wilkinson and D. J. Webb,
“Venous occlusion plethysmography in cardiovascular research: methodology and clinical applications,”
Br. J. Clin. Pharmacol., 52 631
–646
(2001). http://dx.doi.org/10.1046/j.0306-5251.2001.01495.x Google Scholar
M. Kooijman et al.,
“Leg blood flow measurements using venous occlusion plethysmography during head-up tilt,”
Clin. Auton. Res., 17
(2), 106
–111
(2007). http://dx.doi.org/10.1007/s10286-007-0402-7 Google Scholar
M. J. Joyner, N. M. Dietz and J. T. Shepherd,
“From Belfast to Mayo and beyond the use and future of plethysmography to study blood flow in human limbs,”
J. Appl. Physiol., 91 2431
–2441
(2001). Google Scholar
R. Joannides, J. Bellien and C. Thuillez,
“Clinical methods for the evaluation of endothelial function—a focus on resistance arteries,”
Fundam. Clin. Pharmacol., 20
(3), 311
–320
(2006). http://dx.doi.org/10.1111/j.1472-8206.2006.00406.x Google Scholar
B. A. Parker et al.,
“Age and microvascular responses to knee extensor exercise in women,”
Eur. J. Appl. Physiol., 103
(3), 343
–351
(2008). http://dx.doi.org/10.1007/s00421-008-0711-0 EJAPFN 1439-6319 Google Scholar
D. Walter Wray et al.,
“Endothelin-1-mediated vasoconstriction at rest and during dynamic exercise in healthy humans,”
Am. J. Physiol., 293
(4), H2550
–H2556
(2007). http://dx.doi.org/10.1152/ajpheart.00867.2007 Google Scholar
C. M. Sehgal et al.,
“Quantitative vascularity of breast masses by Doppler imaging: regional variations and diagnostic implications,”
J. Ultrasound Med., 19
(7), 427
–440
(2000). JUMEDA 0278-4297 Google Scholar
P. Schmitt et al.,
“Quantitative tissue perfusion measurements in head and neck carcinoma patients before and during radiation therapy with a non-invasive MR imaging spin-labeling technique,”
Radiother. Oncol., 67
(1), 27
–34
(2003). http://dx.doi.org/10.1016/S0167-8140(03)00024-0 RAONDT 0167-8140 Google Scholar
J. A. Detre et al.,
“Applications of arterial spin labeled MRI in the brain,”
J. Magn. Reson. Imaging, 35
(5), 1026
–1037
(2012). http://dx.doi.org/10.1002/jmri.23581 Google Scholar
R. L. Wolf and J. A. Detre,
“Clinical neuroimaging using arterial spin-labeled perfusion magnetic resonance imaging,”
Neurotherapeutics, 4
(3), 346
–359
(2007). http://dx.doi.org/10.1016/j.nurt.2007.04.005 Google Scholar
C. J. Price,
“A review and synthesis of the first 20 years of PET and fMRI studies of heard speech, spoken language and reading,”
NeuroImage, 62
(2), 816
–847
(2012). http://dx.doi.org/10.1016/j.neuroimage.2012.04.062 NEIMEF 1053-8119 Google Scholar
A. Drzezga et al.,
“First clinical experience with integrated whole-body PET/MR: comparison to PET/CT in patients with oncologic diagnoses,”
J. Nucl. Med., 53
(6), 845
–855
(2012). http://dx.doi.org/10.2967/jnumed.111.098608 Google Scholar
B. J. Pichler et al.,
“PET/MRI: paving the way for the next generation of clinical multimodality imaging applications,”
J. Nucl. Med., 51
(3), 333
–336
(2010). http://dx.doi.org/10.2967/jnumed.109.061853 Google Scholar
W. Lin et al.,
“Quantitative measurements of cerebral blood flow in patients with unilateral carotid artery occlusion: a PET and MR study,”
J. Magn. Reson. Imaging, 14
(6), 659
–667
(2001). http://dx.doi.org/10.1002/jmri.10021 Google Scholar
A. Edwards et al.,
“Measurement of hemoglobin flow and blood flow by NIRS,”
J. Appl. Physiol., 75
(4), 1884
–1889
(1993). Google Scholar
F. Harel et al.,
“Near-infrared spectroscopy to monitor peripheral blood flow perfusion,”
J. Clin. Monit. Comput., 22
(1), 37
–43
(2008). http://dx.doi.org/10.1007/s10877-007-9105-9 Google Scholar
M. C. P. V. Beekvelt et al.,
“Performance of near-infrared spectroscopy in measuring local consumption and blood flow in skeletal muscle,”
J. Appl. Physiol., 90 511
–519
(2001). Google Scholar
R. A. De Blasi et al.,
“Noninvasive measurement of forearm blood flow and oxygen consumption by near-infrared spectroscopy,”
J. Appl. Physiol., 76 1388
–1393
(1994). Google Scholar
R. A. D. Blasi et al.,
“Comparison of two methods of measuring forearm oxygen consumption () by near infrared spectroscopy,”
J. Biomed. Opt., 2
(2), 171
–175
(1997). http://dx.doi.org/10.1117/12.269893 JBOPFO 1083-3668 Google Scholar
M. C. P. V. Beekvelt et al.,
“Validation of measurement protocols to assess oxygen consumption and blood flow in the human forearm by near infrared spectroscopy,”
Proc. SPIE, 3194 133
–144
(1998). http://dx.doi.org/10.1117/12.301044 Google Scholar
S. Homma et al.,
“Near-infrared estimation of supply and consumption in forearm muscles working at varying intensity,”
J. Appl. Physiol., 80
(4), 1279
–1284
(1996). Google Scholar
C. Casavola et al.,
“Blood flow and oxygen consumption with near-infrared spectroscopy and venous occlusion: spatial maps and the effect of time and pressure of inflation,”
J. Biomed. Opt., 5
(3), 269
–276
(2000). http://dx.doi.org/10.1117/1.429995 JBOPFO 1083-3668 Google Scholar
M. C. P. V. Beekvelt et al.,
“Adipose tissue thickness affects in vivo quantitative near-IR spectroscopy in human skeletal muscle,”
Clin. Sci., 101 21
–28
(2001). http://dx.doi.org/10.1042/cs1010021 Google Scholar
K. Gurley, Y. Shang and G. Yu,
“Noninvasive optical quantification of absolute blood flow, blood oxygenation, and oxygen consumption rate in exercising skeletal muscle,”
J. Biomed. Opt., 17
(7), 075010
(2012). http://dx.doi.org/10.1117/1.JBO.17.7.075010 JBOPFO 1083-3668 Google Scholar
T. Durduran et al.,
“Diffuse optics for tissue monitoring and tomography,”
Rep. Prog. Phys., 73
(7), 076701
(2010). http://dx.doi.org/10.1088/0034-4885/73/7/076701 RPPHAG 0034-4885 Google Scholar
T. Durduran and A. G. Yodh,
“Diffuse correlation spectroscopy for non-invasive, micro-vascular cerebral blood flow measurement,”
NeuroImage, 85 51
–63
(2014). http://dx.doi.org/10.1016/j.neuroimage.2013.06.017 NEIMEF 1053-8119 Google Scholar
E. M. Buckley et al.,
“Diffuse correlation spectroscopy for measurement of cerebral blood flow: future prospects,”
Neurophotonics, 1
(1), 011009
(2014). http://dx.doi.org/10.1117/1.NPh.1.1.011009 Google Scholar
D. Boas, L. Campbell and A. Yodh,
“Scattering and imaging with diffusing temporal field correlations,”
Phys. Rev. Lett., 75
(9), 1855
–1858
(1995). http://dx.doi.org/10.1103/PhysRevLett.75.1855 PRLTAO 0031-9007 Google Scholar
D. A. Boas and A. G. Yodh,
“Spatially varying dynamical properties of turbid media probed with diffusing temporal light correlation,”
J. Opt. Soc. Am. A, 14
(1), 192
–215
(1997). http://dx.doi.org/10.1364/JOSAA.14.000192 JOAOD6 0740-3232 Google Scholar
Y. Shang, K. Gurley and G. Yu,
“Diffuse correlation spectroscopy (DCS) for assessment of tissue blood flow in skeletal muscle: recent progress,”
Anat. Physiol., 3
(2), 128
(2013). http://dx.doi.org/10.4172/2161-0940.1000128 Google Scholar
M. Ninck, M. Untenberger and T. Gisler,
“Diffusing-wave spectroscopy with dynamic contrast variation: disentangling the effects of blood flow and extravascular tissue shearing on signals from deep tissue,”
Biomed. Opt. Express, 1
(5), 1502
–1513
(2010). http://dx.doi.org/10.1364/BOE.1.001502 BOEICL 2156-7085 Google Scholar
T. Binzoni and F. Martelli,
“Assessing the reliability of diffuse correlation spectroscopy models on noise-free analytical Monte Carlo data,”
Appl. Opt., 54
(17), 5320
–5326
(2015). http://dx.doi.org/10.1364/AO.54.005320 APOPAI 0003-6935 Google Scholar
R. S. Chandran et al.,
“Detection and estimation of liquid flow through a pipe in a tissue-like object with ultrasound-assisted diffuse correlation spectroscopy,”
J. Opt. Soc. Am. A, 32
(10), 1888
–1897
(2015). http://dx.doi.org/10.1364/JOSAA.32.001888 Google Scholar
M. Tivnan et al.,
“High frequency sampling of TTL pulses on a Raspberry Pi for diffuse correlation spectroscopy applications,”
Sensors, 15
(8), 19709
–19722
(2015). http://dx.doi.org/10.3390/s150819709 SNSRES 0746-9462 Google Scholar
M. Diop et al.,
“Calibration of diffuse correlation spectroscopy with a time-resolved near-infrared technique to yield absolute cerebral blood flow measurements,”
Biomed. Opt. Express, 2
(7), 2068
–2082
(2011). http://dx.doi.org/10.1364/BOE.2.002068 BOEICL 2156-7085 Google Scholar
T. Durduran et al.,
“Diffuse optical measurement of blood flow, blood oxygenation, and metabolism in a human brain during sensorimotor cortex activation,”
Opt. Lett., 29
(15), 1766
–1768
(2004). http://dx.doi.org/10.1364/OL.29.001766 OPLEDP 0146-9592 Google Scholar
E. M. Buckley et al.,
“Cerebral hemodynamics in preterm infants during positional intervention measured with diffuse correlation spectroscopy and transcranial Doppler ultrasound,”
Opt. Express, 17
(15), 12571
–12581
(2009). http://dx.doi.org/10.1364/OE.17.012571 OPEXFF 1094-4087 Google Scholar
S. A. Carp et al.,
“Validation of diffuse correlation spectroscopy measurements of rodent cerebral blood flow with simultaneous arterial spin labeling MRI; towards MRI-optical continuous cerebral metabolic monitoring,”
Biomed. Opt. Express, 1
(2), 553
–565
(2010). http://dx.doi.org/10.1364/BOE.1.000553 BOEICL 2156-7085 Google Scholar
E. M. Buckley et al.,
“Validation of diffuse correlation spectroscopic measurement of cerebral blood flow using phase-encoded velocity mapping magnetic resonance imaging,”
J. Biomed. Opt., 17
(3), 037007
(2012). http://dx.doi.org/10.1117/1.JBO.17.3.037007 JBOPFO 1083-3668 Google Scholar
C. Zhou et al.,
“Diffuse optical monitoring of hemodynamic changes in piglet brain with closed head injury,”
J. Biomed. Opt., 14
(3), 034015
(2009). http://dx.doi.org/10.1117/1.3146814 JBOPFO 1083-3668 Google Scholar
V. Jain et al.,
“Cerebral oxygen metabolism in neonates with congenital heart disease quantified by MRI and optics,”
J. Cereb. Blood Flow Metab., 34
(3), 380
–388
(2014). http://dx.doi.org/10.1038/jcbfm.2013.214 Google Scholar
D. Pine et al.,
“Diffusing wave spectroscopy,”
Phys. Rev. Lett., 60
(12), 1134
–1137
(1988). http://dx.doi.org/10.1103/PhysRevLett.60.1134 PRLTAO 0031-9007 Google Scholar
M. Stephen,
“Temporal fluctuations in wave propagation in random media,”
Phys. Rev. B, 37
(1), 1
–5
(1988). http://dx.doi.org/10.1103/PhysRevB.37.1 PRBMDO 1098-0121 Google Scholar
D. T. Delpy et al.,
“Estimation of optical pathlength through tissue from direct time of flight measurement,”
Phys. Med. Biol., 33
(12), 1433
–1442
(1988). http://dx.doi.org/10.1088/0031-9155/33/12/008 PHMBA7 0031-9155 Google Scholar
S. R. Arridge, M. Cope and D. T. Delpy,
“The theoretical basis for the determination of optical pathlengths in tissue: temporal and frequency analysis,”
Phys. Med. Biol., 37
(7), 1531
(1992). http://dx.doi.org/10.1088/0031-9155/37/7/005 PHMBA7 0031-9155 Google Scholar
D. Milej et al.,
“Time-resolved detection of fluorescent light during inflow of ICG to the brain—a methodological study,”
Phys. Med. Biol., 57
(20), 6725
–6742
(2012). http://dx.doi.org/10.1088/0031-9155/57/20/6725 PHMBA7 0031-9155 Google Scholar
V. Ntziachristos et al.,
“MRI-guided diffuse optical spectroscopy of malignant and benign breast lesions,”
Neoplasia, 4 347
–354
(2002). http://dx.doi.org/10.1038/sj.neo.7900244 Google Scholar
D. Roblyer et al.,
“Feasibility of direct digital sampling for diffuse optical frequency domain spectroscopy in tissue,”
Meas. Sci. Technol., 24
(4), 045501
(2013). http://dx.doi.org/10.1088/0957-0233/24/4/045501 Google Scholar
M. Kim,
“Application of hybrid diffuse optics for clinical management of adults after brain injury,”
University of Pennsylvania, Philadelphia
(2013). Google Scholar
M. S. Patterson et al.,
“Absorption spectroscopy in tissue-simulating materials: a theoretical and experimental study of photon paths,”
Appl. Opt., 34
(1), 22
–30
(1995). http://dx.doi.org/10.1364/AO.34.000022 APOPAI 0003-6935 Google Scholar
D. M. Hueber et al.,
“Non-invasive and quantitative near-infrared haemoglobin spectrometry in the piglet brain during hypoxic stress, using a frequency-domain multidistance instrument,”
Phys. Med. Biol., 46
(1), 41
–62
(2001). http://dx.doi.org/10.1088/0031-9155/46/1/304 PHMBA7 0031-9155 Google Scholar
D. J. Wallace et al.,
“Results of a 95-subject human clinical trial for the diagnosis of peripheral vascular disease using a near-infrared frequency domain hemoglobin spectrometer,”
Proc. SPIE, 3597 300
–316
(1999). http://dx.doi.org/10.1117/12.356821 PSISDG 0277-786X Google Scholar
S. Fantini et al.,
“Non-invasive optical monitoring of the newborn piglet brain using continuous-wave and frequency-domain spectroscopy,”
Phys. Med. Biol., 44
(6), 1543
–1563
(1999). http://dx.doi.org/10.1088/0031-9155/44/6/308 PHMBA7 0031-9155 Google Scholar
E. K. Englund et al.,
“Combined measurement of perfusion, venous oxygen saturation, and skeletal muscle T2* during reactive hyperemia in the leg,”
J. Cardiovasc. Magn. Reson., 15 70
(2013). http://dx.doi.org/10.1186/1532-429X-15-70 Google Scholar
E. K. Englund et al.,
“Multiparametric assessment of vascular function in peripheral artery disease: dynamic measurement of skeletal muscle perfusion, blood-oxygen-level dependent signal, and venous oxygen saturation,”
Circ. Cardiovasc. Imaging, 8
(4),
(2015). http://dx.doi.org/10.1161/CIRCIMAGING.114.002673 Google Scholar
D. Altman and J. Bland,
“Measurement in medicine: the analysis of method comparison studies,”
Statistician, 32 307
–317
(1983). http://dx.doi.org/10.2307/2987937 Google Scholar
D. Altman and J. Bland,
“Statistical methods for assessing agreement between two methods of clinical measurement,”
Lancet, 327
(8476), 307
–310
(1986). http://dx.doi.org/10.1016/S0140-6736(86)90837-8 LANCAO 0140-6736 Google Scholar
S. L. Jacques,
“Optical properties of biological tissues: a review,”
Phys. Med. Biol., 58
(11), R37
–61
(2013). http://dx.doi.org/10.1088/0031-9155/58/11/R37 PHMBA7 0031-9155 Google Scholar
J. R. Taylor, An Introduction to Error Analysis, 2nd ed.University Science Books, Sausalito, California
(1997). Google Scholar
D. Irwin et al.,
“Influences of tissue absorption and scattering on diffuse correlation spectroscopy blood flow measurements,”
Biomed. Opt. Express, 2
(7), 1969
–1985
(2011). http://dx.doi.org/10.1364/BOE.2.001969 BOEICL 2156-7085 Google Scholar
A. Kienle and T. Glanzmann,
“In vivo determination of the optical properties of muscle with time-resolved reflectance using a layered model,”
Phys. Med. Biol., 44
(11), 2689
–2702
(1999). http://dx.doi.org/10.1088/0031-9155/44/11/301 PHMBA7 0031-9155 Google Scholar
W. B. Baker et al.,
“Pressure modulation algorithm to separate cerebral hemodynamic signals from extracerebral artifacts,”
Neurophoton, 2
(3), 035004
(2015). http://dx.doi.org/10.1117/1.NPh.2.3.035004 Google Scholar
G. Yu et al.,
“Time-dependent blood flow and oxygenation in human skeletal muscles measured with noninvasive near-infrared diffuse optical spectroscopies,”
J. Biomed. Opt., 10
(2), 024027
(2005). http://dx.doi.org/10.1117/1.1884603 JBOPFO 1083-3668 Google Scholar
W. C. Wu et al.,
“Skeletal muscle microvascular flow in progressive peripheral artery disease: assessment with continuous arterial spin-labeling perfusion magnetic resonance imaging,”
J. Am. Coll. Cardiol., 53
(25), 2372
–2377
(2009). http://dx.doi.org/10.1016/j.jacc.2009.03.033 JACCDI 0735-1097 Google Scholar
Y. Shang et al.,
“Effects of muscle fiber motion on diffuse correlation spectroscopy blood flow measurements during exercise,”
Biomed. Opt. Express, 1
(2), 500
–511
(2010). http://dx.doi.org/10.1364/BOE.1.000500 BOEICL 2156-7085 Google Scholar
K. J. Stewart et al.,
“Exercise training for claudication,”
N. Engl. J. Med., 347
(24), 1941
–1951
(2002). http://dx.doi.org/10.1056/NEJMra021135 Google Scholar
III E. R. Mohler and H. Litt, Atlas of Vascular Medicine: A Case-Based Approach to Current Management, Demos Medical, New York
(2011). Google Scholar
W. R. Hiatt,
“Medical treatment of peripheral arterial disease and claudication,”
N. Engl. J. Med., 344
(21), 1608
–1621
(2001). http://dx.doi.org/10.1056/NEJM200105243442108 Google Scholar
BiographyZhe Li is a doctoral student in biomedical engineering in the School of Precision Instrument and Opto-Electronics Engineering, Tianjin University. She was a visiting scholar in physics and astronomy at the University of Pennsylvania from September 2013 to September 2015. Her research interests include utilizing diffuse optics techniques to measure hemodynamics in skeletal muscles. Wesley B. Baker is a postdoctoral researcher in physics and astronomy at the University of Pennsylvania. He graduated with a PhD in physics at the University of Pennsylvania in May 2015. His research interests include cerebral blood flow and oxygen metabolism monitoring with optical spectroscopy/imaging techniques. Ashwin B. Parthasarathy is a postdoctoral researcher in physics and astronomy at the University of Pennsylvania. He graduated with a PhD in biomedical engineering from the University of Texas at Austin in 2010 and was subsequently a postdoctoral researcher at Boston University before moving to Penn in 2012. His research focuses on the imaging and monitoring of cerebral blood flow during and after stroke, with laser speckle contrast imaging and diffuse correlation spectroscopy, respectively. Tiffany S. Ko is an HHMI Interfaces in Imaging doctoral student in the Department of Bioengineering at the University of Pennsylvania. She completed her undergraduate training in electrical engineering at Princeton University in 2009 and received her master’s in bioengineering at the University of California, Berkeley, in 2012. Currently, she works jointly with the Yodh Biomedical Optics Group and Licht Neurovascular Imaging Group at the Children’s Hospital of Philadelphia. Detian Wang is an assistant professor at the Institute of Fluid Physics in China. He received his master’s in optics from the Institute of Fluid Physics in 2008. He was a visiting scholar in physics and astronomy at the University of Pennsylvania from July 2013 to September 2015. His research interests include biology tissue monitoring with diffuse light and optoelectronic measurement. Steven Schenkel is a research coordinator in the Yodh lab at the University of Pennsylvania. He completed his undergraduate training in experimental physics at the University of Pennsylvania in 2010 and assists in organizing and conducting research studies to investigate cerebral hemodynamics in multiple patient populations. Turgut Durduran was trained at the University of Pennsylvania. In 2009, he moved to ICFO–The Institute of Photonic Sciences, Spain, where he leads the medical optics group. His research interests revolve around the use of diffuse light to noninvasively probe tissue function. The group develops new technologies and algorithms and routinely translates them to preclinical, clinical, and industrial applications. Gang Li is a professor at the School of Precision Instrument and Opto-Electronics Engineering, Tianjin University. His major research interests include biomedical information detection, diffuse reflectance spectroscopy applied in tongue diagnosis, and noninvasive blood components analysis with dynamic spectrum. Arjun G. Yodh is the James M. Skinner professor of science and the director of the Laboratory for Research on the Structure of Matter at the University of Pennsylvania. His current interests span fundamental and applied questions in condensed matter physics, medical and biophysics, and optical sciences. He has extensive experience utilizing diffuse optics techniques for monitoring and imaging of hemodynamics in living tissues. |
|||||||||||||||||||||||||||||||||||||||||||||||||||||||||||||||||||||||||||||||||||||||||||||||||||||||||||


