
|
|
1.IntroductionPhotodynamic therapy (PDT) is currently undergoing intensive clinical investigations as an adjuvant treatment for proliferative disorders including cancer.1–3 PDT involves the administration of a photosensitizer, which preferentially accumulates in diseased cells, followed by light excitation at a specific wavelength.1,3–5 The photosensitizer transfers energy to ground-state tissue oxygen () and generates reactive singlet state oxygen (), which is the main cytotoxic species causing a therapeutic effect upon reacting with the surrounding biological molecules. Although PDT targets and destroys the malignant cancer cells in a way that causes significantly less side effects compared with current standard treatments such as surgery, radiation therapy, and chemotherapy,1–3 there are still obstacles preventing the widespread clinical use of PDT. Because PDT is a triple component treatment that includes interactions between light, photosensitizer, and , a well-defined single PDT dosimetry quantity that ties in with these components and correlates better with PDT efficacy than the well-established quantity of PDT dose will also be beneficial to ensure reliable clinical outcome for PDT clinical trials. Under well-oxygenated conditions, PDT dose, which is proportional to the time integral of the product of local photosensitizer concentration and light fluence rate, is the most well-defined dosimetric quantity and a good predictor of treatment outcome in explicit PDT dosimetry.6,7 However, theoretical and in vivo mouse studies have shown that due to oxygen consumption by PDT, severe hypoxia can be created at high fluence rates () during light illumination and can result in less effective PDT treatment.6,7 To quantitatively account for the biological damage done by PDT, it was suggested to account for production during PDT based on its luminescence signals at a wavelength of 1270 nm.8,9 Correlating the concentration of reactive singlet oxygen, , with the treatment outcome has been a long-term goal in PDT dosimetry. However, the weak and short lifetime of the luminescence signals due to the rapid reactions of with biological environments is a major obstacle to the use of this method in clinical and interstitial applications.8,9 An empirical four-parameter macroscopic model was proposed to calculate the apparent concentration.7,10 This model utilizes the complete set of PDT kinetic equations, light diffusion, and oxygen supply mechanism, which can be applied in any clinical treatment geometry. In this macroscopic model, the four PDT parameters of specific oxygen consumption rate (), ratio of photobleaching to reaction between and cellular targets (), ratio of triplet state () phosphorescence to reaction between and (), and oxygen supply rate to tissue () can be determined by introducing a fitting quantity called the “reacted singlet oxygen threshold concentration ().”7,10 The aim of this study was to use the macroscopic model to optimize the magnitude of the photochemical parameters (, , , ) and for in vivo 2-(1-hexyloxyethyl)-2-devinyl pyropheophorbide-a (HPPH)-mediated PDT. A series of PDT, including a range of total energy released per unit length, 12 to [light source strength to and exposure times from 400 to 3600 s], was used to induce different necrotic radii in mouse models bearing radiation-induced fibrosarcoma (RIF) tumors. Based on the data obtained from the control mice (no HPPH injection, but catheter insertion and light exposure), the spontaneous necrosis and the necrosis induced by catheter insertion or light exposure were subtracted from the final necrosis measurements. The spatially and temporally resolved was calculated based on the measurements of the tissue optical properties as well as and HPPH concentration in the tumor. Then the PDT-induced necrotic radius was fit to the calculated to obtain the HPPH photochemical parameters and the range of . A preliminary study of HPPH-mediated PDT did not account for spontaneous necrosis, or necrosis induced by catheter insertion and/or illumination, that should be subtracted from the final necrosis measurements. The resulting parameters of and were erroneous and were corrected in this study.11 In order to provide a straightforward comparison of PDT dose to , the magnitude of the radius of necrosis due to PDT was correlated to as well as the total PDT dose at the same tumor depth. 2.Theory and Method2.1.Theory of the Macroscopic 1O2 ModelBy simplifying and combining the energy transfer processes in PDT, a set of governing equations is produced which describes the creation of . These equations are dependent on various parameters such as the light source (), optical absorption () and reduced scattering () coefficients, and photochemical parameters (, , , ). The empirical macroscopic model that includes the spatial distribution of and the complete set of equations describing the photochemical reactions in type II PDT is used to calculate . In this model, the spatial distribution of in the tumor is calculated via Eq. (1), based on the diffusion approximation. Spatial and temporal distribution of the ground state photosensitizer () and and concentrations are obtained by solving a set of coupled time-dependent differential equations initially proposed by Foster et al.12,13 and later expanded by Hu et al.14 and our group 7,10,15 for macroscopic modeling. As the singlet and triplet state photosensitizers ( and ) as well as decay or react with cellular targets immediately after they are created, their lifetimes are very short (nanoseconds to microseconds). Therefore, their temporal changes (, , and ) are set to zero to derive the following equations: where is the maximum oxygen supply rate, and the particular form was validated in a separate study based on uniformly distributed vascular structures.15 is the correction parameter for low photosensitizer concentration, and denotes the initial oxygen concentration. represents the fraction of interacting with the tissue substrate. A more detailed derivation of the equations and parameters can be found elsewhere.72.2.Establishment of the Mouse Tumor Models for In Vivo StudiesThe animal protocol (803929) was approved by the University of Pennsylvania Institutional Animal Care and Use Committee (IACUC). RIF tumors were propagated on the shoulders of female C3H mice (-weeks old; NCI-Frederick, Frederick, Maryland) by the subcutaneous injection of a suspension of . When the tumors reached in diameter and depth ( days after the injection of in vitro maintained cells), the mice received HPPH via tail vein injection. Then following the HPPH drug–light interval of 24 h, interstitial PDT was delivered to induce tumor necrosis [see Figs. 1(a) and 1(b)]. Animal husbandry was provided by the University of Pennsylvania Laboratory Animal Resources in Association for Assessment and Accreditation of Laboratory Animal Care (AALAC)-accredited facilities according to protocols approved by the University of Pennsylvania IACUC. Fig. 1(a) The catheters with a cylindrical diffusing fiber (CDF) and isotropic detector for the interstitial PDT, measurement of the light fluence rate (), tissue optical properties, and HPPH concentration in a mouse bearing radiation-induced fibrosarcoma (RIF) tumor. (b) Hematoxylin and eosin staining of a tumor section treated with HPPH-PDT. The green contour shows the necrotic region induced by PDT.  2.3.Measurements of the Tissue Optical Properties and Interstitial 2-(1-Hexyloxyethyl)-2-Devinyl Pyropheophorbide-a ConcentrationOptical properties in vivo are the critical quantities that determine in tissues. As shown in Fig. 1(a), two parallel catheters were inserted into the tumor, one in the center of the tumor and the other 3 mm from the central catheter, close to the bottom of the tumor edge to measure the tissue optical properties, and .15,16 A 2-mm point source emitting 665-nm light was inserted into the central catheter. The light fluence profile along the second catheter was obtained using an isotropic detector and a motorized system to scan the tumor length. The measured fluence values were fitted using the diffusion approximation to extract the absorption and scattering properties of the tumor. PDT is influenced by the concentration of the photosensitizer. In order to determine the photosensitizer concentration in the tumor, a single side-cut fiber was connected to a dichromatic filter, and served as both an excitation source and a detector. This was inserted into the detector catheter placed 3 mm from the cylindrical diffusing fiber (CDF) to record the interstitial HPPH fluorescence emission spectrum along the catheter axis. The photosensitizer was excited using a 405-nm diode laser. The raw spectrum was fitted to the basic spectrum of HPPH and autofluorescence in the absence of HPPH using singular value decomposition (SVD).17 The attenuation of the photosensitizer fluorescence signal due to the light absorption and scattering by tissue can be corrected by applying a correction factor (CF), which is a function of and . First, a calibration curve was determined between raw fluorescence SVD and various HPPH concentrations ranging from 0 to (0 to ). Then a set of liquid phantoms was prepared with varying optical properties ( to , to ) and a constant HPPH concentration of () using Intralipid (Fresenius Kabi, Uppsala, Sweden) as the scatterer and ink (Parker Quink) as the absorber. Optical properties of each phantom were measured and fluorescence spectra were obtained. An empirical CF of the following equation was used to convert SVD to the corrected SVD ():17 where and are the constants determined from fitting the fluorescence SVD for different optical properties to a single value.After applying the CF [Eq. (5)] to the raw fluorescence SVD, fluorescence obtained from phantom experiments with the same photosensitizer concentration should have the same magnitude. Three separate phantoms with different concentrations of scatterers were used and fit with the equation above to produce a corrected SVD magnitude and values of and [see Fig. 2(a)]. Fluorescence measured in vivo from mice studies was corrected using Eq. (5), and absolute concentration of HPPH was obtained using the calibration curve between the and HPPH concentration in micromoles [see Fig. 2(b)]. Due to the heterogeneous distribution of the photosensitizer in the tissue, in our current assumption we use an average HPPH concentration based on the profile measured over the catheter for all mice in the same group; the standard deviation of HPPH concentration includes the uncertainties of this assumption. Fig. 2(a) Fluorescence singular value decomposition (SVD) amplitude for phantom experiments with different optical properties but the same HPPH concentration. An empirical correction factor (CF) of the form in Eq. (5) was obtained by fitting the fluorescence SVD amplitudes to the same value. corresponds to SVD obtained in a phantom with optical properties of and . (b) Corrected fluorescence singular value decomposition () versus HPPH concentration (in ).  2.4.Ex Vivo Measurements of the 2-(1-Hexyloxyethyl)-2-Devinyl Pyropheophorbide-a ConcentrationInterstitial fluorescence measurements of the photosensitizer concentration as described above were performed for all tumors before PDT. To evaluate the accuracy of the in vivo interstitial fluorescence measurements, ex vivo measurements of the HPPH concentration were performed in another set of mice (five mice) and compared with their in vivo measurements. Mice with tumors were administered HPPH at the same concentration as PDT-treated mice. After the 24 h drug–light interval, the tumors were excised, protected from light, and stored at . For ex vivo analyses, homogenized solutions of the tumors were prepared using Solvable (PerkinElmer, Waltham, Massachusetts). The fluorescence of the homogenized sample was measured by a spectrofluorometer (FluoroMax-3; Jobin Yvon, Inc.) with an excitation wavelength of 405 nm and an emission range from 630 to 750 nm with an emission maximum at 667 nm. The photosensitizer concentration in the tissue was calculated based on the change in fluorescence resulting from the addition of a known amount of HPPH to each sample after its initial reading. The in vivo measurements were correlated to ex vivo data using a linear fit to examine their agreement based on the goodness of the fit (). 2.5.Necrosis Induced by Photodynamic TherapyAfter the in vivo measurements of the HPPH concentration (see Sec. 2.3), the tumors were treated interstitially using a 1-cm-long CDF coupled to the 665-nm diode laser (B&W Tek, Newark, Delaware 19713); LS ranged from 12 to , and the total energy released per unit length ranged from 12 to . To measure the necrotic radius around the linear source, the tumors were excised from euthanized animals and fixed in formalin 24 h after PDT. Then multiple sections, each to apart, were cut perpendicular to the catheter insertion axis and stained with hematoxylin and eosin. Sectioning was performed at the Pathology Core Labs of the Children’s Hospital of Philadelphia. With the assistance of a pathologist, the slides were scanned digitally (Scan Scope CS, Aperio Technologies, Inc., Vista, California). Digital slides [see Fig. 1(b)] were then read to calculate the area () and radius () of the necrosis around the treatment fiber using the equation . The noncircular shape of the necrosis could be caused by inhomogeneities in photosensitizer distribution, oxygen distribution, as well as tissue optical properties; these are assumed to be homogeneous in our current model. For current data processing, an average radius of the necrosis was calculated for the multiple sections collected from each tumor. As the tumors shrank during processing, a shrinkage factor (SF) was also introduced in the calculation of the necrotic radius. SF was determined based on the measurements of the tumor size prior to fixing in formalin and the same measurements after a minimum of 24 h in formalin. The spontaneous necrosis and the necrosis induced by catheter insertion were also subtracted from the final necrosis result, based on data obtained from the control mice with no HPPH injection but catheter insertion and light exposure. Although each treatment condition included one mouse for the control, the PDT-induced necrotic radius for each group of mice was calculated by , where is the mean necrotic radius calculated from all individual controls. This was because of the potential variation due to measurement uncertainties. Table 1 presents the calculated necrotic radius induced by different treatment conditions and the control necrotic radius for each group of mice after SF correction. The measured SF, tissue optical properties, and interstitial drug concentration have also been summarized for each group of mice; all values have been presented as . Table 1Tissue optical properties and photosensitizer concentrations before HPPH-mediated PDT as well as the treatment conditions. Each group contains four mice bearing RIF tumors: three for the treatment and one mouse as a control. The measured values are presented with their standard deviations.
2.6.Diffusion Approximation Solution of the Light TransportThe light transport equation is specified by Eq. (1), which can be solved analytically for a uniformly distributed CDF. The spatial distribution of fluence rate, , within the tumor can be expressed as where is the distance to the point of interest along the radial axis given the center of the CDF as origin; LS is the source power per unit length or linear source strength (); and is the CDF length. The magnitudes of the tissue optical properties, and , are obtained for each mouse from the measurements in Sec. 2.3. is calculated from Figure 3(a) presents the ratio of inside the tumor and LS versus tumor depth. The ratio of and mean light fluence rate (), which is calculated based on the mean tissue optical properties (, ), has been shown in Fig. 3(b); the values for and have been presented with their standard deviation. is defined as the light fluence rate distribution for the mean tissue optical properties, shown as the dark dashed line in Fig. 3(a).2.7.Fitting Necrotic Radius Using to Extract Model ParametersThe information of distribution within the tumor as well as the initial HPPH concentration for each mouse (measured in Sec. 2.3) is passed to Eqs. (2)–(4) in order to calculate the spatiotemporal distribution of the photosensitizer () as well as and concentrations. The magnitude of in tissue is related to partial oxygen pressure () by the coefficient of solubility in tissue () as , from which we can calculate . It is reported that can change from 25.8 to 35.5 mmHg in normal tissue and .15,18,19 As can change from 33.5 to , we considered an average value of in our calculations. The calculated spatial distribution of is used to fit the necrotic radius and extract the four photosensitizer-specific reaction-rate parameters: specific oxygen consumption rate (), ratio of photobleaching to reaction between and cellular targets (), ratio of triplet state () phosphorescence to reaction between and (), oxygen supply rate to tissue (), as well as reacted singlet oxygen threshold concentration (). In the fitting routine, the nonlinear solver starts from initial points selected based on the previous published data for the other photosensitizers (Photofrin, , and mTHPC), reaching different locally optimal solutions.7,10,11,20,21 An initial guess of , , , and is assigned randomly within the ranges of , , 0.7 to , and 0.5 to 1.0 mM, respectively. The current algorithm will encounter convergence issues when given too many free-floating parameters. As the calculated is less sensitive to and quantities compared with the other model parameters, these parameters are fixed at and throughout the subsequent fitting procedure; these values with unknown variance are obtained from the literature.7,21–23 Our fitting routine varies , , , and , so that at the necrotic radius for each mouse remains close to the by minimizing the following error function: where is the computed reacted singlet oxygen at a necrotic radius for ’th mouse and represents the number of mice.Our intention was to find the parameters that produce a global minimum for Eq. (9), rather than to restrict the fitting parameters to within the certain predefined range. About 400 different combinations of the initial parameters have been used in our fitting routine to propose the best globally optimal solution. The fitting outcome for each set of initial parameters is a single value for , , , and applicable to the entire set of animal measurements; Table 2 presents the best obtained fitting parameters with their standard deviations. While each animal’s specific optical properties and sensitizer concentration are used in the calculation, these fundamental parameters were kept the same across animals. Table 2The magnitude of the photochemical parameters for HPPH.
bThe obtained values by the macroscopic model with their overall error. Notice that the value of ξ is significantly larger than that presented in Ref. 11. This is proportional to a change of ϵ from 0.047, used in Ref. 11, to 0.108 based on experimental verification of the original literature value being based on log10 rather than loge, as used in the current study. Each value is expressed as mean±standard deviation. All fitting and simulations have been performed using MATLAB R2013a (64-bit, Massachusetts), which was run on an iMAC OSX version 10.9.5 (processor 3.1 GHz Intel Core 17 and memory 16 GB 1600 MHz DDR3). The calculation time was in seconds for the rate equation and in minutes for the time and spatially coupled differential equations. 2.8.Statistical AnalysesEach measurement was independently carried out three times. The magnitude of each measurement is expressed as standard deviation. Mann–Whitney tests were used to evaluate whether there was a significant difference between the values obtained in vivo and ex vivo for HPPH concentrations. Analyses were carried out using the SPSS 14.0 software; statistical significance was defined at level (95% confidence level). 3.ResultsThe distribution of in tumor tissue was calculated using the light source characteristics and the measured tissue optical properties ( and in Table 1). Based on the results of the calculations, drops substantially versus tumor depth as shown in Fig. 3(a). The maximum fluence rate () drop was 36% that occurred in 5-mm tissue depth with and [see Fig. 3(b)]. HPPH concentration in tumor was acquired interstitially (see Sec. 2.3). However, accurate ex vivo assessments (see Sec. 2.4) would greatly broaden the applicability of the interstitial in vivo measurements. As shown in Fig. 4, the interstitially measured concentrations have been compared with those obtained ex vivo to evaluate the in vivo measurements; each individual data point represents the average value of three measurements with the standard error of the mean. The best linear fit that could be obtained was with (blue solid line). If one considers a slope of 1 as perfect agreement of the two methods, our comparison shows that the agreement between the in vivo and the ex vivo results is less than 10%. Mann–Whitney tests were additionally used to evaluate whether there is a statistically significant difference between the values obtained in vivo and ex vivo; -value was calculated to be 0.31, which shows no statistically significant difference. Fig. 4The interstitially measured photosensitizer concentration versus ex vivo measured HPPH concentration. Each individual data point presents the average of three in vivo and three ex vivo measurements in the same tumor, with the standard deviation of the mean expressed as the bar in the plot. The solid line represents the best linear fit () to the data with . The dashed line represents the line for .  The amounts of were calculated using the macroscopic model including the information of the spatial distribution of in tumor as well as the tissue optical properties and photosensitizer concentration in tumor (see Table 1). Each group of mice has one measurement of the spontaneous necrosis or that due to needle insertion without PDT. The PDT-induced necrotic radius for each group of mice was calculated by , where is the total radius of necrosis. The mean radius of the spontaneous necrosis and the necrosis induced by the catheter insertion, , has been calculated to be after tumor shrinkage correction. The correlation between the amounts of the calculated at the location of the necrotic radius and the measured necrotic radius induced by PDT has been shown in Fig. 5(a). The spontaneous necrosis, the necrosis induced by the catheter insertion and light, was subtracted from the necrotic radius. The magnitude of LS (), total energy released per unit length (), and the initial HPPH concentration for each group are shown in the legend; the radii are presented with error bars of the measurements. Table 2 presents the initial photochemical parameters and those obtained from the fitting routines. The best fit to the data estimated , , , and ; these values are presented with their standard deviation. The fitting parameters did not change very much using several subgroups of mice (data not included) and the variances of the extracted parameters are included in the uncertainties of each parameter. The gray region shown in Fig. 5(a) presents a range for the calculated . The parameters and have been fixed at 11.9 and , respectively. However, we have found that has a huge impact on the value of obtained from the fitting. Based on our fitting algorithm and experimental uncertainties, the error for the parameters and was quite large. The uncertainty is large enough to include the results obtained from our previous preliminary fitting11 as possible values; please note that the extinction coefficient for HPPH should be 2.3 times higher than what was used in the Ref. 11. As shown in Fig. 5(b), the accuracy of our fitting outcomes has been evaluated by the correlation of the PDT-induced necrotic radius calculated by the macroscopic model and the one calculated from the PDT-induced necrotic area. The necrotic radius was calculated using [, the dashed line in Fig. 5(a)] and the profile, where they intersect. The data could be best fit with a linear model () with a goodness of . Fig. 5(a) The amounts of the singlet oxygen concentration () calculated by the macroscopic model versus PDT-induced necrotic radius. The necrotic radius has been calculated for nine groups of mice with tissue optical properties, drug concentration, and treatment condition presented in Table 1. The gray area indicates the possible range of oxygen threshold concentration (), which is ; and the dashed line indicates . (b) Necrotic radius calculated by macroscopic model versus the one calculated from the PDT-induced necrotic area. The error bars show the overall standard deviation of the measurements and the solid line shows the best linear fit to the data with a slope of 1 and a goodness of fit of (see Table 2 for the magnitude of the photochemical parameters and ). 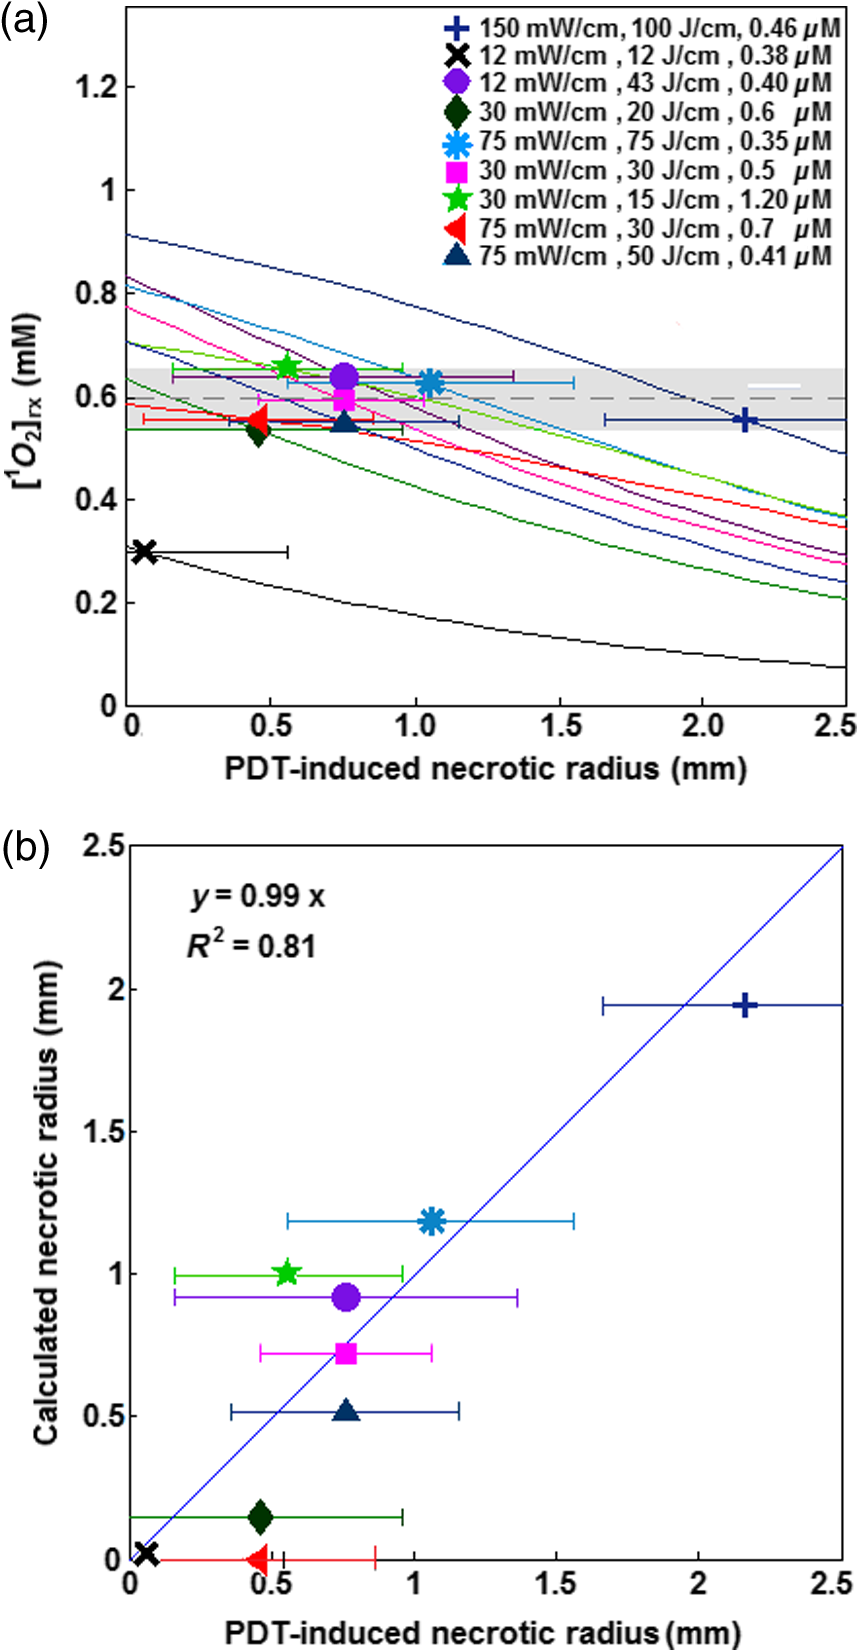 PDT dose was calculated over the entire PDT interval for each group of mice, using the time integral of the product of light fluence rate obtained from Eq. (6) and local HPPH concentration at 3 mm since the sensitizer concentration and optical properties were measured 3 mm from the CDF. The magnitude of the necrotic radius that occurred due to PDT has been correlated to the total PDT dose () in Fig. 6(a). The solid blue line () shows the best fit to the data using a linear function with the goodness of , and the dashed line () shows an independent best fit using a polynomial function with the goodness of . All the treatments induced necrosis in the tumors except for the treatment condition with an energy per unit length of (with and exposure times of 1000 s). This condition induced necrosis comparable with the control mice. Among all treatment conditions, the case with a total energy released per unit length of ( and exposure time of 666 s) has the biggest necrotic radius in the treated tumor. Fig. 6Necrotic radius induced by PDT versus (a) total PDT dose and (b) calculated singlet oxygen concentration () at 3-mm tumor depth. The data are presented for nine groups of mice with properties and treatment conditions presented in Table 1. The solid lines show the best fit to the data using functional forms, for (a) and for (b) with goodness of fit of and 0.95 for (a) and (b), respectively. The dashed lines show an independent fit using polynomial curves. The gray area shows the upper and lower bounds of the fit with 95% confidence level. 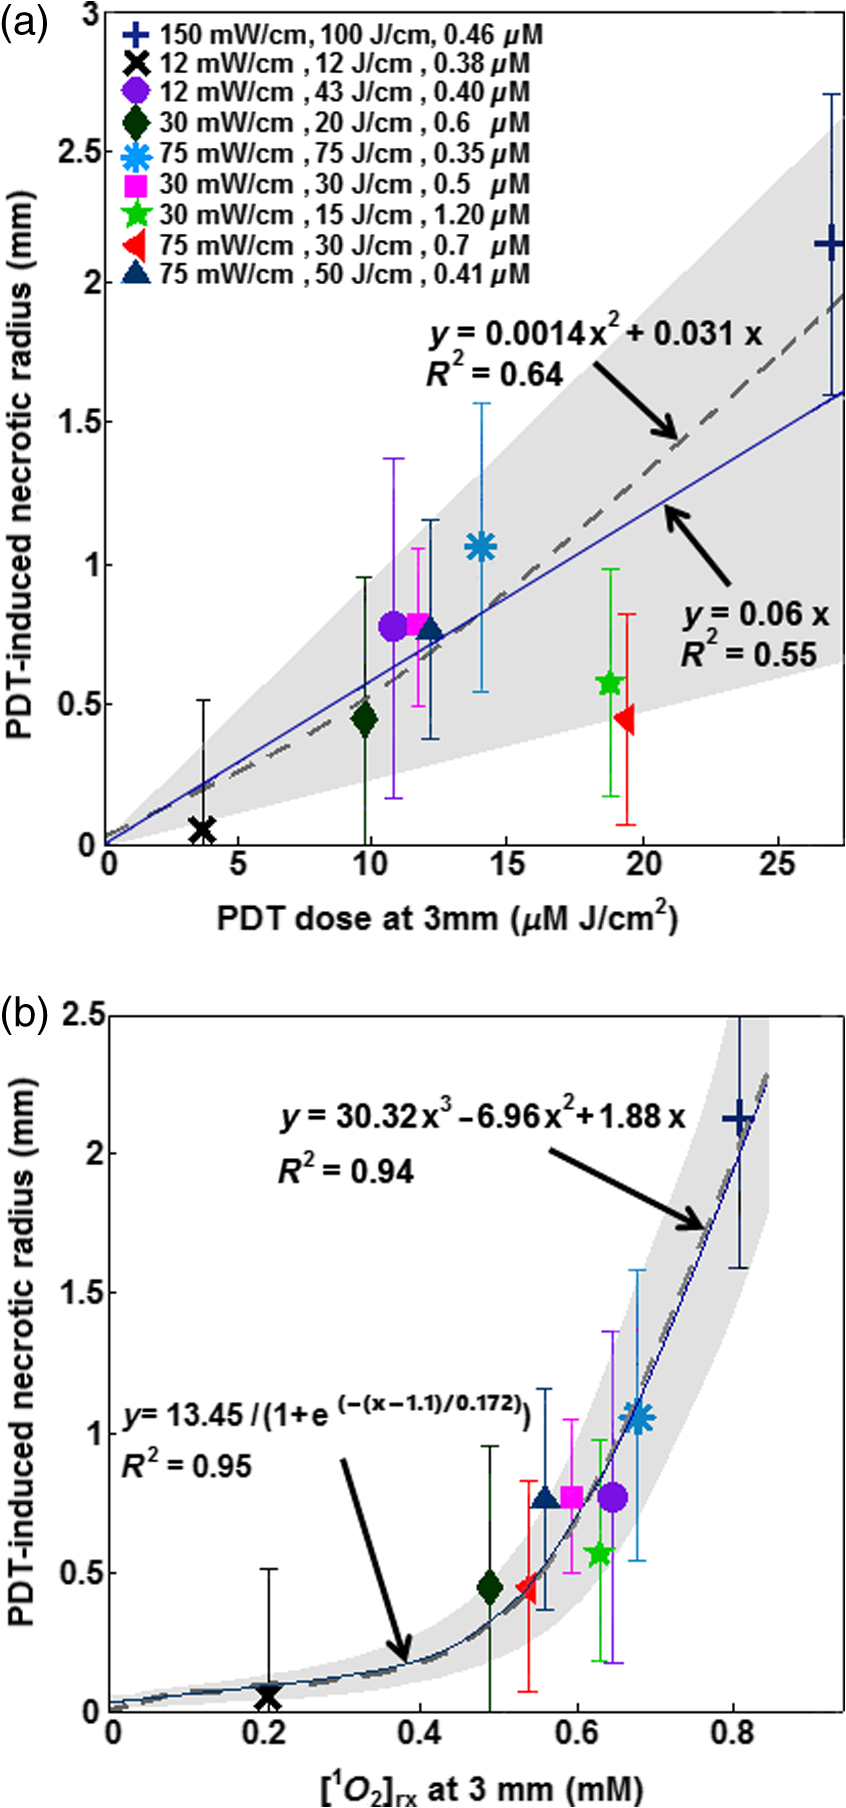 In order to provide a straightforward comparison of PDT dose to , the magnitude of the generated at 3-mm tumor depth was calculated for the different treatment conditions. Figure 6(b) shows a correlation between the necrotic radius induced by PDT and at 3 mm. The solid blue line shows the best fit using the functional form to the data with goodness of , and the dashed line shows an independent polynomial fit, with goodness of . 4.DiscussionsPDT offers great promise as a targeted cancer treatment. Studies on this technique have observed dramatic tumor destruction with little damage to the surrounding normal tissue.1,3–5 However, many attempts to use PDT in the clinic have been hindered due to the complex dosimetry problem or have led to inadequate tumor response.6,7,24 The common approach in clinical PDT dosimetry is PDT dose, which is based on the amount of photosensitizer administered to the patient and the amount of light delivered to the treatment site. However, PDT dose has several problems: (1) The local concentration of photosensitizer varies from site to site in the tissue and from individual to individual.6,7,25 (2) The penetration of light into the target depends on the optical properties of that tissue. (3) Tissue and blood oxygenation is a central component for PDT and also affects the tissue optical properties.13,14,26–30 (4) If the tissue is hypoxic, or becomes hypoxic as a result of the PDT treatment, the yield of will be lower than expected.6,7,24,31 To complicate matters further, all these parameters can change during treatment and each of the parameters can also influence the others. Modeling of the generated is of particular interest for the PDT dosimetry because it is the major cytotoxic agent causing biological effects in type II PDT and can predict the treatment efficacy in the clinic.7,15,17 A series of preclinical explicit dosimetry experiments including a range of LS and different light exposures was performed on mice bearing RIF tumor to generate different amounts of and induce different radii of necrosis. Then the amounts of were determined using the macroscopic model incorporating the information of the distribution of , and photosensitizer in tumor, as well as the tissue optical properties ( and ). The distribution was determined by the light source characteristics and the tissue optical properties. The photosensitizer concentration was measured interstitially pre-PDT for each mouse. Ex vivo measurements of the HPPH concentration were used as a validation for the in vivo measurements. The computed was fitted to the in vivo HPPH-mediated necrotic radius in the RIF tumor model (nine groups, each includes three mice) so that and the photochemical PDT parameters, , , and , could be determined. A comparison of the HPPH photochemical parameters (, , and ) with those obtained for photosensitizers Photofrin [ and ],7,11,32 mTHPC (, ),7,11,32 and ALA-PpIX (, )7,11,32 shows a bigger for HPPH as compared with the other photosensitizers, which makes sense, since is proportional to the absorption coefficient of the sensitizer and HPPH has a higher absorption. The value was estimated to be smaller for HPPH as compared with the other photosensitizers. The obtained for HPPH is , which is lower than that reported for Photofrin (); these values are presented with their standard deviations.7,11,32 and PDT dose at 3 mm were used in Fig. 6, since the average radius of necrosis is roughly 3 mm. The dashed lines in Fig. 6 are the polynomial fit of the data. To make it easier to calculate the fit, functional forms of and (solid lines in Fig. 6), respectively, were chosen to approximate the polynomial fits. They agreed with the best fit from the polynomial curves reasonably well. The correlations and goodness of fits ( for versus for PDT dose) demonstrate that serves as a better dosimetric quantity than PDT dose for predicting the treatment outcome. This is because recognizes consumption during PDT and accounts for its variations, which are not considered in PDT dose; the general oxygen supply term accounts for the microscopic diffusion and convection mechanism [see Eq. (3)]. 5.ConclusionPDT efficacy depends on , which in turn can be determined by , photosensitizer concentration, and tissue optical properties.33,34 As the direct measurement of concentration is very difficult in vivo with large variability, theoretical analyses provide a useful complementary approach for calculating the generated by PDT. Although results obtained from mathematical modeling will always be vulnerable to assumptions regarding the complex physiology of tumors and generated , simulations that are well informed by experiments provide insights into phenomena that are not accessible via direct experimentation. As a result, an empirical four-parameter macroscopic model has been developed13,24,33 to calculate the apparent concentration.7,10 This model utilizes the complete set of PDT kinetic equations as well as the dosimetry calculation based on the in vivo measurements of the tissue optical properties, , and photosensitizer concentration. In this study, we used the macroscopic model to fit in vivo HPPH-mediated necrostic radius in the RIF tumor model so that photochemical PDT parameters can be obtained. Then the in vivo threshold dose of the singlet oxygen, , was determined by correlation of the calculated and the tumor necrosis induced by PDT. The PDT dose and were calculated at 3 mm because this is roughly the average necrotic radius. The correlations of the PDT dose and with PDT-induced necrotic radius showed that serves as a better dosimetric quantity than PDT dose for predicting the treatment outcome. We expect that the model parameters and obtained from this study can be used directly in clinical trials to potentially better predict the outcome of the HPPH-mediated PDT. This in vivo PDT dosimetry is imperative in understanding the mechanism of the toxic effect and how this toxicity translates to tissue necrosis observed with the treatment. In the current model, is set to be . The impact of values on the values of obtained from fitting needs to be further studied. Due to a lack of published independent validation, the value of should be taken as preliminary. AcknowledgmentsThe authors would like to thank Dr. Jarod C. Finlay for the useful discussions, Dr. Keith Cengel for providing the HPPH photosensitizer, and Dr. Theresa Busch for her advice concerning the mouse studies and protocols. This research was supported by the National Institutes of Health (NIH R01 CA 154562 and P01 CA87971). ReferencesA. Juarranz et al.,
“Photodynamic therapy of cancer. Basic principles and applications,”
Clin. Transl. Oncol., 10
(3), 148
–154
(2008). http://dx.doi.org/10.1007/s12094-008-0172-2 Google Scholar
Z. Huang et al.,
“Photodynamic therapy for treatment of solid tumors—potential and technical challenges,”
Technol. Cancer Res. Treat., 7
(4), 309
–320
(2008). http://dx.doi.org/10.1177/153303460800700405 Google Scholar
T. J. Dougherty et al.,
“Photodynamic therapy,”
JNCI, J. Natl. Cancer Inst., 90
(12), 889
–905
(1998). http://dx.doi.org/10.1093/jnci/90.12.889 JNCIEQ Google Scholar
R. Penjweini et al.,
“Modifying excitation light dose of novel photosensitizer PVP-Hypericin for photodynamic diagnosis and therapy,”
J. Photochem. Photobiol., B, 120 120
–129
(2013). http://dx.doi.org/10.1016/j.jphotobiol.2012.12.013 Google Scholar
R. Penjweini et al.,
“Optimizing the antitumor selectivity of PVP-Hypericin re A549 cancer cells and HLF normal cells through pulsed blue light,”
Photodiagn. Photodyn. Ther., 10
(4), 591
–599
(2013). http://dx.doi.org/10.1016/j.pdpdt.2013.06.005 Google Scholar
X. Zhou et al.,
“Pretreatment photosensitizer dosimetry reduces variation in tumor response,”
Int. J. Radiat. Oncol., Biol., Phys., 64
(4), 1211
–1120
(2006). http://dx.doi.org/10.1016/j.ijrobp.2005.11.019 IOBSDC 0145-1464 Google Scholar
K. K. Wang et al.,
“Explicit dosimetry for photodynamic therapy: macroscopic singlet oxygen modeling,”
J. Biophotonics, 3
(5–6), 304
–318
(2010). http://dx.doi.org/10.1002/jbio.200900101 Google Scholar
M. T. Jarvi et al.,
“Singlet oxygen luminescence dosimetry (SOLD) for photodynamic therapy: current status, challenges and future prospects,”
Photochem. Photobiol., 82
(5), 1198
–1210
(2006). http://dx.doi.org/10.1562/2006-05-03-IR-891 PHCBAP 0031-8655 Google Scholar
M. J. Niedre et al.,
“Singlet oxygen luminescence as an in vivo photodynamic therapy dose metric: validation in normal mouse skin with topical amino-levulinic acid,”
Br. J. Cancer, 92
(2), 298
–304
(2005). http://dx.doi.org/10.1038/sj.bjc.6602331 BJCAAI 0007-0920 Google Scholar
T. C. Zhu et al.,
“Macroscopic modeling of the singlet oxygen production during PDT,”
Proc. SPIE, 6427 1
–12
(2007). http://dx.doi.org/10.1117/12.701387 Google Scholar
B. Liu et al.,
“Comparison of PDT parameters for RIF and H460 tumor models during HPPH-mediated PDT,”
Proc. SPIE, 8931 89311C
(2014). http://dx.doi.org/10.1117/12.2040241 Google Scholar
T. H. Foster et al.,
“Intratumor administration of the photosensitizer pc 4 affords photodynamic therapy efficacy and selectivity at short drug-light intervals,”
Transl. Oncol., 3
(2), 135
–141
(2010). http://dx.doi.org/10.1593/tlo.09295 Google Scholar
T. H. Foster et al.,
“Oxygen consumption and diffusion effects in photodynamic therapy,”
Radiat. Res., 126
(3), 296
–303
(1991). http://dx.doi.org/10.2307/3577919 RAREAE 0033-7587 Google Scholar
X. H. Hu et al.,
“Modeling of a type II Photofrin-mediated photodynamic therapy process in a heterogeneous tissue phantom,”
Photochem. Photobiol., 81
(6), 1460
–1468
(2005). http://dx.doi.org/10.1562/2005-05-04-RA-513 PHCBAP 0031-8655 Google Scholar
T. C. Zhu, B. Liu and R. Penjweini,
“Study of tissue oxygen supply rate in a macroscopic photodynamic therapy singlet oxygen model,”
J. Biomed. Opt., 20
(3), 038001
(2015). http://dx.doi.org/10.1117/1.JBO.20.3.038001 JBOPFO 1083-3668 Google Scholar
A. Dimofte, J. C. Finlay and T. C. Zhu,
“A method for determination of the absorption and scattering properties interstitially in turbid media,”
Phys. Med. Biol., 50
(10), 2291
–2311
(2005). http://dx.doi.org/10.1088/0031-9155/50/10/008 PHMBA7 0031-9155 Google Scholar
J. C. Finlay et al.,
“Interstitial fluorescence spectroscopy in the human prostate during motexafin lutetium-mediated photodynamic therapy,”
Photochem. Photobiol., 82
(5), 1270
–1278
(2006). http://dx.doi.org/10.1562/2005-10-04-RA-711 PHCBAP 0031-8655 Google Scholar
J. P. Whiteley, D. J. Gavaghan and C. E. Hahn,
“Mathematical modelling of oxygen transport to tissue,”
J. Math. Biol., 44
(6), 503
–522
(2002). http://dx.doi.org/10.1007/s002850200135 Google Scholar
A. Carreau et al.,
“Why is the partial oxygen pressure of human tissues a crucial parameter? Small molecules and hypoxia,”
J. Cell. Mol. Med., 15
(6), 1239
–1253
(2011). http://dx.doi.org/10.1111/j.1582-4934.2011.01258.x Google Scholar
T. C. Zhu et al.,
“In-vivo singlet oxygen threshold doses for PDT,”
Photonics Lasers Med., 4
(1), 59
–71
(2015). http://dx.doi.org/10.1515/plm-2014-0037 Google Scholar
I. Georgakoudi, M. G. Nichols and T. H. Foster,
“The mechanism of Photofrin photobleaching and its consequences for photodynamic dosimetry,”
Photochem. Photobiol., 65
(1), 135
–144
(1997). http://dx.doi.org/10.1111/j.1751-1097.1997.tb01889.x PHCBAP 0031-8655 Google Scholar
S. Mitra and T. H. Foster,
“Photophysical parameters, photosensitizer retention and tissue optical properties completely account for the higher photodynamic efficacy of meso-tetra-hydroxyphenyl-chlorin vs Photofrin,”
Photochem. Photobiol., 81
(4), 849
–859
(2005). http://dx.doi.org/10.1562/2005-02-22-RA-447R.1 PHCBAP 0031-8655 Google Scholar
J. S. Dysart, G. Singh and M. S. Patterson,
“Calculation of singlet oxygen dose from photosensitizer fluorescence and photobleaching during mTHPC photodynamic therapy of MLL cells,”
Photochem. Photobiol., 81
(1), 196
–205
(2005). http://dx.doi.org/10.1562/2004-07-23-RA-244.1 PHCBAP 0031-8655 Google Scholar
K. K. Wang, S. Mitra and T. H. Foster,
“Photodynamic dose does not correlate with long-term tumor response to mTHPC-PDT performed at several drug-light intervals,”
Med. Phys., 35
(8), 3518
–3526
(2008). http://dx.doi.org/10.1118/1.2952360 MPHYA6 0094-2405 Google Scholar
C. C. Lee et al.,
“Spatial heterogeneity and temporal kinetics of photosensitizer (AlPcS2) concentration in murine tumors RIF-1 and MTG-B,”
Photochem. Photobiol. Sci., 2
(2), 145
–150
(2003). http://dx.doi.org/10.1039/b207598a Google Scholar
J. Sandell et al.,
“A treatment planning system for pleural PDT,”
Proc. SPIE, 7551 75510C
(2010). http://dx.doi.org/10.1117/12.843044 Google Scholar
T. C. Zhu et al.,
“Light dosimetry at tissue surface for small circular fields,”
Proc. SPIE, 4952 56
–67
(2003). http://dx.doi.org/10.1117/12.474144 Google Scholar
J. L. Sandell and T. C. Zhu,
“A review of in-vivo optical properties of human tissues and its impact on PDT,”
J. Biophotonics, 4
(11–12), 773
–787
(2011). http://dx.doi.org/10.1002/jbio.201100062 Google Scholar
U. Sunar et al.,
“Monitoring photobleaching and hemodynamic responses to HPPH-mediated photodynamic therapy of head and neck cancer: a case report,”
Opt. Express, 18
(14), 14969
–14978
(2010). http://dx.doi.org/10.1364/OE.18.014969 OPEXFF 1094-4087 Google Scholar
Q. Chen, H. Chen and F. W. Hetzel,
“Tumor oxygenation changes post-photodynamic therapy,”
Photochem. Photobiol., 63
(1), 128
–131
(1996). http://dx.doi.org/10.1111/j.1751-1097.1996.tb03003.x PHCBAP 0031-8655 Google Scholar
M. T. Jarvi, M. S. Patterson and B. C. Wilson,
“Insights into photodynamic therapy dosimetry: simultaneous singlet oxygen luminescence and photosensitizer photobleaching measurements,”
Biophys. J., 102
(3), 661
–671
(2012). http://dx.doi.org/10.1016/j.bpj.2011.12.043 BIOJAU 0006-3495 Google Scholar
B. Liu, M. M. Kim and T. C. Zhu,
“A theoretical comparison of macroscopic and microscopic modeling of singlet oxygen during Photofrin and HPPH mediated PDT,”
Proc. SPIE, 8568 856805
(2013). http://dx.doi.org/10.1117/12.2002489 Google Scholar
K. K. Wang, S. Mitra and T. H. Foster,
“A comprehensive mathematical model of microscopic dose deposition in photodynamic therapy,”
Med. Phys., 34
(1), 282
–293
(2007). http://dx.doi.org/10.1118/1.2401041 MPHYA6 0094-2405 Google Scholar
J. C. Finlay et al.,
“Photobleaching kinetics of Photofrin in vivo and in multicell tumour spheroids indicate two simulations bleaching mechanism,”
Phys. Med. Biol., 49
(21), 4837
–4860
(2004). http://dx.doi.org/10.1088/0031-9155/49/21/001 PHMBA7 0031-9155 Google Scholar
BiographyRozhin Penjweini received her PhD degree in 2012 in physics from the University of Vienna. She is currently a postdoctoral researcher in the Department of Radiation Oncology at the University of Pennsylvania. Her current research interest is in vivo explicit photodynamic therapy (PDT) and singlet oxygen dosimetry. She also has practical experience in various fluorescence microscopy techniques for studying the structure, transport, and stability of nanomedicines for PDT treatment of cancer. Baochang Liu received his PhD degree in medical physics in 2012 from McMaster University, where he specialized in PDT dosimetry. He continued his research as a postdoctoral fellow in the Department of Radiation Oncology at the University of Pennsylvania. His research interests include modeling PDT dosimetry and oxygen transport in tissue, in vivo explicit dosimetry for interstitial PDT, developing direct 1O2 dosimetry system, and tissue optics. Michele M. Kim has received her BA and MS degrees in physics from the University of Pennsylvania in 2012 and is currently a PhD candidate at the University of Pennsylvania in physics while pursuing a certificate in medical physics. Her research topics include preclinical and clinical photodynamic therapy dosimetry. Timothy C. Zhu received his PhD degree in 1991 in physics from Brown University. He is currently a professor in the Department of Radiation Oncology at the University of Pennsylvania. His current research interests include explicit PDT dosimetry, singlet oxygen explicit dosimetry (SOED), integrated system for interstitial and intracavitory PDT, diffuse optical tomography, in vivo dosimetry, and external beam radiation transport. |
|||||||||||||||||||||||||||||||||||||||||||||||||||||||||||||||||||||||||||||||||||||||||||||||||||||||||||||||||||||||||||||||||||||||||||||||||


