|
|
1.IntroductionCaries is one of the most common oral diseases that affects teeth function and vitality. This disease is caused by demineralization of teeth surfaces due to plaque and biofilm formation. Demineralization is usually initiated by oral acids, such as acetic and lactic acid, which are produced by oral bacteria from dietary sugars and carbohydrates.1 Such locally formed acids dissolve minerals from enamel, weakening enamel strength and hardness, and thus, causing partial fractures and cavity formation. Furthermore, tooth discoloration can occur due to the infiltration of porous teeth by food colorants. Initially, carious lesions can be repaired through remineralization by minerals in saliva. However, when the balance between mineral loss and mineral uptake is not maintained, demineralization is prolonged. Moreover, the situation is exacerbated when saliva is reduced due to diabetes mellitus, insufficient nutrition, and improper tooth cleaning.2–4 Various methods, such as visual and tactile inspections to device-assisted inspection, have been used to detect carious lesions.5–7 Conventional methods, such as visual and tactile inspections and x-ray test, are ineffective at detecting early caries because they lack sensitivity. As for the device-assisted methods, digital image fiber optic transillumination (DIFOTI) uses a high-intensity white light to enhance shadows by light scattering between sound and carious lesions. This method is subjective due to its low sensitivity ().7 Electrical conductance measurement utilizes the difference of electrical resistance or impedance between sound and carious teeth. This method showed a good reproducibility with sensitivity and specificity. However, due to the low distribution in dental clinics, clinical trials are considerably low.7 Quantitative light-induced fluorescence is a visible light system that can detect early caries and monitor caries progression and regression. However, reliable reports for sensitivity and specificity are limited. The portable device DIAGNOdent is popularly used to detect the autofluorescence (AF) produced by chromophores on teeth and produces digital results from 0 to 99, which indicate the degree of caries progression. Accordingly, it provides a means for staging caries in a cost-effective, nondestructive device with vast numbers of clinical trials and data due to the high distribution in clinics. The red laser light (655 nm) of DIAGNOdent interacts with organic metabolites produced by oral bacteria. In vitro studies have shown that it enables the detection of carious lesions on occlusal and smooth surfaces, but in vivo studies have produced contradictory results.8–10 Also, an initial study showed a low relation between the number showed by the DIAGNOdent and depth of decay.11 A 405-nm laser has been found to be useful for diagnosing various cancers, including oral cancer by detecting porphyrin-induced fluorescence in malignant tissues.12–15 Like DIAGNOdent, the 405-nm laser causes carious lesions to produce AF because they also contain endogenous porphyrins, which are byproducts of oral bacterial activity.16,17 The present study was undertaken to determine whether a 405-nm laser could be used to detect and stage caries. Results obtained were compared with DIAGNOdent readings to determine the feasibility of 405-nm laser use and factors useful for differentiating caries stages were identified. 2.Materials and Methods2.1.Tooth PreparationThe present study was conducted using 413 teeth (molars and premolars) that were cleaned, frozen, and stored at a relative humidity of 100% after extraction. The Institutional Review Board at Pusan National University Dental Hospital, Yangsan, Republic of Korea, had approved the study and waived the informed consent. The stored teeth were inspected by two trained examiners independently through visual inspection (by eye and under the light microscope) and tactile inspection using an explorer. The examined teeth were allocated to one of four caries status groups (sound, stage II, stage III, stage IV) (Table 1). Teeth in the same group were all identically classified by two examiners. From each group, 20 teeth were randomly selected for tests. Table 1Description of caries stages defined in this study.
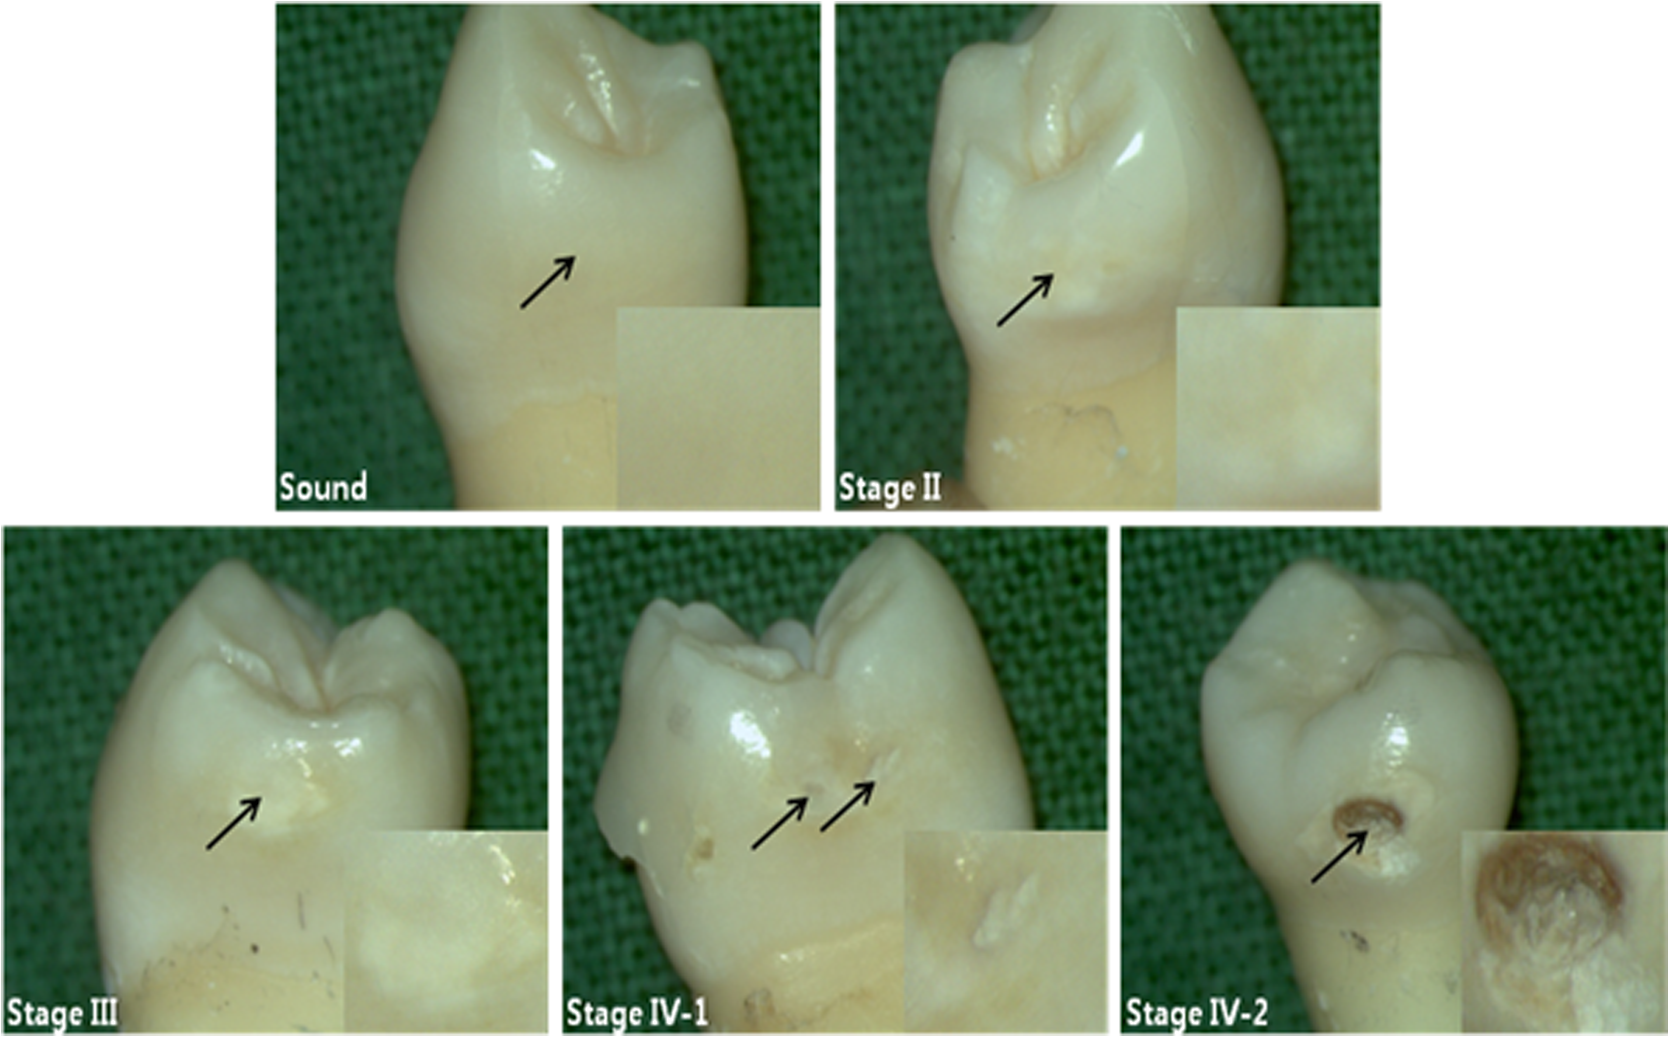
2.2.Autofluorescence AnalysisLaser-induced AF spectra of teeth were obtained using the 405-nm laser (LVI Technology, Seoul, Republic of Korea), which was operated at an output power of as measured using a power meter (PM3/FieldMax, Coherent, Portland, Oregon). Each tooth was placed on the XYZ stage. The laser was focused on the center of each lesion using a convex lens () and irradiated for 1 s. Emission spectra were recorded using a spectrometer (QE65000FL, Ocean Optics Inc., Dunedin, Florida) by guiding emitted light through an optical fiber (QP600-1-UV-VIS; diameter silica core). The detecting range of CCD detector in the spectrometer is 200 to 1000 nm and the optical resolution of the spectrometer is to 7.7 nm (FWHM, depending on split). The end of an optical fiber was positioned 1 cm away from the lesion surface. A 450-nm longpass filter (Thorlabs Inc., Newton, New Jersey) was placed in front of the optical fiber to attenuate the excitation light. From the obtained AF spectra, the spectrum slope was assessed. To determine the spectrum slope, AF spectra were analyzed at 550 to 600 nm; this range was determined by checking linearity (correlation coefficient, ) using a linear fit model. In this range, most specimens () had an value of . The area under the curve from 500 to 590 nm was determined by integrating the curve using ORIGIN (Microcal Software Inc., Southampton, Massachusetts). Since some specimens showed an increasing emission profile after 590 nm, the range for evaluation was fixed from 500 to 590 nm. To quantify spectral changes after 600 nm, the ratio () of peak emissions at 625 and 667 nm was calculated. These wavelengths were determined because some specimens in stages II to IV showed one or two raising peaks near 625 and 667 nm as caries progressed. 2.3.Examination Using a DIAGNOdentCaries was assessed using a DIAGNOdent pen (KaVo Dental, Biberach, Germany), according to the manufacturer’s instruction. Before measurement, the device was calibrated against a ceramic standard. Measurements were performed on the same areas that were used to produce AF spectra. As described by the manufacturer, peak values were classified as follows: 0 to 13, healthy; 14 to 20, beginning of demineralization; 21 to 29, strong demineralization; and , dentin caries. Values of indicate consideration of an x-ray test and of possible minimally invasive treatment or resin filling. 3.ResultsFigure 1 shows lesions of different stages on the tested specimens. Sound teeth were caries free with smooth and glossy surfaces. Stage II teeth showed white nonglossy spots. Stage III teeth had much more visible yellowish/white spots but no evidence of cavitation, and Stage IV specimens showed cavitation with white chalky centers and less brown margins (IV-1). However, some teeth exhibited obvious cavitation with a dark brown center and white margin (IV-2). Emission AF spectra of specimens at different stages are shown in Fig. 2. Specimens in Fig. 2(a) exhibited decreasing profiles from 500 to 600 nm with high slope and then to 800 nm with low slope. As caries progressed, the peak at 500 nm decreased gradually. On the other hand, specimens in Fig. 2(b) showed the same trend from 500 to 600 nm but had one or two peaks after 600 nm. As caries progressed, a peak near 667 nm appeared first, and this was followed by a second peak near 625 nm. In any cases, as specimens approach stage IV, the spectral distribution at 500 to 600 nm was close to the baseline. Fig. 2(a) Autofluorescence spectrum of specimens with different stages. Sound teeth have emission peaks near 485 nm. As caries progressed, specimens showed different degrees of decline after 500 nm. However, after 600 nm and regardless of caries progression, the decline was not as high as that of between 500 and 600 nm. (b) Except the sound case and similar decline between 500 and 600 nm, some specimens showed one or two emission peaks after 600 nm as caries progressed.  Figure 3 and Table 2 show a plot of scattered data and estimated values of spectrum slope, area under curve, two-peak ratio, and DIAGNOdent reading. Figure 3(a) shows the estimated spectrum slope at 550 to 600 nm as determined by linear fitting. As caries progressed, the average slope is significantly less declined from to . Each caries stages had significantly different spectrum slopes (). Figure 3(b) shows estimated areas under spectral curves at 500 to 590 nm. The area decreased significantly () from to , as caries progressed. Figure 3(c) shows estimated two-peak ratio () values. These ratios changed significantly from to , as caries progressed (). However, the ratios of stages III and IV were not significantly different. Figure 3(d) shows the DIAGNOdent readings of the four caries stages. Peak values significantly changed () from to with caries progression, but values in the sound and stage II groups and in the stage III and stage IV groups were not significantly different. Fig. 3Scatter plot of (a) spectrum slopes, (b) area under curve, (c) two-peak ratios, and (d) DIAGNOdent readings for specimens of different stages. Horizontal lines in each figure represent average values obtained from the relevant stages.  Table 2Obtained values from the autofluorescence spectrum analysis and DIAGNOdent reading.
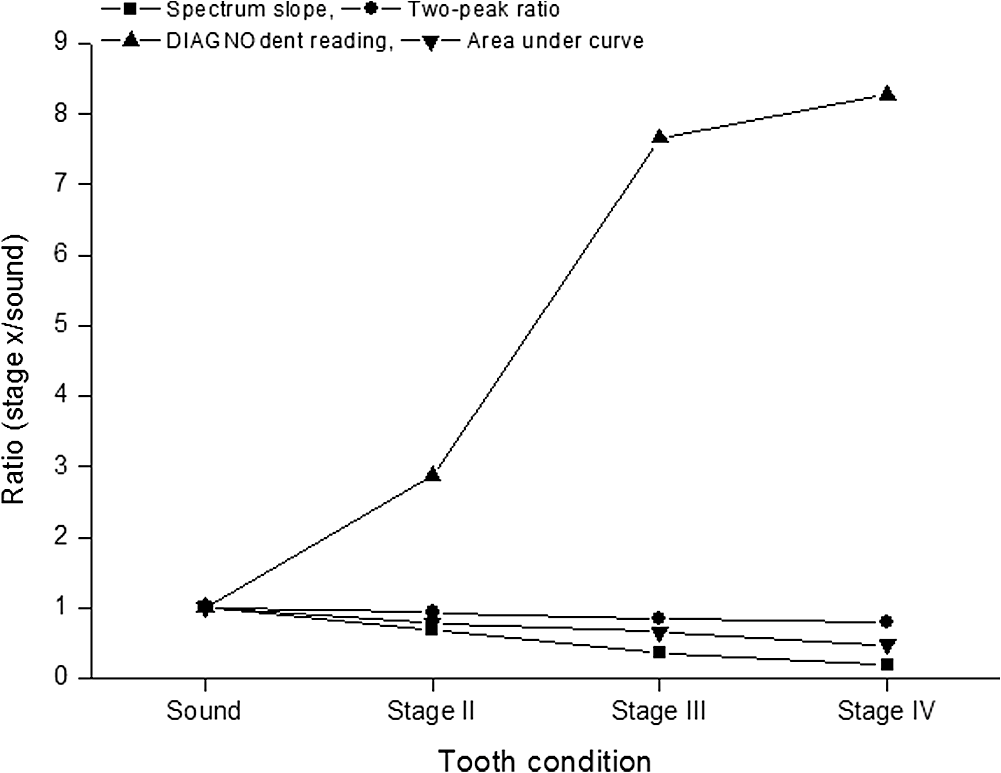
Note: Statistically significant difference on caries stage is shown by superscript letters. Same letters are not significantly different (p>0.05). Figure 4 shows the correlations between evaluated values. Figure 4(a) shows the correlation between areas under the curve and spectrum slopes, which were highly linearly () correlated with only two outliers. The correlation between spectrum slopes and two-peak ratios is shown in Fig. 4(b). The correlation coefficient () between the two was 0.75 but increased to 0.88 when outliers were excluded (cases in which the 667-nm peak was higher than the 625-nm peak). Figure 4(c) shows the correlation (, ) between spectrum slopes and DIAGNOdent readings. For spectrum slopes of 10 to 40, many DIAGNOdent readings reached the maximum value of 99. Fig. 4Correlation between (a) the values of spectrum slope and area under curve, (b) spectrum slope and two-peak ratio, and (c) spectrum slope and DIAGNOdent reading. 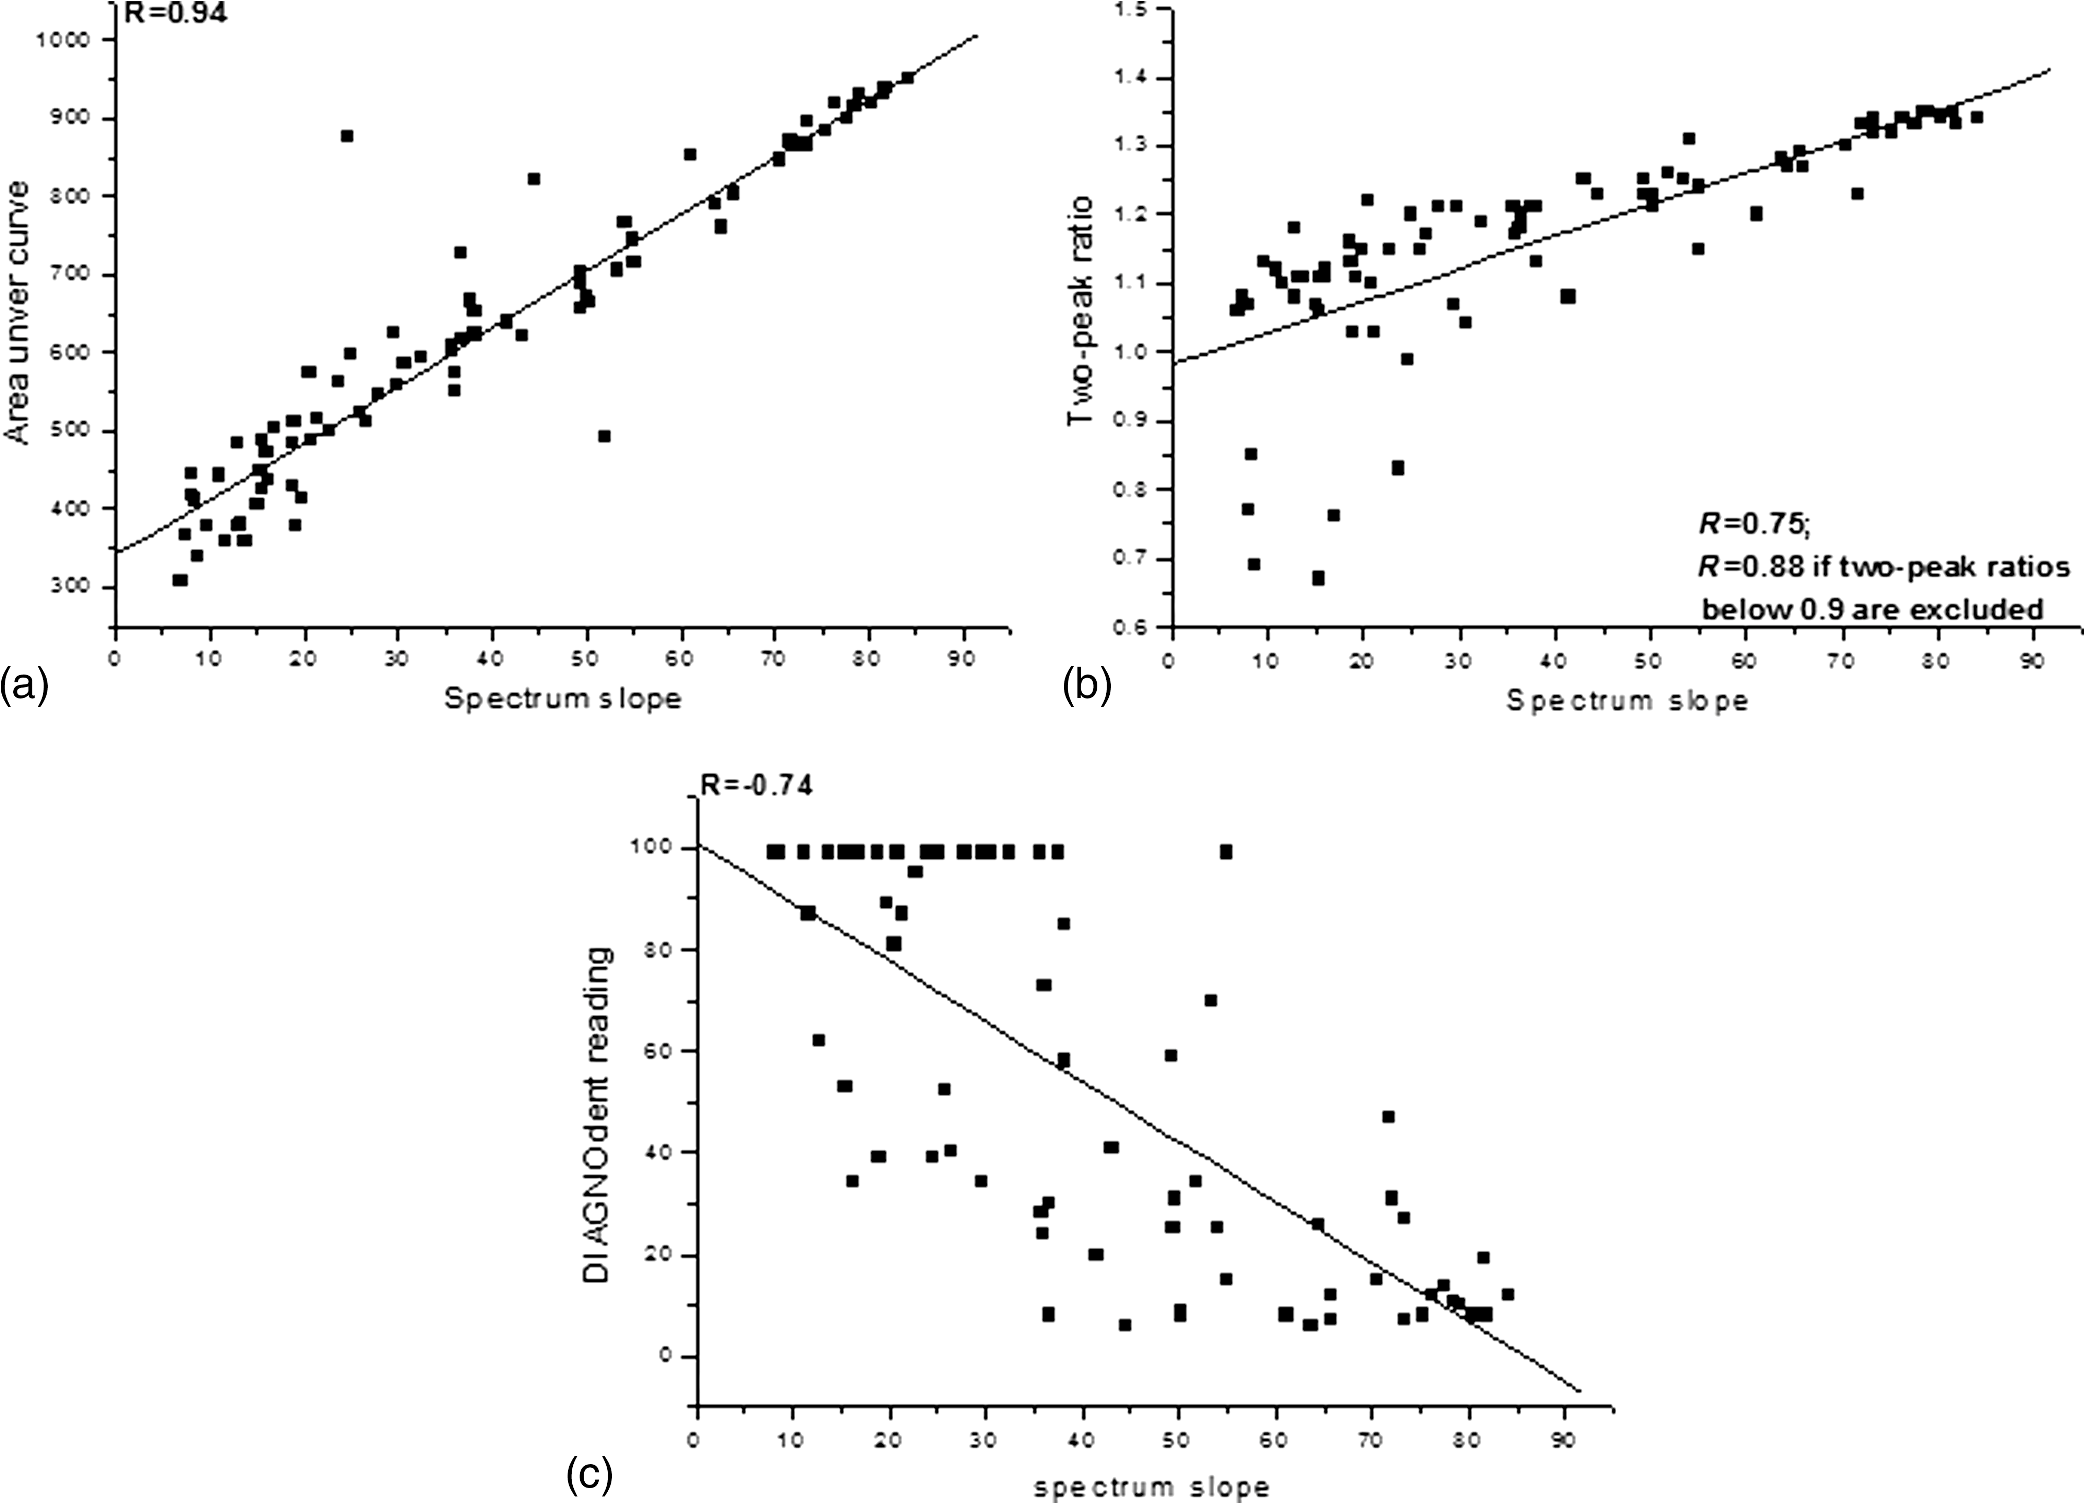 Figure 5 shows the correlation between caries stage and ratio values (ratio is defined as the division of values of stage x and sound for the relevant evaluation). Spectrum slopes, areas under curves, and two-peak ratios showed linearly changing patterns even after they included the first two stages (sound and stage II). In the case of DIAGNOdent readings, linearity was not maintained due to the overestimated readings of stage III. 4.DiscussionIn the present study, pre-examined teeth grouped by caries status were used. AF was produced using a 405-nm laser, and using the AF spectra obtained, caries-related spectral characteristics were extracted and their abilities to diagnose caries by stage were compared with DIAGNOdent readings. When considering treatment for dental caries, an accurate diagnosis of caries stage, whether based on visual inspection or by device-assisted study, is important for timely, appropriate treatment. ICDAS II (the standard visual inspection system) provides a standardized means of assessing teeth in different caries stages.18,19 However, despite the diverse criteria of ICDAS II (from 0 to 6), a dentist may react in two ways while a patient waits in the chair, that is, to undertake treatment immediately or to delay treatment. Except for sound or severe caries, which are easily identified, decisions to restore a tooth not warranting such treatment or no to restore a tooth with serious caries situation are made due to lack of experience or less than distinctive lesion characteristics due to the use of insensitive conventional methods. To reduce these pitfalls, a less interventional optically sensitive technique would be desirable. The tested specimens showed two different spectral profiles in their AF signals between 500 and 800 nm as caries progressed, that is, a decreasing spectrum slope at 500 to 600 nm and the appearance of new peak(s) after 600 nm.17,20–23 The strong emission near 500 nm followed by a smoothly decline with a long tail to 800 nm is mainly due to organic substances embedded in the inorganic enamel.24 As caries progresses, demineralization removes both inorganic and organic substances from the enamel surface and leaves an intact but porous structure; the gradual decrease in peak intensity around 500 nm is due to the loss of organic substances.25–27 Structural modifications that occur during the porous to cavitated surface transition can reduce the absorption of incident light and AF emission due to increased scattering.28 The decrease of peak intensity around 500 nm near the baseline can be attributable to these two effects. The accumulation of oral bacteria and their synthesis of endogenous porphyrins, such as protoporphyrin IX, can be increased in carious lesions and the appearance of one or two emission peaks observed after 600 nm due to caries progression was probably caused by these processes.29–31 The difference of surface morphologies in stage IV (1 and 2) is reflected in the spectral differences between Figs. 2(a) and 2(b). Cavitation with a white chalky center and less brown margin can be formed by plaque of low pH ().32–34 The situation will be further worsened if plaque on the tooth surface is not removed due to insufficient brushing and a high sugar supply. Since the process occurs within a short time, the time is not enough to synthesize porphyrins by oral bacteria [no visible peak(s) after 600 nm, Fig. 2(a)]. However, if the situation is not changed and as time further elapses, porous and weakened enamel surface will be fractured and removed and then deep cavitation will occur on the visible subsurface dentin. At this stage, one or two peaks after 600 nm by endogenous porphyrins in Fig. 2(b) are probable. To evaluate the spectrum slope, a range of 500 to 600 nm could be used, but better linearity is obtained between 550 and 600 nm because the spectra of stages II to IV are less linear at 500 to 550 nm. Of the 80 specimens, only three had an value of value (0.98, 0.97, and 0.85) in the range of 550 to 600 nm; thus, slope values may not have been significantly affected by narrowing the range from 550 to 600 nm to 575 to 600 nm. Estimated mean areas under the curves decreased significantly by caries severity. Since the spectra of different stages had consistently changed at 500 to 600 nm enough to maintain statistical difference, the area under that spectrum can be changed consistently and significantly as well [Fig. 4(a)]. However, this consistency cannot be maintained if the range is included, because in some cases, areas under curves increased rather than decreased with caries progression due to the appearance of one or two peaks. Among the specimens, 16 of the 80 teeth (1 stage II, 8 stage III, and 7 stage IV) showed one or two peaks at or near 625 and 667 nm. To exploit these, ratios between emission intensities at 625 and 667 nm were calculated. Sound and stage II caries were found to have significantly different ratios, because spectrum slopes at 625 to 670 nm consistently decreased and peak intensities at 625 nm were always higher than at 667 nm; average and standard deviations of these ratio values would be high and low, respectively, and as a result, significantly different for these two caries stages. However, stage III and IV ratios were not significantly different, because these two stages showed inconsistent spectra. Twenty-five of the 40 in these stages III and IV groups showed slowly decreasing profiles at 625 to 670 nm, and the other 15 had increasing profiles with one or two peaks. These results indicate that two-peak ratios are less sensitive for diagnosing caries stage. The correlation () between spectrum slope and two-peak ratio was 0.75 for all evaluated values and would have been 0.88 if peak ratios of were excluded [Fig. 4(b)]. DIAGNOdent is a laser-assisted fluorescence measurement device that is widely in use and studied.8–10 According to literature reviews of clinical studies, DIAGNOdent has mean sensitivities and specificities of and , respectively, in detecting caries of enamel and noncavitated occlusal lesions.7 This red light-emitting device mainly responds to organic and exogenous bacterial byproducts remaining in lesions, and thus, may be insensitive to inorganic changes in demineralized lesions. DIAGNOdent readings of sound () and stage II () teeth were insignificantly different as were readings of stage III () and IV () teeth. The average difference between stage II and III readings was . Among specimens belonging to stage III and IV, 20 of the 40 readings were . Furthermore, 18 of the 40 teeth recorded reading values of 99. Almost half of the specimens in stage III and IV had the maximum value that the device can read; thus, DIAGNOdent seems to score specimens of stage III, which have no visible cavitation into dentin, rather highly. In this case, over- or misjudgment from specimens of stage III cannot be excluded. Based on the spectral analysis obtained, the spectrum slope, area under curve (spectrum), and two-peak ratio appear to be useful factors in determining the caries stage of unknown teeth. Since values obtained from these factors were significantly different () for three different stages (sound, stage II, and stage III) and values changed linearly as caries progressed, these factors can have merit in diagnosing and determining caries stage, especially for stages II and III, which are important for the timely restoration, in conjunction with ICDAS II criteria. 5.ConclusionThe tested specimens showed consistently decreasing AF profiles in the 500 to 600 nm region as caries progressed. After 600 nm, some specimens continued to show decreasing profiles, but others showed increasing profiles with one or two peaks depending on the caries stage. Furthermore, spectrum slopes at 550 to 600 nm and areas under curves at 500 to 590 nm consistently and significantly decreased with caries progression. The two-peak ratios and DIAGNOdent readings were less sensitive at differentiating caries staging than the spectrum slopes and areas under curves. Given the limitations of the present study, analysis of the spectrum slope and area under the emission curve could be valuable for diagnosing caries stage and for determining optimum tooth treatment timing. AcknowledgmentsThe authors would like to thank Dr. Franklin Garcia-Godoy, College of Dentistry at the University of Tennessee Health Science Center, for his review and proofreading of the revised manuscript and answers to the reviewers comments. This work was financially supported by a Ministry of Science, ICT and Future Planning (MSIP) in the Korean government and a Korea Industrial Technology Association (KOITA) as “A study on the programs to support a collaborative research among industry, academia and research institutes (KOITA-2014-2).” ReferencesW. J. Loesche,
“Role of Streptococcus mutans in human dental decay,”
Microbiol. Rev., 50
(4), 353
–380
(1986). MBRED3 1070-6275 Google Scholar
P. A. Moore et al.,
“Type 1 diabetes mellitus, xerostomia, and salivary flow rates,”
Oral Surg. Oral Med. Oral Pathol. Oral Radiol. Endod., 92
(3), 281
–291
(2001). http://dx.doi.org/10.1067/moe.2001.117815 Google Scholar
S. Twetman et al.,
“Caries incidence in young type 1 diabetes mellitus patients in relation to metabolic control and caries-associated risk factors,”
Caries Res., 36
(1), 31
–35
(2002). http://dx.doi.org/10.1159/000057587 CAREBK 0008-6568 Google Scholar
W. J. Psoter, B. C. Reid and R. V. Katz,
“Malnutrition and dental caries: a review of the literature,”
Caries Res., 39
(6), 441
–447
(2005). http://dx.doi.org/10.1159/000088178 CAREBK 0008-6568 Google Scholar
T. Gimenez et al.,
“Visual inspection for caries detection: a systematic review and meta-analysis,”
J. Dent. Res., 94
(7), 895
–904
(2015). http://dx.doi.org/10.1177/0022034515586763 JDREAF 0022-0345 Google Scholar
J. Gomez et al.,
“Non-cavitated carious lesions detection methods: a systematic review,”
Community Dent. Oral Epidemiol., 41
(1), 55
–66
(2013). http://dx.doi.org/10.1111/cdoe.12021 CDOEAP 0301-5661 Google Scholar
S. Twetman et al.,
“Adjunct methods for caries detection: a systematic review of literature,”
Acta Odontol. Scand., 71
(3–4), 388
–397
(2013). http://dx.doi.org/10.3109/00016357.2012.690448 Google Scholar
X. Q. Shi, U. Welander and B. Angmar-Månsson,
“Occlusal caries detection with KaVo DIAGNOdent and radiography: an in vitro comparison,”
Caries Res., 34
(2), 151
–158
(2000). http://dx.doi.org/10.1159/000016583 CAREBK 0008-6568 Google Scholar
S. Tranaeus et al.,
“In vivo validity and reliability of IR fluorescence measurements for caries detection and quantification,”
Swed. Dent. J., 28
(4), 173
–182
(2004). SDJOD5 Google Scholar
A. Reis et al.,
“Performance of methods of occlusal caries detection in permanent teeth under clinical and laboratory conditions,”
J. Dent., 34
(2), 89
–96
(2006). http://dx.doi.org/10.1016/j.jdent.2005.04.002 Google Scholar
A. Lussi et al.,
“Performance and reproducibility of a laser fluorescence system for detection of occlusal caries in vitro,”
Caries Res., 33
(4), 261
–266
(1999). http://dx.doi.org/10.1159/000016527 CAREBK 0008-6568 Google Scholar
M. E. Khosroshahi and M. Rahmani,
“Detection and evaluation of normal and malignant cells using laser-induced fluorescence spectroscopy,”
J. Fluoresc., 22
(1), 281
–288
(2012). http://dx.doi.org/10.1007/s10895-011-0958-4 JOFLEN 1053-0509 Google Scholar
S. Lu et al.,
“Fluorescence detection of protoporphyrin IX in living cells: a comparative study on single- and two-photon excitation,”
J. Biomed. Opt., 13
(2), 024014
(2008). http://dx.doi.org/10.1117/1.2907316 JBOPFO 1083-3668 Google Scholar
N. Bedard et al.,
“Multimodal snapshot spectral imaging for oral cancer diagnostics: a pilot study,”
Biomed. Opt. Express, 4
(6), 938
–949
(2013). http://dx.doi.org/10.1364/BOE.4.000938 BOEICL 2156-7085 Google Scholar
A.C. Croce et al.,
“Naturally-occurring porphyrins in a spontaneous-tumour bearing mouse model,”
Photochem. Photobiol. Sci., 10
(7), 1189
–1195
(2011). http://dx.doi.org/10.1039/c0pp00375a PPSHCB 1474-905X Google Scholar
B. Joseph et al.,
“Detection and quantification of dental plaque based on laser-induced autofluorescence intensity ratio values,”
J. Biomed. Opt., 20
(4), 048001
(2015). http://dx.doi.org/10.1117/1.JBO.20.4.048001 JBOPFO 1083-3668 Google Scholar
L. Zhang et al.,
“Trimodal detection of early childhood caries using laser light scanning and fluorescence spectroscopy: clinical prototype,”
J. Biomed. Opt., 18
(11), 111412
(2013). http://dx.doi.org/10.1117/1.JBO.18.11.111412 JBOPFO 1083-3668 Google Scholar
J. E. Iranzo-Cortés, J. M. Montiel-Company and J. M. Almerich-Silla,
“Caries diagnosis: agreement between WHO and ICDAS II criteria in epidemiological surveys,”
Community Dent. Health., 30
(2), 108
–111
(2013). http://dx.doi.org/10.1922/CDH_3006Silla04 Google Scholar
C. H. Chu, A. M. Chau and E. C. Lo,
“Current and future research in diagnostic criteria and evaluation of caries detection methods,”
Oral Health. Prev. Dent., 11
(2), 181
–189
(2013). http://dx.doi.org/10.3290/j.ohpd.a29365 Google Scholar
Q. Chen et al.,
“Discrimination of dental caries using colorimetric characteristics of fluorescence spectrum,”
Caries Res., 49
(4), 401
–407
(2015). http://dx.doi.org/10.1159/000381961 CAREBK 0008-6568 Google Scholar
C. M. Volgenant et al.,
“Effect of metalloporphyrins on red autofluorescence from oral bacteria,”
Eur. J. Oral Sci., 121
(3 Pt 1), 156
–161
(2013). http://dx.doi.org/10.1111/eos.12045 Google Scholar
A. Ribeiro et al.,
“A preliminary investigation of a spectroscopic technique for the diagnosis of natural caries lesions,”
J. Dent., 33
(1), 73
–78
(2005). http://dx.doi.org/10.1016/j.jdent.2004.08.006 Google Scholar
D. M. Zezell et al.,
“Characterization of natural carious lesions by fluorescence spectroscopy at 405-nm excitation wavelength,”
J. Biomed. Opt., 12
(6), 064013
(2007). http://dx.doi.org/10.1117/1.2821192 JBOPFO 1083-3668 Google Scholar
F. Sundström et al.,
“Laser-induced fluorescence from sound and carious tooth substance: spectroscopic studies,”
Swed. Dent. J., 9
(2), 71
–80
(1985). SDJOD5 Google Scholar
D. Spitzer and J. J. ten Bosch,
“Luminescence quantum yields of sound and carious dental enamel,”
Calcif. Tissue Res., 24
(3), 249
–251
(1977). http://dx.doi.org/10.1007/BF02223324 CATRBZ 0008-0594 Google Scholar
E. G. Borisova, T. T. Uzunov and L. A. Avramov,
“Early differentiation between caries and tooth demineralization using laser-induced autofluorescence spectroscopy,”
Lasers Surg. Med., 34
(3), 249
–253
(2004). http://dx.doi.org/10.1002/lsm.20009 LSMEDI 0196-8092 Google Scholar
A. C. Ribeiro Figueiredo, C. Kurachi and V. S. Bagnato,
“Comparison of fluorescence detection of carious dentin for different excitation wavelengths,”
Caries Res., 39
(5), 393
–396
(2005). http://dx.doi.org/10.1159/000086846 CAREBK 0008-6568 Google Scholar
I. A. Pretty, W. M. Edgar and S. M. Higham,
“The validation of quantitative light-induced fluorescence to quantify acid erosion of human enamel,”
Arch. Oral Biol., 49
(4), 285
–294
(2004). http://dx.doi.org/10.1016/j.archoralbio.2003.11.008 AOBIAR 0003-9969 Google Scholar
R. Richards-Kortuma and E. Sevick-Muraca,
“Quantitative optical spectroscopy for tissue diagnosis,”
Annu. Rev. Phys. Chem., 47 555
–606
(1996). http://dx.doi.org/10.1146/annurev.physchem.47.1.555 ARPLAP 0066-426X Google Scholar
W. Buchalla, A. M. Lennon and T. Attin,
“Comparative fluorescence spectroscopy of root caries lesions,”
Eur. J. Oral Sci., 112
(6), 490
–496
(2004). http://dx.doi.org/10.1111/j.1600-0722.2004.00173.x Google Scholar
K. Koenig and H. Schneckenburger,
“Laser-induced autofluorescence for medical diagnosis,”
J. Fluoresc., 4
(1), 17
–40
(1994). http://dx.doi.org/10.1007/BF01876650 JOFLEN 1053-0509 Google Scholar
L. J. Walsh and A. M. Brostek,
“Minimum intervention dentistry principles and objectives,”
Aust. Dent. J., 58
(Suppl 1), 3
–16
(2013). http://dx.doi.org/10.1111/adj.12045 ADEJA2 0045-0421 Google Scholar
J. D. Featherstone,
“Dental caries: a dynamic disease process,”
Aust. Dent. J., 53
(3), 286
–291
(2008). http://dx.doi.org/10.1111/j.1834-7819.2008.00064.x ADEJA2 0045-0421 Google Scholar
Y. M. Dong et al.,
“Plaque pH and associated parameters in relation to caries,”
Caries Res., 33
(6), 428
–436
(1999). http://dx.doi.org/10.1159/000016547 CAREBK 0008-6568 Google Scholar
BiographySung-Ae Son is an assistant professor in the Department of Conservative Dentistry, School of Dentistry, Pusan National University, Yangsan, Republic of Korea. She has research experience in the field of dental cariology and dental restorative materials. Including private practice, she has been working for over 14 years in the clinical area. Kyeong-Hoon Jung is a professor in the School of Electrical Engineering, Kookmin University, Seoul, Republic of Korea. He has over 18 years of research experience in the field of broadcasting systems, video coding, and multimedia signal processing. He has published 20 research papers in international journals. |