
|
|
1.IntroductionColorectal cancer is the third-leading cause of cancer-related death worldwide.1 The early diagnosis of colorectal cancers and adenomatous polyps facilitates the application of early-stage therapies, and significantly increases the potential for survival.2,3 To detect and monitor the progression of various pathologies at an early stage, spectral measurement and analysis, which provide accurate quantifications of microvascular and morphological properties of the mucosa, are useful. However, point spectroscopy does not account for tissue spatial heterogeneity as it detects light from a single point, and hence, is ineffective for mapping lesion area. However, hyperspectral imaging (HSI) accounts for tissue spatial heterogeneity and can be effectively used for spatial mapping of tissue morphology and physiology.4–10 This technique involves the acquisition and analysis of a series of reflected two-dimensional images sampled at different wavelengths.11–16 In the gastrointestinal field, most HSI studies have involved ex vivo biopsies, resected tumor tissues, or surficial organs such as the skin, tongue, or larynx. Clancy et al.16 developed a laparoscope HSI system based on liquid-crystal tunable filter, Martin et al.14,15 developed an HSI system with fluorescence for imaging of the larynx, and Leitner et al.17 developed an HSI laryngoscope system based on acoustic-optical tunable filter, which can collect 51 images with a bandwidth of 5 nm in 1.25 s. Shimoyama et al.18 developed a micro Fabry–Perot interference filter placed at the tip of a flexible endoscope to create a wavelength-adjustable spectral endoscope, although this has not been used in the clinic thus far. Kiyotoki et al.19 proposed the use of a diagnostic support system for resected gastric cancer tissues with an HSI camera, and indicated that HSI could be used to measure the spectral reflectance (SR) in gastric tumors and could differentiate between tumorous and normal mucosa. However, the color of the resected tissues differed from that observed in vivo, which suggests that the spectral properties of tissue may change after they are resected. In the present study, we aimed to assess the difference in the in vivo SR of malignant colorectal tumors and normal mucosa, and sought to clinically apply the HSI technology in vivo to detect colorectal tumors or adenomatous polyps with high accuracy. 2.Methods2.1.Equipment SetupFigure 1 shows a diagram of the flexible hyperspectral (HS) colonoscopy system, which can be used to obtain a series of reflected HS images in a noncontact manner in the wavelength range of 405 to 665 nm. This system was created by modifying the commercialized endoscope AQ-100, which was donated by Shanghai Aohua Photoelectric Endoscope Co. Ltd. The system comprises four units20–24: an HS light source, endoscope imaging unit, image processing unit, and monitor unit (LMD-2451MD, Sony). The HS light source unit contains a xenon arc lamp (PE300AF, PerkinElmer Optoelectronics), which has an integrated parabolic reflector that collects light from the light bulb and produces a collimated output beam. Twenty-seven sequential narrowband interference filters (Shenyang HB Optical Technology Co., Ltd., China; HB405T10K is the model number of one of the filters) that are centered from 405 to 665 nm at 10-nm intervals—with a full-width at half maximum (FWHM) of 10 nm, peak transmission of , and two all-pass holes—are mounted on two motorized filter wheels positioned in the path of the collimated beam. Figure 2 shows the wheels, which is the major difference from the parts of the conventional flexible endoscopy system. In the conventional white light illumination mode, RGB color filters are used and the all-pass holes in the HS wheels are positioned in the illumination beam path. When the suspected disease area is targeted and the HSI mode is enabled, 27 monochromatic spectral-channel light beams are produced sequentially in 4.2 s as the filter wheel rotates. An optical fiber bundle directs the beams to the colorectal mucosa after the optical taper focuses the light onto the bundle. A combination of lenses is attached to the distal end of the bundle. This combination results in a 5.0-cm-diameter illumination spot at a working distance of 2.0 cm. A monochromatic charge-coupled device (CCD; ICX279AL, Sony) positioned at the distal end of the optical fiber bundle is used to spectrally resolve the reflected images from the mucosa. Analog signals read from the CCD are sequentially transformed into digital signals in the image-processing unit. A cable is used to connect the image-processing unit to the medical monitor, which is used to display the reflected images of the colorectal mucosa. 2.2.Clinical Data AcquisitionAfter ethics approval was provided by Zhongshan Hospital (Shanghai, China), we obtained HS images of different types of colorectal mucosa in the clinical setting. In particular, HS images of malignant colorectal tumors and adenomatous polyps were assessed. 2.3.Data PreprocessingAfter acquiring sequential HS images containing different spectral information, we performed image preprocessing to reduce imperfections that arose during imaging and to generate images suitable for analysis. Noise reduction, contrast enhancement, illumination normalization, reflex removal, and soft image registration for moving objects were performed.25–30 2.4.Band SelectionA band selection algorithm based on recursive divergence (RD)31 was employed to evaluate the HS images, and to determine the wavelength subset that contained the most useful information. With regard to the training samples of the obtained HS images, we manually categorized the samples into two classes: disease pixels and normal tissue pixels . Each pixel is a vector along the spectral axis. The RD is defined31 as the total average information for discriminating class from , and is estimated by where is the probability density function of in class . The divergence is the symmetric version of the Kullback–Leibler distance, and it is non-negative, monotonic, and additive for independent variables.represents the divergence with selected bands, and represents the divergence with the additional band . If the signal classes are characterized by -dimensional multivariate normal distributions , where and are the mean vector and covariance matrix of class , respectively. would represent the trace of a matrix. Moreover, , where is total number of samples. If the additional band has a mean value of , variance of , covariance vector of between and the elements of , for class ( or ), then the divergence with an additional band can be recursively calculated in an efficient manner, as follows: where is the incremental divergence due to the addition of and can be calculated by the following equation: where and .The detailed derivation of the incremental divergence has been described in Ref. 31. Equation (3) provides an efficient manner to calculate the divergence with the additional band. The procedure for efficient band selection based on the recursive equation of divergence can be described as follows (the corresponding block diagram is shown in Fig. 3):
2.5.Statistical EvaluationTo verify the effect of band selection in theory, a support vector machine (SVM)31–33 was used to classify the tumor region on the spectral images. Pixels of a manually selected colorectal tumor region, along with those within a normal region, were used as training samples, and all the pixels in another similar HS image cube were used as a test set. The SVM is used to determine the optimal separating hyperplane that maximizes the margin between the classes, and accordingly categorizes the image into two classes. The spectral vectors of each pixel used in the SVM have different dimensions, which are determined by band selection. In fact, the classifications based on all HS images have 28 dimensions. After classification, we calculate the classification accuracy, sensitivity, and specificity based on the true positive (TP), true negative (TN), false positive (FP), and false negative (FN) values, as compared to manually classified results, as shown in Eqs. (4)–(6) 2.6.Clinical EvaluationAfter selecting the band subset and performing statistic evaluation, we can evaluate the effect of the selected bands by implementing the selected wavelengths in the clinical setting for spectral imaging. After considering the light exposure and the imaging period, we observed that a band number of is not suitable for real-time imaging in vivo. Hence, we select the first five bands for the spectral imaging of colorectal tumors or adenomatous polyps. Different subsets of spectral bands will be selected and applied for other diseases or objects. 3.ResultsWe obtained 21 HS image cubes of malignant colorectal tumors or adenomatous polyps from 12 patients in the clinical trials. Figure 4 shows a color image of a malignant colorectal tumor and its surrounding normal tissue, along with a graph of the SR of the tumor and normal mucosa in the wavelength range of 405 to 655 nm. Both SRs are normalized using preprocessing methods and are different from the raw reflectance data. Figure 5 shows some images from an HS image cube of a colorectal tumor, which are centered at 405, 455, 545, 585, 595, and 655 nm, respectively. The spectral characteristics in the tumor and normal tissue regions were found to be significantly different according to the wavelengths. Except for the image centered at 405 nm, which represents low light intensity, the microvascular patterns were clearer on the images centered at 455, 545, and 585 nm than those centered at 595 and 655 nm. Fig. 4Color image of a malignant colorectal tumor and a graph showing the SR of the tumor and normal mucosa in the wavelength range of 405 to 655 nm.  Fig. 5Images from an HS image cube of malignant colorectal tumors. Images are centered at 405, 455, 545, 585, 595, and 655 nm, respectively. The spectral characteristics in the tumor and normal tissue regions are significantly different according to the wavelengths.  Figure 6 shows the SR for all pixels in the tumor region and normal mucosa. The SRs in the tumor regions tend to be high in wavelength bands and low in the region of 475 to 585 nm. One reason for this finding may be the presence of significant angiogenesis in the mucosa in the tumor region. Hemoglobin absorbs more light in the wavelength region and less light in the region . In particular, there were seven abnormal curves that had reflectance peaks among the normal tissue signatures. This finding may be associated with the occasional interferences when the system obtains the HS data, or with noise amplification during the preprocessing. As there were in the normal tissue region, we removed these seven curves from our study set and ignored their influences in the subsequent analyses. Fig.6SR for pixels in the tumor region and in the normal mucosa. The SRs in the tumor regions tend to be high in wavelength bands and low in the region of 475 to 585 nm.  We processed the 21 HS image cubes of colorectal tumors and adenomatous polyps using the RD band selection method. Table 1 shows the band selection results of 10 image cubes. We observed that 625, 525 to 545, 415 to 425, 465, and 495 to 505 nm were among the most frequently selected wavelengths in the studied wavelength region. Table 1Band selection results using the RD method.
Figure 7(a) shows the manually marked tumor region, and Fig. 7(b) shows the region which was classified based on the five selected bands. This image was obtained from one of the 21 HS cubes from the study cases. As expected, the classification with a greater number of bands had a higher accuracy and specificity (Table 2). In fact, the classification based on all HS images had the highest accuracy and specificity. Moreover, the classification with all the HS bands showed high sensitivity, whereas no marked difference in sensitivity was observed in classification with 1 band to 5 bands. Although the results exhibit a large variance among the 21 HS cubes (Table 2), which may be due to the small number of studied cases, they indicate that spectral imaging could help tumor region detection and classification, as spectral imaging can extract accurate spectral information, which is usually diluted in conventional color imaging. Fig. 7(a) The manually marked tumor region and (b) the tumor region classified based on the five selected bands. In (b), some single points classified by SVM are removed and the outline is smoothed, as we are only concerned about region detection. 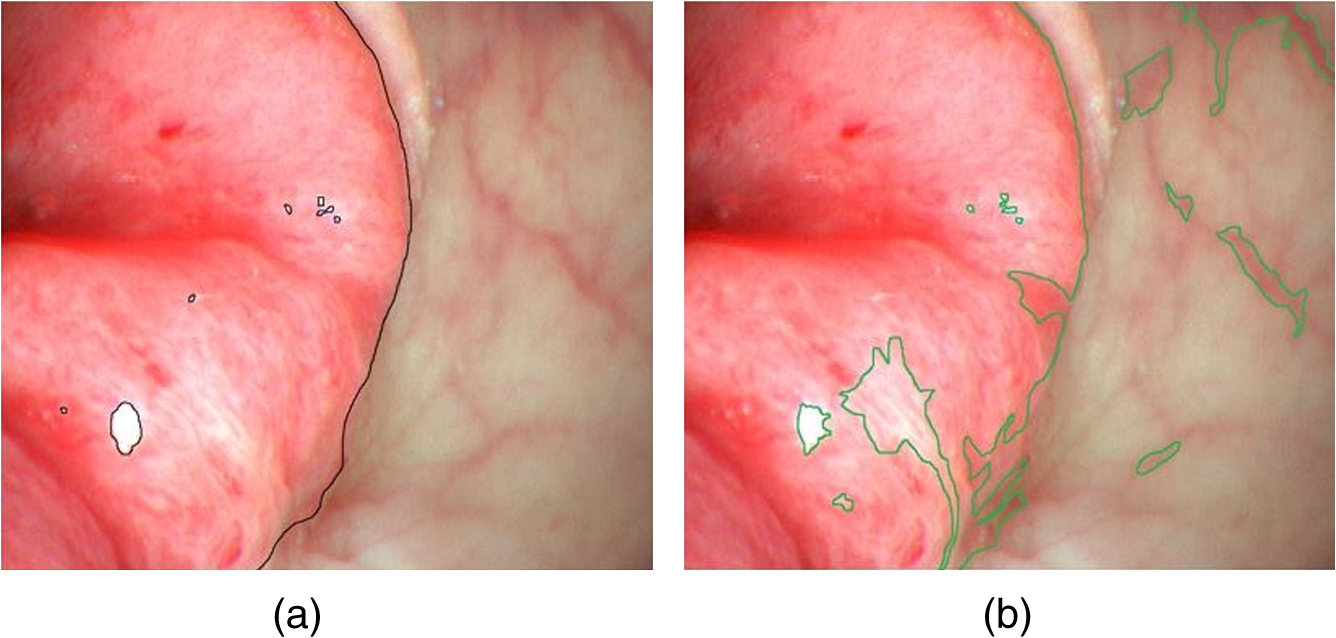 Table 2Accuracy, sensitivity, and specificity of the classification results based on different bands (SVM), compared to those based on the method of manual classification.
We merged the adjacently selected bands (such as 525 to 545 nm) into a single band with a broader FWHM (30 nm), and used these five selected bands for spectral imaging of colorectal tumor and adenomatous polyps in clinical trials. Pseudocolors were assigned to pixels corresponding to the five spectral components. Figure 8 shows the contrast of colorectal adenomatous polyp images under white illumination and spectral imaging. We observed that spectral imaging using the selected wavelengths is useful for outlining the disease region. As indicated by the arrow, potential angiogenesis occurs in an extended region surrounding the polyp region. Under white light illumination, the margin of the extended region cannot be clearly observed; however, with spectral imaging, the region can be easily outlined. Fig. 8(a) A colorectal adenomatous polyp under white light illumination; (b) the color-enhanced adenomatous polyps under spectral illumination of the five selected bands (625, 525 to 545, 415 to 425, 465, and 495 to 505 nm). As indicated by the arrow, the margin of the polyp region is outlined clearly. The boxes show that the microvascular pattern of the polyp mucosa is enhanced under spectral illumination with the five selected bands.  Moreover, spectral imaging is useful for enhancing the microvascular pattern of the polyp mucosa in vivo. As indicated by the boxes in Fig. 8, the pit pattern can be observed more clearly on the spectral image than on the white light image. This could help doctors determine the type of polyps or stage of the tumor. 4.DiscussionFor an endoscopy system with CCDs operating at low speeds, the use of five bands may be excessive for meeting the real-time requirements. Hence, four, three, and even two bands can be employed to aid diagnosis, as all the bands are selected according to the HS images of the colorectal tumor and adenomatous polyps. Narrowband imaging (NBI) technology, which is widely used in the clinical setting, uses two wavelengths: 415 and 540 nm.34 In the early stage, some NBI systems also apply a third wavelength—600 nm.35 The first three wavelengths we selected for spectral imaging are similar to those used in NBI. However, the wavelengths selected in our technique are more accurate and specific for colorectal tumors and adenomatous polyps. Moreover, in the future, we can employ different wavelength subsets based on different types of tumors or environments, in comparison to the two defined wavelengths used in NBI. Spectral imaging can easily be adopted in endoscopy systems. For endoscopy systems with color CCDs, only a filter wheel needs to be added. However, for systems with monochromatic CCDs, a fast wavelength switching device, such as an acoustic-optical tunable filter, is also required. Despite the favorable results observed in the present study, we need to further verify the selected bands in clinical trials in the future. Moreover, as the reflected spectral images may differ based on various factors, such as the disease stage, and individual and environmental changes, we do not expect that these band selection results would apply to all individuals. In the present study, we have simply proved that this spectral imaging technique involving band selection from the HSI of colorectal tumors can be useful when employed in a clinic in vivo, and can aid in the outlining of a disease region and enhancing of the pit pattern of the mucosa. In the future, after summarizing a larger number of cases, we can determine an optimal spectral band subset that can be effective for most patients with colorectal tumor or adenomatous polyps. Furthermore, optimal spectral band subsets can be selected that are individual-specific and tumor stage-specific. 5.ConclusionThis study demonstrated that HSI can be used in vivo to measure the SR in malignant colorectal tumors and adenomatous polyps, and to differentiate between tumors and normal mucosa. A flexible endoscope system was modified with HS technology and was used to obtain in vivo HS images. A band selection algorithm, based on the RD method, was used to analyze HS images of residual colorectal regions, and five bands (625, 525 to 545, 415 to 425, 465, and 495 to 505 nm) were identified that corresponded to colorectal tumors. We then applied these bands to spectral imaging in clinical trials for colorectal tumors or adenomatous polyps. We observed that the application of these five bands to spectral imaging is useful for outlining the disease region and enhancing the microvascular network on the mucosa surface. Although further study is required, this diagnostic support system has great potential for further application in the clinical setting. AcknowledgmentsThe authors are grateful to Mingda Chen (an engineer) from Peking University, and Qiang Shi, Yunshi Zhong, and Liqing Yao (endoscopic doctors) at Zhongshan Hospital, Shanghai, China. This study was partially supported by the China Scholarship Council. ReferencesR. Siegel, D. Naishadham and A. Jemal,
“Cancer statistics, 2012,”
CCA Cancer J. Clin., 62
(1), 10
–29
(2012). http://dx.doi.org/10.3322/caac.20138 Google Scholar
K. Kinkel et al.,
“Detection of hepatic metastases from cancers of the gastrointestinal tract by using noninvasive imaging methods (US, CT, MR imaging, PET): a meta-analysis,”
Radiology, 224
(3), 748
–756
(2002). http://dx.doi.org/10.1148/radiol.2243011362 RADLAX 0033-8419 Google Scholar
T. Lehnert et al.,
“Sequential hepatic and pulmonary resections for metastatic colorectal cancer,”
Br. J. Surg., 86
(2), 241
–243
(1999). http://dx.doi.org/10.1046/j.1365-2168.1999.01010.x BJSUAM 0007-1323 Google Scholar
W. L. Wolfe, Introduction to Imaging Spectrometers, SPIE Press, Bellingham, Washington
(1997). Google Scholar
G. L. Lu and B. W. Fei,
“Medical hyperspectral imaging: a review,”
J. Biomed. Opt., 19
(1), 010901
(2014). http://dx.doi.org/10.1117/1.JBO.19.1.010901 JBOPFO 1083-3668 Google Scholar
L. V. Wang, Photoacoustic Imaging and Spectroscopy, CRC Press(2009). Google Scholar
D. A. Boas, C. Pitris and N. Ramanujam, Handbook of Biomedical Optics, CRC Press, Boca Raton, FL
(2012). Google Scholar
V. V. Tuchin and V. Tuchin, Tissue Optics: Light Scattering Methods and Instruments for Medical Diagnosis, SPIE Press, Bellingham, Washington
(2007). Google Scholar
M. C. Pierce et al.,
“Accuracy of in vivo multimodal optical imaging for detection of oral neoplasia,”
Cancer Prev. Res., 5
(6), 801
–809
(2012). http://dx.doi.org/10.1158/1940-6207.CAPR-11-0555 Google Scholar
H. Akbari et al.,
“Hyperspectral imaging and quantitative analysis for prostate cancer detection,”
J. Biomed. Opt., 17
(7), 076005
(2012). http://dx.doi.org/10.1117/1.JBO.17.7.076005 JBOPFO 1083-3668 Google Scholar
K. Masood et al.,
“Hyperspectral colon tissue classification using morphological analysis,”
in Proc. of the Second Int. Conf. on Emerging Technologies 2006,
735
–741
(2006). Google Scholar
E. Lindsley, E. S. Wachman and D. L. Farkas,
“The hyperspectral imaging endoscope: a new tool for in vivo cancer detection,”
Proc. SPIE, 5322 75
–82
(2004). http://dx.doi.org/10.1117/12.561884 Google Scholar
A. O. H. Gerstner et al.,
“Hyperspectral imaging of mucosal surfaces in patients,”
J. Biophotonics, 5
(3), 255
–262
(2012). http://dx.doi.org/10.1002/jbio.201100081 Google Scholar
M. E. Martin et al.,
“Development of an advanced hyperspectral imaging (HSI) system with applications for cancer detection,”
Ann. Biomed. Eng., 34
(6), 1061
–1068
(2006). http://dx.doi.org/10.1007/s10439-006-9121-9 ABMECF 0090-6964 Google Scholar
R. Martin, B. Thies and A. O. H. Gerstner,
“Hyperspectral hybrid method classification for detecting altered mucosa of the human larynx,”
Int. J. Health Geograph., 11 21
(2012). http://dx.doi.org/10.1186/1476-072X-11-21 Google Scholar
N. T. Clancy et al.,
“Multispectral image alignment using a three channel endoscope in vivo during minimally invasive surgery,”
Biomed. Opt. Express, 3
(10), 2567
–2578
(2012). http://dx.doi.org/10.1364/BOE.3.002567 BOEICL 2156-7085 Google Scholar
R. Leitner et al.,
“Multi-spectral video endoscopy system for the detection of cancerous tissue,”
Pattern Recognit. Lett., 34
(1), 85
–93
(2013). http://dx.doi.org/10.1016/j.patrec.2012.07.020 PRLEDG 0167-8655 Google Scholar
T. Dohi, K. Matsumoto and I. Shimoyama,
“The micro Fabry–Perot interferometer for the spectral endoscope,”
in 18th IEEE Int. Conf. on Micro Electro Mechanical Systems 2005,
830
–833
(2005). Google Scholar
S. Kiyotoki et al.,
“New method for detection of gastric cancer by hyperspectral imaging: a pilot study,”
J. Biomed. Opt., 18
(2),
(2013). Google Scholar
C. S. Liu, Z. M. Han and T. Y. Xie,
“Hyperspectral high-dynamic-range endoscopic mucosal imaging,”
Chin. Opt. Lett., 13
(7),
(2015). http://dx.doi.org/10.3788/COL201513.071701 Google Scholar
V. A. LiVolsi,
“Can we agree to disagree?,”
Hum. Pathol., 34
(11), 1081
–1082
(2003). http://dx.doi.org/10.1053/j.humpath.2003.09.005 HPCQA4 0046-8177 Google Scholar
P. N. Furness et al.,
“International variation in histologic grading is large, and persistent feedback does not improve reproducibility,”
Am. J. Surg. Pathol., 27
(6), 805
–810
(2003). http://dx.doi.org/10.1097/00000478-200306000-00012 Google Scholar
O. Kujan et al.,
“Why oral histopathology suffers inter-observer variability on grading oral epithelial dysplasia: an attempt to understand the sources of variation,”
Oral Oncol., 43
(3), 224
–231
(2007). http://dx.doi.org/10.1016/j.oraloncology.2006.03.009 EJCCER 1368-8375 Google Scholar
Z. M. Han et al.,
“New real-time endoscopy image processing technology of hemoglobin color enhancement,”
Proc. SPIE, 8192 819257
(2011). http://dx.doi.org/10.1117/12.903318 Google Scholar
S. Chaudhuri et al.,
“Detection of blood-vessels in retinal images using two-dimensional matched-filters,”
IEEE Trans. Med. Imaging, 8
(3), 263
–269
(1989). http://dx.doi.org/10.1109/42.34715 ITMID4 0278-0062 Google Scholar
W. R. Crum, T. Hartkens and D. L. G. Hill,
“Non-rigid image registration: theory and practice,”
Br. J. Radiol., 77 S140
–S153
(2004). Google Scholar
J. Kybic,
“Elastic image registration using parametric deformation models,”
180
(2001). Google Scholar
H. Lange et al.,
“Reflectance and fluorescence hyperspectral elastic image registration,”
Proc. SPIE, 5370 335
–345
(2004). http://dx.doi.org/10.1117/12.535720 Google Scholar
R. S. Mitra and N. N. Murthy,
“Elastic, maximal matching,”
Pattern Recognit., 24
(8), 747
–753
(1991). http://dx.doi.org/10.1016/0031-3203(91)90043-5 PTNRA8 0031-3203 Google Scholar
B. Zitova and J. Flusser,
“Image registration methods: a survey,”
Image Vision Comput., 21
(11), 977
–1000
(2003). http://dx.doi.org/10.1016/S0262-8856(03)00137-9 IVCODK 0262-8856 Google Scholar
Z. Du, M. K. Jeong and S. G. Kong,
“Band selection of hyperspectral images for automatic detection of poultry skin tumors,”
IEEE Trans. Autom. Sci. Eng., 4
(3), 332
–339
(2007). http://dx.doi.org/10.1109/TASE.2006.888048 1545-5955 Google Scholar
H. Akbari et al.,
“Blood vessel detection and artery-vein differentiation using hyperspectral imaging,”
in 2009 Annual Int. Conf. of the IEEE Engineering in Medicine and Biology Society,
1461
–1464
(2009). Google Scholar
S. Maji, A. C. Berg and J. Malik,
“Efficient classification for additive kernel SVMs,”
IEEE Trans. Pattern Anal. Mach. Intell., 35
(1), 66
–77
(2013). http://dx.doi.org/10.1109/TPAMI.2012.62 Google Scholar
K. Gono et al.,
“Endoscopic observation of tissue by narrowband illumination,”
Opt. Rev., 10
(4), 211
–215
(2003). http://dx.doi.org/10.1007/s10043-003-0211-8 1340-6000 Google Scholar
J. Rey, K. Kuznetsov and R. Lambert,
“Narrow band imaging: a wide field of possibilities,”
Saudi J. Gastroenterol., 13
(1), 1
–10
(2007). http://dx.doi.org/10.4103/1319-3767.30458 Google Scholar
BiographyZhimin Han is a PhD student in the Georgia Institute of Technology, Emory, and Peking University joint PhD program. His research interests include medical device development, electronics hardware design, and medical image analysis. Aoyu Zhang is a PhD student in the Department of Biomedical Engineering, Peking University. His research interests include medical device development and mechanical studies. Xiguang Wang is a PhD student in the Department of Biomedical Engineering, Peking University. His research interests include medical device development and electronics hardware design. Zongxiao Sun is a PhD student in the Department of Biomedical Engineering, Peking University. His research interests include medical device development and electronics hardware design. May D. Wang is an associate professor in the Department of Biomedical Engineering, Georgia Institute of Technology and Emory University. She is a Georgia Research Alliance Distinguished Cancer Scholar and Kavli fellow. Her research interests include biocomputing, integrated biomedical big data analytics, dynamic systems modeling for prediction, healthcare system dynamics modeling, biomedical informatics, and telemedicine. |
||||||||||||||||||||||||||||||||||||||||||||||||||||||||||||||||||||||||||||||||||||||||||||||||||||||||||||||||||||||||||||||


