|
|
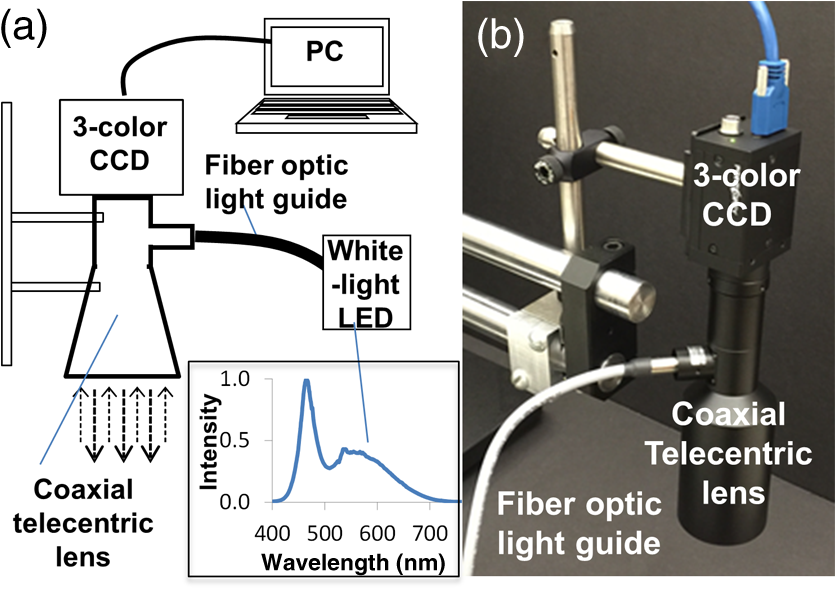
1.IntroductionAbiotic and biotic stress (e.g., drought, nutrient deficiency, temperature, and pathogen attack) impact plant growth and development, eventually influencing crop yield.1 Thus, it is critical to assess stress symptoms during early alteration stages before irreversible damage and yield loss occur.2 In addition, as transgenic and conventional plant breeding strategies seek to continue to improve plant input and output traits, researchers in laboratory and industry settings often require quantitative plant phenotyping technologies for specific selection of pathogen-resistant, stress-tolerant, and high-yielding plants.3 Indeed, there is a strong need for plant imaging technologies that nondestructively and quantitatively visualize stress traits in situ. Importantly, alterations in chlorophyll content are one of the key symptoms that plants display under stresses as a major component of photosynthesis.3 There are a few methods currently available for quantifying chlorophyll content. Since subtle alterations in chlorophyll are not visible until they reach a certain level, destructive biochemical analyses serve as the gold standard. Optical meters, which quantify chlorophyll content as spot measurements, are also used as an advanced method, given the nondestructive nature of the technologies.4 However, these methods provide chlorophyll content in a single spot area, lacking the information on spatial distribution. In this respect, fluorescent imaging of chlorophyll has received considerable attention as a nondestructive imaging method.5–7 Indeed, chlorophyll fluorescence imaging serves as a valuable tool for quantifying leaf photosynthetic efficiency. On the other hand, quantitative assessment of absolute chlorophyll content using chlorophyll fluorescence is often limited, because fluorescent signals depend on measurement parameters, including the duration (e.g., continuous or pulsed) and the bandwidth (e.g., laser or incoherent light source) of the excitation source as well as quenching of fluorescence. Thus, it would not be straightforward to obtain an absolute value of chlorophyll content when different instruments for detecting chlorophyll fluorescence are utilized. As a result, fluorescence signals in plants often serve as a proxy measure or an indirect indicator of photosynthesis. On the other hand, reflectance measurements are based on elastic light scattering and absorption, in which the wavelength is not changed by the scattering or absorption processes without energy conversion. In this respect, reflectance-based approaches could potentially provide simple and reliable quantification of chlorophyll content while resolving its spatial heterogeneity. For label-free imaging, conventional hyperspectral imaging systems rely on the use of a mechanical filter wheel, an imaging spectrograph, or a liquid crystal tunable filter, all of which limit the development of simple, compact, and cost-effective systems. To build compact and affordable systems for widespread utilization, it would be desirable to realize a spectrometerless (or spectrometer-free) imaging system. Such a system can be implemented by utilizing an algorithm that can reliably reconstruct full spectral information from RGB image data, which are easily acquired by commonly used three-color CCD (or CMOS) cameras. Fortunately, several methods for spectral reconstruction with RGB data have been studied extensively.8–10 Thus, hyperspectral reconstruction approaches using RGB data could potentially lead to simplicity for instrumentation and operation without using bulky and expensive color filters and spectrometers. In this study, we report that a spectrometerless reflectance imaging method can map out the detailed spatial distributions of chlorophyll content in individual leaves in situ in a handheld device format. First, we confirm that reflectance spectral patterns correlate with chlorophyll content in leaves assessed by biochemical analyses. Initially, we utilize a laboratory system coupled with an imaging spectrograph with a high spectral resolution for obtaining a full reflectance spectrum in each location. As a testing model, Arabidopsis thaliana is used. We also measure the total chlorophyll content in each sample using conventional biochemical assays. Second, we conduct numerical experiments for extracting chlorophyll content without using hyperspectral imaging data. We implement a hyperspectral reconstruction algorithm that reliably reconstructs the full spectral information in plant leaves from RGB data. Third, we test a handheld-type spectrometerless imaging system consisting of a three-color CCD camera and a white-light light-emitting diode (LED) as a detector and a light source, respectively. Finally, we demonstrate detailed chlorophyll imaging in a whole leaf by acquiring RGB data only, without using an imaging spectrograph, in a pilot testing study. 2.Materials and Methods2.1.Plant Models and Biochemical Assays for Chlorophyll QuantitationA series of 24 leaf samples from A. thaliana, a well-known model plant, were utilized for covering a wide range of total chlorophyll content from 0.17 to . A. thaliana ecotype Col-0 was cultivated at a light intensity of at 22 °C under a photoperiod of 16-h light/ 8-h dark. Rosette leaves were detached from 4-week-old plants, were incubated in a solution of 3-mM MES (2-[-morpholino]ethanesulfonic acid) at pH 5.7, and were kept under dark for up to 6 days. For conventional biochemical assays, we extracted chlorophyll with 95% ethyl alcohol after incubating the samples at 70 °C for 1 h. Then, absorbance at 665 and 649 nm was measured using a UV/visible spectrophotometer. Finally, total chlorophyll content (i.e., chlorophyll and chlorophyll ) was calculated in the unit of (i.e., chlorophyll/fresh weight) as previously described.11 2.2.Laboratory Hyperspectral Imaging SystemFor obtaining experimental spectra from leaf samples, our recently developed system described elsewhere was used.12–14 This system allowed us to acquire a matrix of reflectance intensity (also known as a hypercube) as a function of the position and the wavelength of light. The specification included a transverse resolution of with a field of view of , an imaging depth of , and a spectral range of 400 to 770 nm with a spectral resolution of 2 nm. A back-directional (angular) filtering scheme in the detection part collected the light reflected from the sample within a narrow solid angle in the exact backward direction. Importantly, this configuration avoided spectral variations originating from different systems, because reflectance spectra, in particular scattering components, are highly sensitive to illumination and detection geometries.15 It should be noted that this aspect is crucial to apply a hyperspectral image reconstruction algorithm, trained by hyperspectral data obtained from the laboratory system, to a spectrometerless imaging system. To remove the stray background light and to compensate for the system responses, the following procedures were implemented:13,16 First, after the acquisition of a raw intensity matrix from the sample , a background intensity matrix without the sample was measured and then subtracted from the raw intensity matrix. Second, by placing a reflectance reference standard (Labsphere, North Sutton, New Hampshire) on the sample stage, a reference intensity matrix was measured. Because the reflectance reference standard had flat spectral and uniform spatial responses in the entire visible range, captured the entire system responses. Third, was normalized by such that Thus, the resultant intensity matrix was mainly determined by the scattering and absorption properties of the sample, without being affected by the system responses, including the light source or the camera.2.3.Spectrometerless Imaging System Using a Three-Color CCDA working prototype of the spectrometerless hyperspectral imaging system was also constructed, as shown in Fig. 1. To directly use a hyperspectral reconstruction algorithm trained using the laboratory system, it was important to minimize any spectral variations resulting from different illumination and detection configurations.15 Thus, the illumination and detection configurations of the laboratory system were mimicked in the prototype system. In particular, a telecentric lens with coaxial illumination (magnification of , Schott Moritex, Japan) allowed us to image the light scattered from the sample in the exact backward direction with respect to the incident light, acting as back-directional angular gating in the reflection mode.17 A white-light LED ( LED Spot Light, Edmund Optics, Barrington, New Jersey) was coupled to the telecentric lens via a fiber-optic light guide and was illuminated onto the plant sample. The light reflected from the sample was collected using the same telecentric lens mounted with a three-color CCD (Color Grasshopper3, Point Grey Research, Richmond, British Columbia). The system had a field of view of with a pixel size of . Similarly to the hyperspectral measurements, an RGB intensity matrix was normalized by a reference signal from the reflectance reference standard to compensate for the spectral and spatial responses of the entire system, including the light source, the fiber-optic light guide, the telecentric lens, and the CCD camera. Thus, it should also be noted that this resultant intensity matrix was relatively independent of the spectral responses of the light source and the camera. 2.4.Reconstruction of Hyperspectral Image Data from RGB DataThe relationship between a full reflectance spectrum and an RGB reflectance spectrum in each position can be modeled such that8–10 where is a vector that has RGB intensities, is a matrix of the spectral responses of the three-color camera sensor, is an vector that has the reflectance intensity normalized by the reflectance standard, and is a vector of system noise with zero mean. indicates the number of wavelengths. In our case, from 400 to 770 nm with an interval of 2 nm. In general, can be obtained from the sensor manufacturer or estimated mathematically from training color samples.18,19 Then, the problem to reconstruct a full spectrum from an RGB spectrum is to solve the following question: “Would it be possible to compute or estimate given and are known?” In fact, Eq. (2) can be considered as a system of linear equation. However, since the dimension of is a , an infinite number of solutions of can exist to satisfy Eq. (2). Fortunately, several methods and techniques for reconstructing full spectra from RGB data have been studied extensively, such as Wiener estimation8–10,20–22 and regression methods.23–25Suppose that a reflectance spectrum and a corresponding RGB spectrum are collected for each sample. Then, and can be formed by stacking the spectra from several independent samples, where is the number of different samples and is the number of wavelengths. This reconstruction problem is to learn a conversion matrix from a training set such that can be solved using a method of least squares that minimizes differences between the original spectra and the reconstructed spectra. Once a conversion matrix is built from a training set, a reflectance spectrum can be predicted given a new RGB spectrum as a testing set. In particular, the prediction ability for full spectral construction can be improved with polynomial regression.23,24 In our case, a possibly nonlinear relationship between full and RGB spectra can be captured by extending to for polynomials with the second degree.3.Results and Discussion3.1.Hyperspectral Chlorophyll ImagingTo map out detailed spatial distribution of leaf chlorophyll concentration in the actual unit of , we utilized a chlorophyll spectral index and converted the spectral index to an absolute value of chlorophyll concentration. First, for plant chlorophyll content quantification, we exploited the extensively used spectral index (SI) for chlorophyll content26 where is the reflectance intensity at given an position. We note that this approach has not yet been used for detailed visualization of chlorophyll content in individual leaves, in part because of the lack of appropriate hyperspectral systems, although this has been widely used in canopy and remote sensing measurements. Second, we validated the correlation between SI and chlorophyll content, when the reflectance spectra from the entire leaves were averaged and the total chlorophyll content was measured with the biochemical assays. Indeed, Fig. 2 shows that the -value of the slope estimate of linear regression between SI and chlorophyll content is , and that the correlation coefficient is 0.89, supporting the statistically significant linear association. In turn, this relationship served as a conversion curve from SI to chlorophyll content to extract an absolute value of chlorophyll content. Third, we extended this spectral calculation in each pixel to generate a planar image of chlorophyll content in each leaf sample. As shown in Fig. 3, chlorophyll images reveal unique spatial distributions of chlorophyll content, which are not obvious from conventional photographs.3.2.Reconstruction of Reflectance Image Data Using RGB DataWe computationally implemented a hyperspectral reconstruction algorithm that can reliably predict detailed spectral information from RGB data. Among several different reconstruction methods, we chose polynomial multivariate regression, described in Sec. 2.4, for reconstructing reflectance spectra for optimal performance. To generate a conversion matrix in Eq. (3), we imaged 24 A. thaliana leaf samples as follows: first, because of the relatively small sample size (), we used the entire data set for training. To build a model for reconstructing reflectance spectra using RGB data, an RGB camera response was expressed in terms of and in Eq. (2). We obtained from the manufacturer (Sony ICX625) that was used in the handheld system [inset in Fig. 4(a)]. Second, we determined a conversion matrix by applying multivariate polynomial regression in Eq. (3). Finally, we computed a reconstructed reflectance spectrum for a new RGB spectrum. In this step, to determine the best polynomial degree, was varied such that for second-order polynomial regression, which provided reliable performance in our plant hyperspectral image data. Fig. 4(a) Reconstruction of full spectral information from RGB data. Representative comparison between an original reflectance spectrum obtained from the laboratory hyperspectral system and a reconstructed one from RGB data. Inset: Spectral response of the three-color CCD camera. (b) 95% confidence intervals of mean differences (dark line) between the original reflectance spectra and the estimated spectra at each wavelength. Inset: Goodness-of-fit metrics from all of the plant samples using the leave-one-out cross-validation method.  The overall performance of the reconstruction method was validated utilizing a leave-one-out cross-validation method with all of the plant samples (). In this validation, each round of cross-validation used 23 spectra as a training set to reconstruct a full spectrum from the RGB data, and a total of 24 rounds were performed. The accuracy of the reconstructed spectral information was evaluated using goodness-of-fit metrics [i.e., coefficient of determination and root mean square error (RMSE)]. Given the relatively small sample size, leave-one-out cross-validation was a reasonable validation method for avoiding over-fitting. It should be noted that reconstruction models were built using only the training data set. The representative spectra in Fig. 4(a) show that a full reflectance spectrum can be reliably reconstructed from the RGB data, compared to the original hyperspectral data. To estimate errors of the hyperspectral reconstruction method, we further analyzed differences between the original reflectance spectra and the estimated spectra in the entire wavelength range. Figure 4(b) shows 95% confidence intervals for mean differences between the original reflectance spectra and the estimated spectra. As expected, the wavelength regions around 400 nm and above 700 nm have wider confidence intervals because of the limited spectral range of the RGB channel of the camera, as shown in the inset of Fig. 4(a). After including all of the samples with second-order polynomial multivariate regression, the average RMSE of cross-validation from 24 samples was 0.013 ( and ) and the average adjusted was 0.99 ( and ), as shown in the inset of Fig. 4(b). This numerical evaluation supports the feasibility that chlorophyll content can be sensitively and accurately predicted using the three-color sensor-based system. 3.3.Spectrometerless Chlorophyll ImagingAs a pilot test, we acquired hyperspectral image data and RGB image data from Arabidopsis samples in a sequential manner. After the samples were imaged using the original laboratory imaging system (with the imaging spectrograph), the identical samples were also imaged using the handheld prototype system with the three-color CCD. Figures 5(a) and 5(b) depict representative chlorophyll images from the original hyperspectral imaging system and the prototype spectrometerless system, respectively. We compared the spatial distribution patterns of chlorophyll content and obtained from the laboratory hyperspectral system and the spectrometerless system. Specifically, we calculated a two-dimensional (2-D) correlation coefficient , which is defined as A calculated in this specific case was 0.93, supporting the strong similarity of spectrometerless chlorophyll imaging. We note that the subtle discrepancy in the two chlorophyll images originated from rapid dehydration in detached leaves, because the data acquisition time of the original system was relatively slow (). In addition, the exact validation of the hyperspectral reconstruction algorithm was challenging, because the two systems had different pixel sizes and imaging areas, and the sample orientation to the system was not the same. Thus, a next-generation integrated imaging system would produce more reliable comparisons. Overall, this pilot test demonstrates that the working prototype of the spectrometerless imaging system has the potential for detailed spatial and high-temporal imaging of chlorophyll content.4.ConclusionThis study demonstrates that the proposed spectrometerless imaging method is capable of nondestructive and quantitative in situ imaging of chlorophyll content. A reliable spectrometerless (or spectrometer-free) hyperspectral imaging system was developed using a commonly used three-color CCD (or CMOS) camera. Detailed spatial distribution of chlorophyll content in a whole leaf was successfully visualized with a high correlation between the reflectance spectra pattern and the chlorophyll content. Although our hyperspectral reconstruction is currently applicable for Arabidopsis samples, due to the Arabidopsis-based model training, future systematic studies will allow us to image other type of plants and crops as well as various pigments besides chlorophyll (e.g., anthocyanin and carotenoid). This capability of imaging multiple stress traits would help to deepen our understanding of stress and coping mechanisms in plants. Further, this prototype could potentially serve as a platform for easy integration into an imaging instrument of modest price, potentially leading to widespread uses. ReferencesR. Mittler,
“Abiotic stress, the field environment and stress combination,”
Trends Plant Sci., 11
(1), 15
–19
(2006). http://dx.doi.org/10.1016/j.tplants.2005.11.002 Google Scholar
R. D. Jackson,
“Remote sensing of biotic and abiotic plant stress,”
Annu. Rev. Phytopathol., 24
(1), 265
–287
(1986). http://dx.doi.org/10.1146/annurev.py.24.090186.001405 APPYAG 0066-4286 Google Scholar
L. Li, Q. Zhang and D. F. Huang,
“A review of imaging techniques for plant phenotyping,”
Sensors, 14
(11), 20078
–20111
(2014). http://dx.doi.org/10.3390/s141120078 SNSRES 0746-9462 Google Scholar
C. Parry, J. M. Blonquist and B. Bugbee,
“In situ measurement of leaf chlorophyll concentration: analysis of the optical/absolute relationship,”
Plant Cell Environ., 37
(11), 2508
–2520
(2014). http://dx.doi.org/10.1111/pce.12324 PLCEDV 1365-3040 Google Scholar
K. Maxwell and G. N. Johnson,
“Chlorophyll fluorescence—a practical guide,”
J. Exp. Bot., 51
(345), 659
–668
(2000). http://dx.doi.org/10.1093/jexbot/51.345.659 JEBOA6 1460-2431 Google Scholar
C. Rousseau et al.,
“High throughput quantitative phenotyping of plant resistance using chlorophyll fluorescence image analysis,”
Plant Methods, 9
(1), 17
(2013). http://dx.doi.org/10.1186/1746-4811-9-17 Google Scholar
L. A. Spomer, M. A. L. Smith and J. S. Sawwan,
“Rapid, nondestructive measurement of chlorophyll content in leaves with nonuniform chlorophyll distribution,”
Photosynth. Res., 16
(3), 277
–284
(1988). Google Scholar
S. Chen and Q. Liu,
“Modified Wiener estimation of diffuse reflectance spectra from RGB values by the synthesis of new colors for tissue measurements,”
J. Biomed. Opt., 17
(3), 030501
(2012). http://dx.doi.org/10.1117/1.JBO.17.3.030501 JBOPFO 1083-3668 Google Scholar
I. Nishidate et al.,
“Noninvasive imaging of human skin hemodynamics using a digital red–green–blue camera,”
J. Biomed. Opt., 16
(8), 086012
(2011). http://dx.doi.org/10.1117/1.3613929 JBOPFO 1083-3668 Google Scholar
H.-L. Shen, J. H. Xin and S.-J. Shao,
“Improved reflectance reconstruction for multispectral imaging by combining different techniques,”
Opt. Express, 15
(9), 5531
–5536
(2007). http://dx.doi.org/10.1364/OE.15.005531 OPEXFF 1094-4087 Google Scholar
H. K. Lichtenthaler,
“Chlorophylls and carotenoids—pigments of photosynthetic biomembranes,”
Methods Enzymol., 148 350
–382
(1987). MENZAU 0076-6879 Google Scholar
R. L. Konger et al.,
“Spatiotemporal assessments of dermal hyperemia enable accurate prediction of experimental cutaneous carcinogenesis as well as chemopreventive activity,”
Cancer Res., 73
(1), 150
–159
(2013). http://dx.doi.org/10.1158/0008-5472.CAN-12-2670 CNREA8 0008-5472 Google Scholar
Z. Xu et al.,
“Back-directional gated spectroscopic imaging for diffuse light suppression in high anisotropic media and its preclinical applications for microvascular imaging,”
IEEE J. Sel. Top. Quantum Electron., 16
(4), 815
–823
(2010). http://dx.doi.org/10.1109/JSTQE.2009.2037160 IJSQEN 1077-260X Google Scholar
Z. Xu et al.,
“Spectroscopic visualization of nanoscale deformation in bone: interaction of light with partially disordered nanostructure,”
J. Biomed. Opt., 15
(6), 060503
(2010). http://dx.doi.org/10.1117/1.3514633 JBOPFO 1083-3668 Google Scholar
S. C. Gebhart, S. K. Majumder and A. Mahadevan-Jansen,
“Comparison of spectral variation from spectroscopy to spectral imaging,”
Appl. Opt., 46
(8), 1343
–1360
(2007). http://dx.doi.org/10.1364/AO.46.001343 APOPAI 0003-6935 Google Scholar
Y. L. Kim et al.,
“Simultaneous measurement of angular and spectral properties of light scattering for characterization of tissue microarchitecture and its alteration in early precancer,”
IEEE J. Sel. Top. Quantum Electron., 9
(2), 243
–256
(2003). http://dx.doi.org/10.1109/JSTQE.2003.814183 IJSQEN 1077-260X Google Scholar
J. H. Moore et al., Building Scientific Apparatus, University Printing House, Cambridge, United Kingdom
(2009). Google Scholar
K. Barnard and B. Funt,
“Camera characterization for color research,”
Color Res. Appl., 27
(3), 153
–164
(2002). CREADU 0361-2317 Google Scholar
H.-L. Shen and J. H. Xin,
“Spectral characterization of a color scanner by adaptive estimation,”
J. Opt. Soc. Am. A, 21
(7), 1125
–1130
(2004). http://dx.doi.org/10.1364/JOSAA.21.001125 JOAOD6 0740-3232 Google Scholar
Y. Murakami et al.,
“Color reproduction from low-SNR multispectral images using spatio-spectral Wiener estimation,”
Opt. Express, 16
(6), 4106
–4120
(2008). http://dx.doi.org/10.1364/OE.16.004106 OPEXFF 1094-4087 Google Scholar
I. Nishidate et al.,
“Estimation of melanin and hemoglobin using spectral reflectance images reconstructed from a digital RGB image by the Wiener estimation method,”
Sensors, 13
(6), 7902
–7915
(2013). http://dx.doi.org/10.3390/s130607902 SNSRES 0746-9462 Google Scholar
I. Nishidate et al.,
“In vivo imaging of scattering and absorption properties of exposed brain using a digital red–green–blue camera,”
Proc. SPIE, 8928 89280N
(2014). http://dx.doi.org/10.1117/12.2041169 Google Scholar
S.-C. Yoon et al.,
“Hyperspectral image reconstruction using RGB color for foodborne pathogen detection on agar plates,”
Proc. SPIE, 9024 90240I
(2014). http://dx.doi.org/10.1117/12.2041085 Google Scholar
S.-C. Yoon et al.,
“Hyperspectral imaging using a color camera and its application for pathogen detection,”
Proc. SPIE, 9405 940506
(2015). http://dx.doi.org/10.1117/12.2083137 Google Scholar
W.-F. Zhang and D.-Q. Dai,
“Spectral reflectance estimation from camera responses by support vector regression and a composite model,”
J. Opt. Soc. Am. A, 25
(9), 2286
–2296
(2008). http://dx.doi.org/10.1364/JOSAA.25.002286 JOAOD6 0740-3232 Google Scholar
D. A. Sims and J. A. Gamon,
“Relationships between leaf pigment content and spectral reflectance across a wide range of species, leaf structures and developmental stages,”
Remote Sens. Environ., 81
(2), 337
–354
(2002). http://dx.doi.org/10.1016/S0034-4257(02)00010-X RSEEA7 0034-4257 Google Scholar
BiographyTaehoon Kim is a PhD student in the Weldon School of Biomedical Engineering, Purdue University, West Lafayette, Indiana, USA. Jeong-Im Kim is a research scientist in the Department of Biochemistry, Purdue University, West Lafayette, Indiana, USA. Michelle A. Visbal Onufrak received her BS and MS degrees in electrical engineering from the University of Puerto Rico, Mayaguez, Puerto Rico, USA. She is currently pursuing her PhD in biomedical engineering, Purdue University, West Lafayette, Indiana, USA. Her current research project consists in developing noninvasive optical imaging devices for clinical assessment of precancerous lesions in collaboration with Indiana University School of Medicine. Clint Chapple is a distinguished professor of biochemistry, Purdue University, West Lafayette, Indiana, USA. His areas of expertise include biochemistry and molecular biology of plant secondary metabolism. Young L. Kim received his PhD degree in biomedical engineering and his MS degree in clinical investigation from Northwestern University in 2005 and 2007, respectively. He is currently an associate professor in the Weldon School of Biomedical Engineering and a codirector of the Biomedical Sciences Interdisciplinary Graduate Program at Purdue University, West Lafayette, Indiana, USA. His research interests include light-matter (e.g., natural materials and biological tissue) interactions, biophotonics technology development for sensing, imaging, and treatment, and biostatistical analyses. |