
|
|
1.IntroductionDiffuse optical tomography (DOT) is an emerging functional imaging technique with a great potential in medical imaging.1–5 It uses near-infrared (NIR) light to probe deep tissues because of the low-optical attenuation in this spectral window.6 By imaging metabolic compounds such as water, fat, and oxy- and deoxy-hemoglobin,7 DOT is an emerging imaging tool for breast cancer monitoring8–19 and functional brain imaging.20–25 Despite extensive efforts, its translation to the clinical arena has been delayed due to its poor spatial resolution. In fact, the highly scattering nature of the biological tissue makes the reconstruction of DOT images a very challenging process. Several factors degrade the spatial resolution and quantitative accuracy of DOT. Some of these are the ill-posed nature of the inverse problem and nonuniqueness of the solution, which results from the fact that data are measured only at the boundary of the imaged medium.26 Also, solving the inverse problem in DOT requires the inversion of the sensitivity matrix describing the relationship between each measurement and the unknowns to be reconstructed. Since the number of measurements is much smaller than the unknowns, DOT inverse problem is underdetermined and the sensitivity matrix is nonsquare.27 Therefore, its inversion is not a straight forward process and requires the use of unstable pseudo inversion methods.28,29 It has been demonstrated that the quality of reconstructed tomographic images can be considerably improved in general, if internal measurements are available.30 In fact, this reduces the under-determination of the inverse problem and makes it well-posed. Accordingly, the ideal scheme for DOT would be performing optical measurements from the whole medium under investigation, which is currently not possible with conventional DOT approaches. Meanwhile, an intriguing combination of optical and ultrasound techniques has led the development of photoacoustic imaging (PAI) that can provide optical absorption maps with much higher resolution with several centimeters of depth penetration.31–33 In PAI, a short-pulsed laser () is used to irradiate the sample. The sound wave produced by the thermoelastic expansion of the tissue as a result of the energy deposition of the incident laser light is detected by ultrasound transducers. The ultrasound waves scatter much less in biological tissue than optical waves and this drastically improves the overall resolution. In addition to requirement of a pulsed laser, PAI requires transducer-tissue contact due to utilization of sound waves. Although great deal of progress has been achieved in this powerful imaging technology, thick tissue imaging is challenging and considerable effort is still being spent for its clinical translation.34 Previously, we introduced a new alternative technique that we termed photomagnetic imaging (PMI).35,36 Although PMI aims to recover spatially resolved optical absorption of the medium under investigation, it does not utilize any optical detectors. Instead of the conventional boundary optical measurements, PMI utilizes magnetic resonance thermometry (MRT) to measure internal spatiotemporal distribution of temperature variation induced by the local absorption of light when the medium is illuminated with a laser. Despite its similarity to PAI in terms of leveraging temperature modulation induced by laser illumination, PMI is inherently different due to utilization of noncontact MRT measurements and slow heating process achieved in a much longer time-frame (i.e., tens of seconds). PMI provides high-resolution optical absorption maps using the measured temperature maps and modeling of light propagation in addition to heat diffusion in tissue. The dedicated PMI reconstruction algorithm is based on the minimization of the difference between the measured and simulated spatiotemporal temperature maps. These simulated time-dependent temperature maps are obtained by solving the coupled diffusion and Pennes bioheat equations with finite element method (FEM).2,37–39 In fact, this system of equations models the photon density distribution in the medium and the conversion of photons energy to bioheat by considering the local optical absorption.36,40 Since the quality of the reconstructed PMI optical absorption images directly depends on the quality of the temperature measurements, the choice of MRT imaging parameters is critical. Several MRT parameters can be used to determine the absolute or relative temperature inside a medium such as T1 or T2 relaxation time, the diffusion coefficient, magnetization transfer, or proton resonance frequency (PRF). Unlike T1 or T2 MRT, PRF is linearly dependent on temperature. Moreover, PRF has been widely used to monitor the temperature variation when performing ablation therapy.41 Technically, the temperature increase causes the decrease of hydrogen bonding which decreases the PRF. Using any phase sensitive magnetic resonance imaging (MRI) sequence such as gradient echo, asymmetric spin echo, or Echo-planar imaging, a proportional relationship is established between the phase accumulation and temperature change between successive frames.42,43 PRF is not only fast, realizing up to but also very sensitive and invariant for different types of tissues.44 Also, by reducing the temporal resolution, its sensitivity can be enhanced further. In our previous work, we presented the feasibility of PMI.35 In these initial studies, the measured temperature maps were matched with the estimated ones using the FEM-based multiphysics forward solver. This first prototype PMI system had a single illumination port and a low signal-to-noise ratio (SNR) that resulted in utilization of high-illumination power, nearly three times of the maximum skin exposure limits defined by the American National Standards Institute (ANSI). In this study, we present a full four-port illumination PMI system with a higher SNR which brings down the laser power levels below the ANSI limits and paves the way for the future clinical use of PMI for diagnostic purposes. More importantly, we present the first experimental studies that involve the reconstruction of optical absorption maps using a dedicated PMI reconstruction algorithm, which was tested earlier with simulation studies.36 To evaluate the performance of the PMI in resolving inclusions as a function of their absorption contrast, size, and depth, multiple phantoms are constructed and utilized. The results confirmed that PMI is not only able to resolve inclusions as small as 1-mm diameter but also recover their absorption coefficients accurately. 2.Method2.1.ModelingOur PMI technique provides a high-resolution optical absorption map from the temperature measurements within a medium while irradiating it with NIR light. During this process, the medium warms-up and the temperature change at any point is proportional to the absorbed optical energy, which is directly related to the local optical absorption and photon density.35 To model the propagation of photons in the medium and simulate the corresponding temperature increase at any position, FEM-based forward solvers are developed. This FEM model allows us to solve the forward problem namely, simulating the time-dependent temperature increase at any point utilizing both diffusion and bioheat equations as explained below. Once the MRT temperature maps are acquired, PMI image reconstruction can be achieved by iteratively minimizing the quadratic difference between the measured and the simulated temperatures using the following objective function: where and are the number of sources and detectors, respectively. Note that using MRT, measurements are performed within the medium at all the nodes and thus is equal to the number of the FEM mesh nodes . represent the measured temperatures at node when source is used to heat the medium. are the temperature simulated using the FEM forward solver considering the absorption distribution . This forward solver is defined by a system of two equations. The first one is the diffusion equation, which is used to model the propagation of light in the medium.37,38,45 The second equation is the Pennes bioheat thermal equation used to model the propagation and dynamics of the temperature induced by the laser in the medium39 where () is the photon density at position (mm), () is the absorption coefficient and is the diffusion coefficient, with () being the reduced scattering coefficient. is the isotropic sources positioned under the irradiated surface of the imaged medium, at a distance from the surface imposed by the approximation to diffusion equation and equal to . For the second equation terms, is the density (), , specific heat [] and the thermal conductivity [] of the medium. The right-hand side of the second equation represents the source of thermal energy induced by the laser and is defined as the product of the optical absorption and the photon density at any point within the medium.36,40 For phantom experiments presented in this paper, the metabolic heating and blood perfusion terms are neglected in the second equation but should be accounted for when performing in vivo experiments. Neumann boundary conditions are used for the diffusion equation where is the vector normal to the surface of the medium and is defined using the reflection coefficient at the surface.46 For the second equation, the boundary conditions are defined considering the heat convection at the boundary only36 with being the ambient temperature and being the heat transfer coefficient [] at the surface of the medium.2.2.Magnetic Resonance ThermometryThe MRT temperature maps are obtained using a gradient echo imaging sequence.47 These maps are derived from the phase variations induced by the change in resonance frequency which is highly temperature sensitive. Generally, the temperature maps are expressed as a variation of temperature between two given frames acquired one after the other. This allows us the elimination of all the temperature-independent components in the measured phase. The temperature change is then obtained by the following equation: where is the measured MR signal phase at every pixel at time . is the baseline MR signal phase measured at a defined temperature. is the gyromagnetic ratio ( for hydrogen). is the coefficient describing the phase change depending on temperature (typically for biological tissue). is the local magnetic field and is the MRT echo time (ET), or the time between excitation and data acquisition.3.Experimental StudiesThe MRT measurements are performed inside a Philips 3 Tesla Achieva system. PRF images are acquired using a gradient echo sequence using 60 and 12 ms as repetition and ET, respectively. Figure 1(a) shows a schematic of our special designed animal MRI coil inside the MR bore. The illumination of the phantom is realized using four 7-W laser diodes emitting at 808 nm (Focuslight, China). The laser diodes and their drivers are all positioned at the control room, far away from the magnet. Light is transported to the PMI interface located inside the MR bore using four 15-m long optical fibers. The PMI interface consists of a specially designed RF coil with four windows for illumination and four ports that hold the collimation optics (Fig. 1). When optical fibers are connected to these ports, their light output is collimated using 35-mm Newport optics aspherical lenses prior to reaching the sample positioned at the center of the RF coil. The laser power per unit area is set to the ANSI limits ( for 808 nm) and confirmed by a power meter (PM100D, Thorlabs). Fig. 1(a) A schematic of PMI setup showing the phantom and the optical instrumentation inside the MRI bore. (b) The picture of the PMI interface sitting on the MRI bed. It consists of a specially designed RF coil with four windows for illumination and four ports that hold the collimation optics. 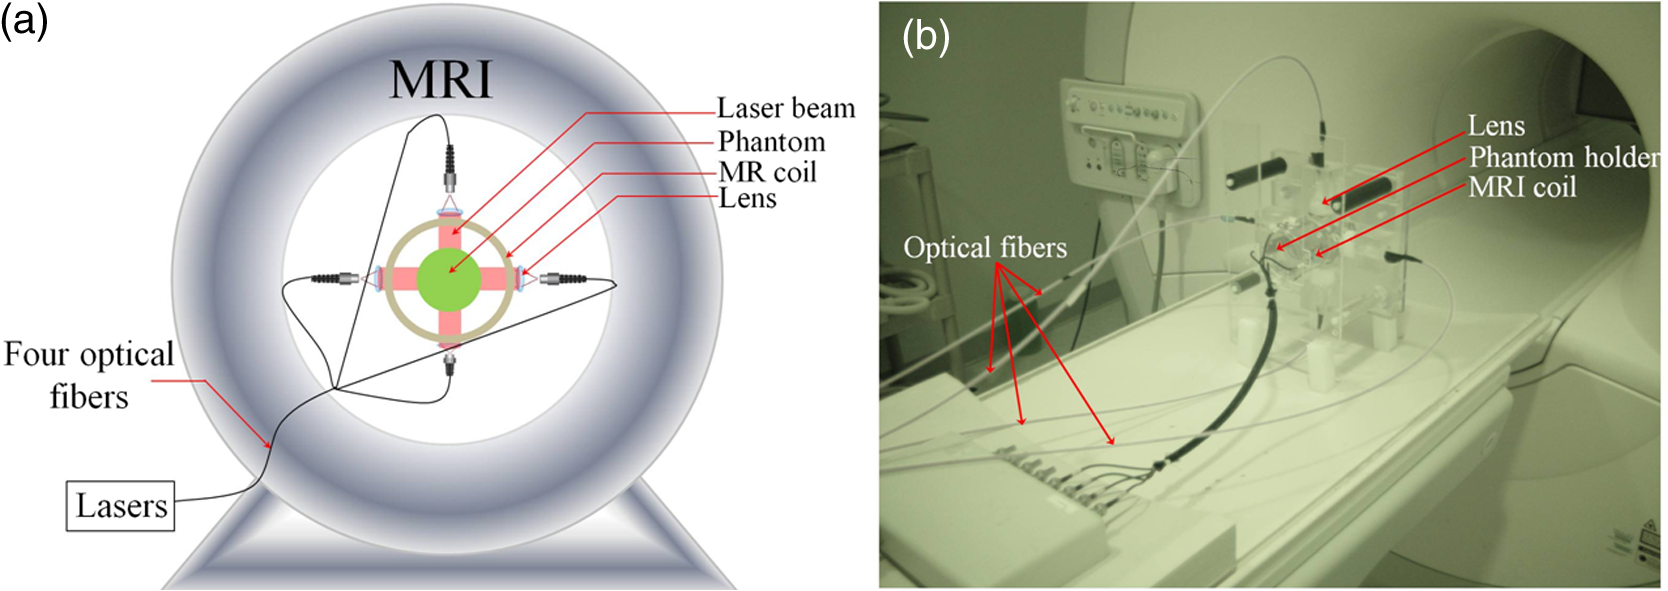 The MR temperature maps acquisition is synchronized with the laser drivers. Figure 2(a) shows the timeline of data acquisition. First, a T1 weighted low-resolution MR pilot image is acquired to localize the axial position of the laser probe. Once the axial plane located, a dynamic imaging set consisting of multiple frames (6 s each) is initiated. Gradient echo sequence is used to obtain a high-resolution phase image at each time point. The first baseline frame () is acquired before turning-on the laser. After the lasers are turned on, the phantom is illuminated simultaneously from four sides during the heating phase, and another frame is acquired () (Fig. 2). Therefore the total PMI data acquisition time is nearly 12 s. After subtracting the baseline image () from the image acquired during heating phase (), relative phase change for each pixel can be obtained and hence, a high-resolution image describing the temperature increase can be attained using Eq. (5). In fact, each pixel of this image serves as a measurement point to monitor the temperature increase. This temperature map is utilized as the final measurement map in the PMI reconstruction minimization process [Eq. (1)]. Actually, more than one frame can also be acquired during the heating phase to boost the temperature change and hence, SNR. Although, the best PMI reconstruction should be obtained using phase image acquired at the end of the heating cycle in general, combination of several frames can also be utilized.36 Note that PMI data can be acquired continuously as long as the laser illumination is kept under ANSI limits. Fig. 2(a) Timeline of PMI data acquisition showing the laser status, sample temperature at any particular point and the MRT acquisition for different cycles. (b) An illustration for the mesh of the cross section of the phantom and the collimated laser illumination beams directed onto the sample from four sides.  4.Results4.1.Forward Problem ValidationThe first step in the experimental validation of our technique is the validation of the forward problem. For this purpose, a PMI temperature map is first acquired using a mice-sized 25-mm diameter cylindrical agarose homogeneous phantom with an optical absorption coefficient of , to mimic biological tissue. A 5-mm inclusion is embedded inside the phantom, 6-mm deep under the illumination site in order to mimic heterogeneous medium having a higher absorption area [Fig. 3(a)]. The inclusion is placed a bit off-center and its optical absorption is set to be eight times higher than the background. Fig. 3(a) The phantom cross section showing the inclusion size and position. The laser used to heat the phantom from its top side is represented by the red arrow S. The temperature maps (b) measured using MRT and (c) simulated using the forward solver. (d) The profiles taken along the -axis on the measured and simulated temperature maps.  Meanwhile, using the forward solver, the temperature map is simulated on an identical synthetic phantom having the same size, optical, and thermal properties. This simulated temperature map is then compared to the temperature map obtained by MRT. Figures 3(b) and 3(c) show the measured and simulated temperature maps, respectively. Note that, in order to compare the measured and the simulated data, a calibration step is needed. During this step, two parameters are defined from the experimental setup: the power of the laser and the shape of the illumination beam. First, the laser power is measured at the output of each of the four collimation lenses using a power meter. Second, PMI measurements are performed on a homogeneous phantom with known optical and thermal properties. The PMI interface holds the phantom at the center and therefore, the position of the illumination beams on the sample is approximately known. Nevertheless, a minimization program calculates the exact position of the illumination beams on the sample by minimizing a quadratic difference between the measured and simulated temperature maps. Using these calculated parameters, a very good agreement is achieved between simulated and measured maps on this heterogeneous phantom as shown by the profiles shown in Fig. 3(d). These first simulations show that the variation in the temperature decreases quickly with depth and goes below the sensitivity of our instrumentation. Additional simulations are performed to analyze the effect of simultaneous multiple point illumination on the depth penetration and stability of the inverse problem rather than sequential illumination from each point. As seen in Fig. 4, as the number of illumination beams increases, higher SNR is obtained at the center of the phantom. The temperature maps reveal that, four-port illumination gives the highest overall temperature increase in the whole phantom. The profiles in both - and -directions, clearly show that the temperature increase at the center of the phantom is the highest and more importantly above the noise level, only when four-port illumination is used [Fig. 4(b)]. Based on these results, we upgraded our PMI interface by adding four-port illumination and performed all the experiments with this configuration. Fig. 4Temperature maps simulated when: (a) one, (b) two, and (c) four lasers are used. The temperature profiles along the (d) -axis and (e) -axis. The noise level of the MRT sequence corresponds to 0.1°C (green highlighted). With only one laser illumination from the top of the phantom, the signals measured at the bottom half of the phantom is less than the noise level (red). When two-port illuminations are utilized, the measurements at the center of the phantom suffer from low SNR in the direction of illumination and mostly under the noise level in the orthogonal direction (blue). By increasing the illumination ports to four, this problem is solved and the SNR is increased in the overall phantom (green).  4.2.Phantom ExperimentsThree different phantoms are imaged to validate the ability of our technique in resolving inclusions with different depths, sizes, and contrasts. All experiments are realized using a mice-sized 25-mm diameter cylindrical agarose phantom mimicking a small animal. The optical absorption coefficient of this cylindrical phantom is set to . In the following experiments, different inclusions are implanted in this phantom in order to model tumors located at different depths, with various sizes and contrasts. The optical absorption coefficients of these inclusions are set according to the requirements of each experiment and are presented bellow. All the following reconstructions are made using a fine mesh consisting of 17,586 triangular elements connected at 8926 nodes. This mesh is generated using a maximum element size set to 0.25 mm which corresponds to a quarter of the size of the smallest inclusion to be reconstructed. 4.2.1.Depth phantomIn this experiment, we embedded three 2.5-mm diameter inclusions with the same absorption coefficient set to be four times higher than the absorption of the background. The inclusions are placed at 3, 7.5, and 12 mm under the surface of the phantom as shown in Fig. 5(a). Figure 5(b) shows the measured temperature map obtained using MRT. This map clearly shows the increase in temperature induced by the laser under the illumination sites. Note that the temperature does not increase similarly under the four lasers illumination sites due to different power output levels of each port as well as variation in spot size. In practical applications, the sample will not be perfectly circular and hence the spot size as well as the power density might be different at each illumination site. Due to this reason, we intentionally set the power and spot size for each port to be a bit different in these experiments in order to model a realistic case. As mentioned above in Sec. 4.1, PMI calibration measurement is first performed on a homogeneous phantom with known optical and thermal properties. This calibration measurement is utilized to find the differences at each illumination site and hence to figure out any mismatch between the experiment and the simulation parameters by minimizing the objective function [Eq. (1)]. Fig. 5(a) Axial MRI of the cylindrical phantom. The size and position of the inclusions are shown using black circles since no absorption contrast can be seen on the MRI image. All inclusions have the same contrast set to four times more absorbent than the background. (b) The temperature map at the end of the heating cycle. (c) The PMI absorption reconstructed map. (d) The absorption (red) and the temperature (blue) profiles across the three inclusions along the red arrow shown on (a).  Even without any calibration, Fig. 5(b) shows that the temperature map already reveals the position of the three inclusions prior to any reconstruction process. In fact, due to their higher optical absorption, the temperature increase is higher inside the inclusions. However, strong depth dependence is observed even though the three inclusions have identical size and contrast. Figure 5(d) shows clearly the observed depth dependence on the profiles (blue) calculated on the temperature map, along the red arrow shown in Fig. 5(a). In order to overcome the depth dependence, and obtain quantitative absorption maps, the PMI inverse problem is solved. Figure 5(c) shows the reconstructed absorption map when the measured MRT temperature map is used as the input for the solver. The three inclusions are resolved accurately and their absorption coefficients are recovered without any depth dependence. Indeed, the three reconstructed inclusions have an average error of 4% in diameter and only 7% in the recovered absorption coefficient. The obtained results are summarized in Table 1. Table 1Summary of PMI experiments performed with the depth phantom. All three objects located at different depths are recovered successfully with 4% error in size and 7% error in absorption coefficient.
4.2.2.Size phantomIn this case, four inclusions with different sizes are embedded deep into the 25-mm diameter cylindrical agarose phantom. The inclusions are 1.0-, 1.5-, 2.0-, and 3.0-mm diameter as shown in the cross section of the phantom shown in Fig. 6(a). In order to evaluate the ability of PMI in resolving inclusions with different sizes, we first chose the same optical absorption coefficient for the four inclusions and set it to be four times higher than the absorption of the background. Second, all four inclusions are placed at the same distance from the surface of the phantom. This ensures that each inclusion is at the same distance from the edge under the illumination in order to limit the depth dependence of the heating results. As mentioned above, the variation in the illumination beam at the four sides is corrected using the calibration procedure. Figure 6(b) shows the high-resolution absorption map obtained after solving the PMI inverse problem. The inclusions are recovered successfully on the reconstructed absorption map and their location shows a very good agreement with the cross section of the phantom shown in Fig. 6(a). Fig. 6(a) Axial MRI of the cylindrical phantom. The size and position of the inclusions are shown in black circles since no absorption contrast can be seen on the MRI image. All inclusions have the same contrast set to be four times more absorbent than the background. (b) The PMI absorption reconstructed map. (c) The absorption profiles across the four inclusions along the red lines shown on (a). 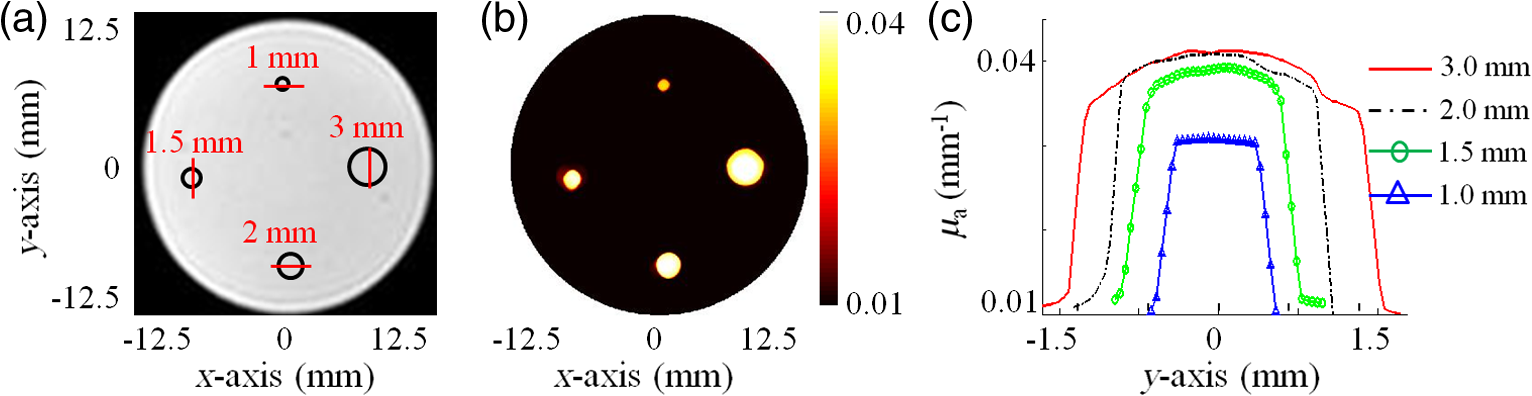 Figure 6(c) shows the four reconstructed absorption profiles taken along the red lines across each inclusion as shown in Fig. 6(a). The profiles show clearly the accuracy in recovering the sizes and contrasts of the inclusions. Table 2 summarizes the results of the experiments using the size phantom. Table 2Summary of PMI experiments performed with the size phantom. All four inclusions having different sizes are recovered successfully. Note that the error in the recovered absorption of the smallest inclusion (1 mm) is high since it has approximately the same size as the MRT pixel size (0.8 mm).
As seen from Table 2, the size of the largest two objects, inclusions 2.0 and 3.0 mm in diameter, are recovered perfectly, while their absorption coefficients are recovered with only 2% error. The error in the recovered size increased to 7% for the 1.5-mm diameter inclusion, while the error in the recovered absorption is only 5%. Although the size of the smallest inclusion, 1 mm in diameter, is recovered with only 10% error, the quantitative accuracy in the recovered absorption coefficient is the lowest where the error reached 32%. In fact, since the pixel size of the MRT image is set to 0.8 mm, the higher error in the recovered absorption coefficient of this 1 mm small inclusion is well expected. However, it is important to notice that although the size of this inclusion is very close to the MRT pixel size, it is accurately localized. This problem can be easily overcome by decreasing the size of the MRT pixel size but in expense of PMI temporal resolution and computation time. 4.2.3.Contrast resolutionIn this last experiment, four 5-mm diameter inclusions are embedded in the 25-mm cylindrical agarose phantom at the same distance, , under its surface. Taking the same inclusion size and distance under the surface for all inclusions reduces the size- and depth-dependence errors and allows us to focus on the ability of PMI in resolving inclusions with different contrasts. The optical absorption of the inclusions are set to be 2, 4, 6, and 8 times higher than the background as shown in Fig. 7(a). Fig. 7(a) Axial MRI of the cylindrical phantom. The size and position of the inclusions are delimited with the black circles since no absorption contrast can be seen on the MRI image. The inclusions are 2, 4, 6, and 8 times more absorbent than the background. (b) The PMI absorption reconstructed map. (c) A graphic showing the linear proportional relationship between the reconstructed and the real absorption coefficient.  Figure 7(b) shows the reconstructed absorption map which represents a high resolution PMI image of the phantom. This map shows a perfect agreement with the real absorption map presented in the cross section of the phantom [Fig. 7(a)]. The linear proportional relationship between the real and reconstructed contrasts of the four inclusions is shown in Fig. 7(c). The results of this experiment are summarized in Table 3. The sizes of all four objects are recovered with error. Similarly, the errors in the recovered absorption coefficients are all . Figure 7(c) shows the linear proportional relationship between the reconstructed and the real absorption coefficient demonstrating the high performance of PMI in recovering all four contrasts. Table 3 summarizes the results of the experiments using the contrast phantom. Table 3Summary of PMI experiments performed with the contrast phantom. All four objects with different contrasts are recovered successfully.
5.ConclusionIn summary, we experimentally validated the ability of PMI in providing high-resolution absorption images from internal temperature measurements. PMI combines the high sensitivity of optical imaging with the high-spatial resolution of MRI. We have previously introduced the PMI imaging technique and demonstrated its quantitative imaging ability with simulation studies.36 Here, we not only validate the superior performance of PMI with experimental studies but more importantly, present a four-port PMI system that can operate under ANSI limits ( for 808 nm). That is a critical milestone since our ultimate aim is to utilize this imaging technology for diagnostic purposes such as breast or head and neck cancer imaging. Meanwhile, immediate application of the PMI technology can be preclinical imaging. For this reason, in this study, we choose to use mice-sized 25-mm diameter agar phantoms mimicking small animals. Since we would like to keep the laser power level under ANSI limits, the challenging part of PMI is the sensitivity of the MRT. We found that the noise level of our MRT sequence is 0.1°C but we believe that it can be improved further by optimizing the MRT pulse sequence. Our experimental studies show that this noise level is enough to perform PMI imaging successfully. Note that the SNR of the MRT signal from each pixel is depth independent. Meanwhile, the key measurement in PMI is the local temperature increase. Since the photon density decreases drastically with depth in turbid media, PMI probing depth directly depends on the sensitivity of the MRT. Therefore, the key strength of PMI is that as long as the temperature change is detectable by MRT, the resolution is preserved at any depth. Supporting this idea, our experimental results showed that PMI can recover 3-mm diameter inclusions buried at different depths successfully with only 7% error in the recovered absorption coefficient. The size phantom experiment also revealed the superior performance of PMI. Since MRT can detect the 1-mm inclusion located 6-mm deep, PMI can recover it successfully with only 32% error in the absorption coefficient. Our experiments showed that we can probe 25-mm diameter sample successfully using four-port illumination. We believe that the probing depth can be increased using a higher number of illumination ports and ultimately developing a different scheme such as using a light guide surrounding the sample allowing an all-around homogeneous illumination. Meanwhile, we are working on improving the MRT parameters to increase its sensitivity and hence the probing depth of PMI. In addition, utilizing multiwavelength illumination, PMI can also reveal high-resolution images of tissue chromophores such as oxy- and deoxy-Hb, water, and fat. In fact, PMI can also be utilized with exogenous contrast agents such as gold nanoparticles and the Food and Drug Administration approved indocyanine green. Therefore, it will certainly make a high impact in the clinical management of cancer with the development of smart tumor targeting probes. For example, our preliminary simulation studies showed that this technique can be applied for breast cancer, if the breast is slightly compressed down to 4- or 5-cm thickness and illuminated from all around. We are currently performing extensive simulation and experimental studies to show the feasibility of this technique for breast cancer. AcknowledgmentsThis research was supported in part by the Fulbright grant awarded to Farouk Nouizi, National Institutes of Health Grant Nos. F311F31CA171745, 1R21CA191389, R21EB013387, R01EB008716, and P30CA062203. ReferencesA. S. R. Hebden and D. T. Delpy,
“Optical imaging in medicine: I. Experimental techniques,”
Phys. Med. Biol., 42 825
(1997). http://dx.doi.org/10.1088/0031-9155/42/5/007 PHMBA7 0031-9155 Google Scholar
S. R. Arridge and J. C. Hebden,
“Optical imaging in medicine: II. Modelling and reconstruction,”
Phys. Med. Biol., 42 841
–853
(1997). http://dx.doi.org/10.1088/0031-9155/42/5/008 Google Scholar
A. P. Gibson, J. C. Hebden and S. R. Arridge,
“Recent advances in diffuse optical imaging,”
Phys. Med. Biol., 50 R1
–43
(2005). http://dx.doi.org/10.1088/0031-9155/50/4/R01 Google Scholar
A. Gibson and H. Dehghani,
“Diffuse optical imaging,”
Philos. Trans. A Math. Phys. Eng. Sci., 367 3055
–3072
(2009). http://dx.doi.org/10.1098/rsta.2009.0080 Google Scholar
H. Dehghani et al.,
“Numerical modelling and image reconstruction in diffuse optical tomography,”
Philos. Trans. A Math. Phys. Eng. Sci., 367 3073
–3093
(2009). http://dx.doi.org/10.1098/rsta.2009.0090 Google Scholar
W. G. Egan and T. W. Hilgeman, Optical Properties of Inhomogeneous Materials, Academic, New York
(1979). Google Scholar
F. El-Ghussein et al.,
“Hybrid photomultiplier tube and photodiode parallel detection array for wideband optical spectroscopy of the breast guided by magnetic resonance imaging,”
J. Biomed. Opt., 19 011010
(2014). http://dx.doi.org/10.1117/1.JBO.19.1.011010 Google Scholar
S. Jiang et al.,
“Predicting breast tumor response to neoadjuvant chemotherapy with diffuse optical spectroscopic tomography prior to treatment,”
Clin. Cancer Res., 20 6006
–6015
(2014). http://dx.doi.org/10.1158/1078-0432.CCR-14-1415 Google Scholar
S. A. Carp et al.,
“Hemodynamic signature of breast cancer under fractional mammographic compression using a dynamic diffuse optical tomography system,”
Biomed. Opt. Express, 4 2911
–2924
(2013). http://dx.doi.org/10.1364/BOE.4.002911 Google Scholar
D. R. Busch et al.,
“Optical malignancy parameters for monitoring progression of breast cancer neoadjuvant chemotherapy,”
Biomed. Opt. Express, 4 105
–121
(2013). http://dx.doi.org/10.1364/BOE.4.000105 Google Scholar
S. Ueda et al.,
“Baseline tumor oxygen saturation correlates with a pathologic complete response in breast cancer patients undergoing neoadjuvant chemotherapy,”
Cancer Res., 72 4318
–4328
(2012). http://dx.doi.org/10.1158/0008-5472.CAN-12-0056 Google Scholar
M. G. Pakalniskis et al.,
“Tumor angiogenesis change estimated by using diffuse optical spectroscopic tomography: demonstrated correlation in women undergoing neoadjuvant chemotherapy for invasive breast cancer?,”
Radiology, 259 365
–374
(2011). http://dx.doi.org/10.1148/radiol.11100699 RADLAX 0033-8419 Google Scholar
H. Soliman et al.,
“Functional imaging using diffuse optical spectroscopy of neoadjuvant chemotherapy response in women with locally advanced breast cancer,”
Clin. Cancer Res., 16 2605
–2614
(2010). http://dx.doi.org/10.1158/1078-0432.CCR-09-1510 Google Scholar
R. Choe,
“Diffuse optical tomography & spectroscopy in breast cancer characterization & therapy monitoring at UPENN,”
Conf. Proc. IEEE Eng. Med. Biol. Soc., 2009 6335
–6337
(2009). http://dx.doi.org/10.1109/IEMBS.2009.5333164 Google Scholar
L. C. Enfield et al.,
“Optical tomography of breast cancer-monitoring response to primary medical therapy,”
Target Oncol., 4 219
–233
(2009). http://dx.doi.org/10.1007/s11523-009-0115-z Google Scholar
S. Jiang et al.,
“Evaluation of breast tumor response to neoadjuvant chemotherapy with tomographic diffuse optical spectroscopy: case studies of tumor region-of-interest changes,”
Radiology, 252 551
–560
(2009). http://dx.doi.org/10.1148/radiol.2522081202 RADLAX 0033-8419 Google Scholar
B. J. Tromberg et al.,
“Assessing the future of diffuse optical imaging technologies for breast cancer management,”
Med. Phys., 35 2443
–2451
(2008). http://dx.doi.org/10.1118/1.2919078 Google Scholar
C. Zhou et al.,
“Diffuse optical monitoring of blood flow and oxygenation in human breast cancer during early stages of neoadjuvant chemotherapy,”
J. Biomed. Opt., 12 051903
(2007). http://dx.doi.org/10.1117/1.2798595 Google Scholar
D. R. Leff et al.,
“Diffuse optical imaging of the healthy and diseased breast: a systematic review,”
Breast Cancer Res. Treat., 108 9
–22
(2008). http://dx.doi.org/10.1007/s10549-007-9582-z BCTRD6 Google Scholar
X. Wu et al.,
“Quantitative evaluation of atlas-based high-density diffuse optical tomography for imaging of the human visual cortex,”
Biomed. Opt. Express, 5 3882
–3900
(2014). http://dx.doi.org/10.1364/BOE.5.003882 Google Scholar
A. T. Eggebrecht et al.,
“Mapping distributed brain function and networks with diffuse optical tomography,”
Nat. Photonics, 8 448
–454
(2014). http://dx.doi.org/10.1038/nphoton.2014.107 Google Scholar
F. Nouizi et al.,
“Time-gated near-infrared spectroscopic imaging of brain activation: a simulation proof of concept,”
Proc. SPIE, 7896 78960L
(2011). http://dx.doi.org/10.1117/12.873706 PSISDG 0277-786X Google Scholar
S. L. Ferradal et al.,
“Atlas-based head modeling and spatial normalization for high-density diffuse optical tomography: in vivo validation against fMRI,”
NeuroImage, 85
(Pt 1), 117
–126
(2014). http://dx.doi.org/10.1016/j.neuroimage.2013.03.069 NEIMEF 1053-8119 Google Scholar
H. Singh et al.,
“Mapping cortical haemodynamics during neonatal seizures using diffuse optical tomography: a case study,”
Neuroimage Clin., 5 256
–265
(2014). http://dx.doi.org/10.1016/j.nicl.2014.06.012 Google Scholar
M. A. Yücel et al.,
“Validation of the hypercapnic calibrated fMRI method using DOT-fMRI fusion imaging,”
NeuroImage, 102
(2), 729
–735
(2014). http://dx.doi.org/10.1016/j.neuroimage.2014.08.052 NEIMEF 1053-8119 Google Scholar
S. R. Arridge and W. R. B. Lionheart,
“Non-uniqueness in diffusion-based optical tomography,”
Opt. Lett., 23 882
(1998). http://dx.doi.org/10.1364/OL.23.000882 OPLEDP 0146-9592 Google Scholar
S. R. Arridge,
“Optical tomography in medical imaging,”
Inverse Prob., 15 R41
(1999). http://dx.doi.org/10.1088/0266-5611/15/2/022 Google Scholar
D. W. Marquardt,
“An algorithm for least-squares estimation of nonlinear parameters,”
J. Soc. Ind. Appl. Math., 11
(2), 431
–441
(1963). http://dx.doi.org/10.1137/0111030 Google Scholar
P. K. Yalavarthy et al.,
“Weight-matrix structured regularization provides optimal generalized least-squares estimate in diffuse optical tomography,”
Med. Phys., 34 2085
–2098
(2007). http://dx.doi.org/10.1118/1.2733803 Google Scholar
E. J. Woo and J. K. Seo,
“Magnetic resonance electrical impedance tomography (MREIT) for high-resolution conductivity imaging,”
Physiol. Meas., 29 R1
–26
(2008). http://dx.doi.org/10.1088/0967-3334/29/10/R01 Google Scholar
M. Xu and L. V. Wang,
“Photoacoustic imaging in biomedicine,”
Rev. Sci. Instrum., 77 041101
(2006). http://dx.doi.org/10.1063/1.2195024 Google Scholar
H. Erkol, E. Aytac-Kipergil and M. B. Unlu,
“Photoacoustic radiation force on a microbubble,”
Phys. Rev. E Stat. Nonlinear Soft Matter Phys., 90 023001
(2014). http://dx.doi.org/10.1103/PhysRevE.90.023001 Google Scholar
P. Poulet, J. Chambron and R. Unterreiner,
“Quantitative photoacoustic spectroscopy applied to thermally thick samples,”
J. Appl. Phys., 51 1738
–1742
(1980). http://dx.doi.org/10.1063/1.327785 Google Scholar
M. Heijblom, W. Steenbergen and S. Manohar,
“Clinical photoacoustic breast imaging: the twente experience,”
Pulse, 6 42
–46
(2015). http://dx.doi.org/10.1109/MPUL.2015.2409102 PULSDB Google Scholar
D. A. Thayer et al.,
“Laser-induced photo-thermal magnetic imaging,”
Appl. Phys. Lett., 101 83703
(2012). http://dx.doi.org/10.1063/1.4742158 Google Scholar
Y. Lin et al.,
“Photo-magnetic imaging: resolving optical contrast at MRI resolution,”
Phys. Med. Biol., 58 3551
–3562
(2013). http://dx.doi.org/10.1088/0031-9155/58/11/3551 Google Scholar
S. Arridge,
“Photon-measurement density functions. Part I: analytical forms,”
Appl. Opt., 34 7395
–7409
(1999). http://dx.doi.org/10.1364/AO.34.007395 APOPAI 0003-6935 Google Scholar
M. Schweiger et al.,
“The finite element method for the propagation of light in scattering media: boundary and source conditions,”
Med. Phys., 22 1779
–1792
(1995). http://dx.doi.org/10.1118/1.597634 Google Scholar
E. H. Wissler,
“Pennes’ 1948 paper revisited,”
J. Appl. Physiol., 85 35
–41
(1998). Google Scholar
S. H. Diaz et al.,
“Modeling the thermal response of porcine cartilage to laser irradiation,”
IEEE J. Sel. Top. Quantum Electron., 7
(6), 944
–951
(2001). http://dx.doi.org/10.1109/2944.983298 Google Scholar
N. J. McDannold and F. A. Jolesz,
“Magnetic resonance image-guided thermal ablations,”
Top. Magn. Reson. Imaging, 11 191
–202
(2000). http://dx.doi.org/10.1097/00002142-200006000-00005 Google Scholar
A. Kickhefel et al.,
“Accuracy of real-time MR temperature mapping in the brain: a comparison of fast sequences,”
Phys. Med., 26 192
–201
(2010). http://dx.doi.org/10.1016/j.ejmp.2009.11.006 Google Scholar
V. Rieke and K. Butts Pauly,
“MR thermometry,”
J. Magn. Reson. Imaging, 27 376
–390
(2008). http://dx.doi.org/10.1002/jmri.21265 Google Scholar
S. Roujol et al.,
“Real-time MR-thermometry and dosimetry for interventional guidance on abdominal organs,”
Magn. Reson. Med., 63 1080
–1087
(2010). http://dx.doi.org/10.1002/mrm.22309 Google Scholar
J. Hebden, S. Arridge and D. Delpy,
“Optical imaging in medicine. I. Experimental techniques,”
Phys. Med. Biol., 42 825
–840
(1997). http://dx.doi.org/10.1088/0031-9155/42/5/007 Google Scholar
F. Nouizi et al.,
“Improvement of absorption and scattering discrimination by selection of sensitive points on temporal profile in diffuse optical tomography,”
Opt. Express, 19 12843
–12854
(2011). http://dx.doi.org/10.1364/OE.19.012843 Google Scholar
Y. Ishihara et al.,
“A precise and fast temperature mapping using water proton chemical shift,”
Magn. Reson. Med., 34 814
–823
(1995). http://dx.doi.org/10.1002/mrm.1910340606 Google Scholar
BiographyFarouk Nouizi received his PhD in optical imaging from the University of Strasbourg, France, in 2011. He developed a time-domain noncontact small animal fluorescence tomography system and implemented the dedicated image reconstruction algorithms. He was awarded a one-year scholarship by the Fulbright postdoctoral research program and joined the laboratory of Dr. Gulsen at the University of California, Irvine (UC Irvine) in 2012. Currently, he is working on developing cutting-edge technologies on both optical and nuclear imaging modalities. Alex Luk is a current PhD candidate in biooptical imaging in the EECS Department of UC Irvine. He has expertise on MRI and diffuse optical imaging systems. He built a prototype of the photomagnetic imaging (PMI) system supported by F31-NIH grant for animal and breast research under Dr. Gulsen at UC Irvine. Currently, he is working on in vivo PMI applications and MR sodium imaging at UC Irvine at the Center for Functional Onco-Imaging. Dave Thayer received his bachelor’s and master’s degrees in electrical engineering from Brigham Young University with a project titled “Imaging techniques and hardware for inhomogeneous MRI.” He then attended UC Irvine, obtaining his PhD in biomedical engineering with a project titled “PhotoMagnetic Imaging: A Novel Optical Imaging Modality” in 2011 and an MD in 2013. Subsequently, he completed a surgical internship at UC Irvine and is currently a radiology resident at Barnes-Jewish Hospital in St. Louis, Missouri, USA. Yuting Lin graduated with a PhD in medical physics from UC Irvine in 2009. From 2009 to 2013, she remained at UC Irvine as a researcher performing research on fluorescence tomography. She joined the Harvard Medical School Medical Physics Residency Program in 2013 and performed research under Dr. Harald Paganetti and Dr. Kathryn Held on the effect of gold nanoparticles on the dose distributions or proton, megavoltage, and kilovoltage beams. Seunghoon Ha held several industrial positions working for ISOL Technology, Republic of Korea, and Hitachi Medical Corp., Japan, until 2006 where he acquired practical experience in RF coil design and MR applications. He earned his PhD in E.E. from UC Irvine in 2010. He developed the combined MRI and nuclear molecular imaging for breast cancer. He subsequently worked as an electrical design engineer III at Philips Healthcare in USA. Gultekin Gulsen is an associate professor in the Departments of Radiological Sciences, Physics and Biomedical Engineering, and director of In Vivo Imaging Resource of the Chao Family Comprehensive Cancer Center at the University of California. He has been working on in vivo molecular optical imaging techniques for more than a decade. His main research area is multimodality imaging, particularly integrating diffuse optical tomography and anatomic imaging modalities such as MRI, x-ray CT, and ultrasound. |
|||||||||||||||||||||||||||||||||||||||||||||||||||||||||||||||||||||||||||||||||||||||||||||||||||


