|
|
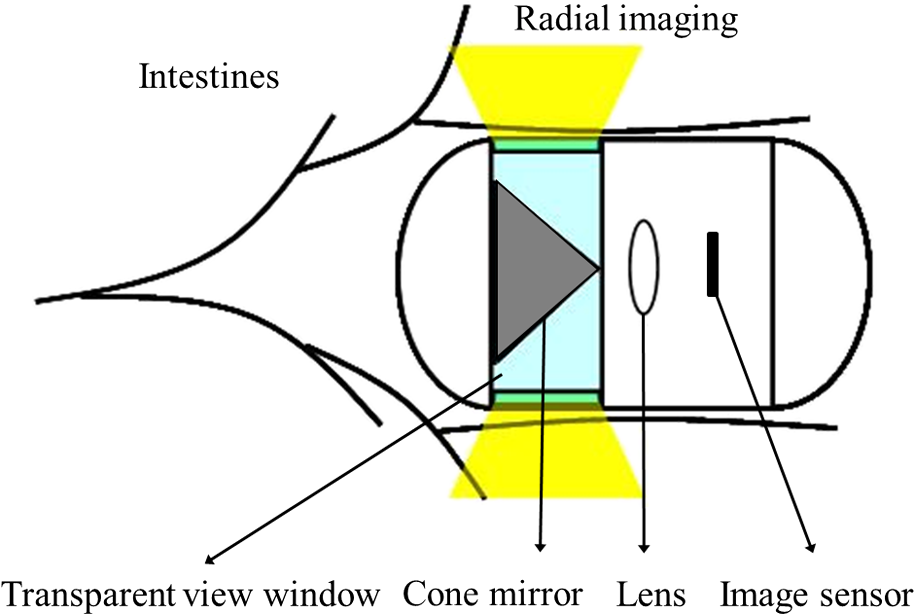
1.IntroductionBusy and stressful lives and complex dietary habits have increased the burden on the digestive system, thus rendering digestive system diseases the most typical disease of affluence. Capsule endoscopes developed in recent years are used to observe pathological changes in the digestive system. An illumination light source, optical camera, and image sensor are integrated to capture images in the human digestive system when peristalsis occurs and intestinal tract images are externally transmitted using radio transmission technology. The images are subsequently compared with those in a built-in database to assist doctors to precisely analyze and treat diseases.1,2 In biomedical imaging, information related to blood is typically used to determine the symptoms of digestive diseases; this is more important for gastrointestinal bleeding diagnosed by capsule endoscope.3–6 When bleeding is observed in images, software is used to calculate and evaluate the possibility of pathological changes in the digestive system. Researchers have actively studied the applications of biomedical imaging.7–9 Images captured using capsule endoscopes are used to identify the presence of blood, and the distribution of blood can be identified after calculating color information by using a special algorithm. However, color difference in images must be considered before calculations. Because color filters composed of red (R), green (G), and blue (B) spectra are installed on image sensors in cameras, the color information of images is influenced by these color filters, which hinders the expression of true colors, thereby causing color difference. Applying this color information in studies regarding blood identification might generate errors. Thus, color correction must be conducted in capsule endoscopes before performing physical examinations.10 First of all, the transfer function must be solved by experiments; captured images are then multiplied using transformation matrix to obtain the information of approximate standard colors. In this study, the color difference produced using a radial imaging capsule endoscope (RICE) was enhanced; the structure of RICE is shown in Fig. 1; it includes a cone mirror, a transparent view window, a lens, and an image sensor. Recently, the optical design of RICE including imaging and illumination systems has been achieved,11,12 and image registration and connection studies on gastrointestinal images captured during various times in animal experiments have been conducted in previous study.13 However, the color images have not been color corrected, causing distortion in the color information of color images. Thus, this study endeavored to address this problem, using color-correction algorithms to correct images and employing the International Commission on Illusion Delta E 2000 (CIEDE2000) color difference formula to compare the images before and after color correction.14 Finally, we applied this algorithm in a field-programmable gate array (FPGA) to realize real-time color correction, thereby providing a reference for the development of real-time color-correction chips. 2.Color Calibration in Radial Imaging Capsule EndoscopeCrucial factors causing color difference must be identified to enhance the color quality of images captured using RICE. To determine color distortion, the color information of color images must be compared with that of standard colors. The natural color system (NCS) is based on the six elementary color percepts of human vision; this color system can represent the real and natural color precisely and match the human vision. The experiment design involved using a spectrometer, endoscope, and RICE to capture the NCS color chart. The endoscope and the camera of RICE were of the same module; the only difference was that the RICE captures panoramic images by using a cone mirror and the endoscope captures images of objects placed directly in front of it.7 The color information measured by spectrometers was tristimulus values and the color information measured using the endoscopes and RICE was gray-scale values of R, G, and B. The color information obtained using the spectrometer was regarded as a standard value. Subsequently, we converted the R, G, and B gray-scale values captured by the endoscope and RICE into tristimulus values using transfer matrix,10 which were then compared with those obtained using the spectrometer. In addition, the color difference was calculated using the CIEDE2000 color-difference formula (Fig. 2). To compare the color gamut of the spectrometer, endoscope, and RICE, we measured the color charts of the NCS color circle, which comprised yellow (Y), red (R), blue (B), and green (G), containing 40 pieces of color information. Fig. 2The color information of the NCS color charts were obtained using a spectrometer, endoscope, and RICE, and were subsequently compared in terms of color gamut. The CIEDE2000 color difference was used to calculate the differences.  Because white-light light-emitting diodes (LEDs) were used in endoscope and RICE illumination system, CIE Standard Illuminant D65 and white-light LEDs were used as illumination system in order to measure color information. Figure 3 shows the color information of the NCS color circle measured using a spectrometer and endoscope. Figure 3(a) indicated that color charts illuminated by D65 exhibited small color gamut in color information measured using an endoscope, because the endoscope contained color filters, which exhibit R, G, and B spectral distributions different from those of the International Commission on Illumination 1931 (CIE 1931) standard colors. Therefore, colors were limited by color filters, generating different color gamut compared to the color gamut of spectrometer; from the 40 pieces of color information measured by endoscope and spectrometer, the color difference can be calculated by CIEDE 2000, and the resulting color difference was . Figure 3(b) shows the color gamut measured, which, illuminated by a D65 and white-light LED, due to the spectrum distribution, is different between these two light sources, and the D65 light is a standard light source, so it can express more color information. The color difference between the two light sources was (mean and standard deviation). Table 1 also shows other factors that can also cause color difference in RICE; the last column defined a formula that was used to understand what crucial factors caused color difference in RICE, and it means these crucial factors dominated the color difference issue. Before correcting the color image, the total color difference in RICE was . As mentioned before, the light source and color filters caused color difference in RICE; other factors can also cause color difference, like optics and electrical device. Optical system usually contains a lens; it is always designed with a wide wavelength range instead of a single wavelength, so the lens contains a color distortion issue. In our system, the color difference caused by optical lens was . For the image sensor, an analog-to-digital converter is needed to convert the electrical signal to digital signal; it causes some quantization error. In other words, the quantization error distorted the original color information; it also caused color difference in RICE, and the color difference was . Consequently, we found that color filters and light source were crucial factors causing color difference as shown in Fig. 4. As the endoscope and RICE used the same image sensor and light source, RICE would also yield color difference. In order to improve the color expression in our system, the color mapping algorithms were subsequently used to investigate how distorted colors are corrected into the correct color information. Fig. 3(a) Color gamut measured using a spectrometer and endoscope and illuminated by a D65. The endoscope’s color gamut is smaller than spectrometer because image sensors in endoscopes contained color filters, which limited the color information. (b) Color gamut measured, which is illuminated by a D65 and white-light LED. As the spectrum distribution is different between these two light sources, and the D65 light is a standard light source, it can express more color information. 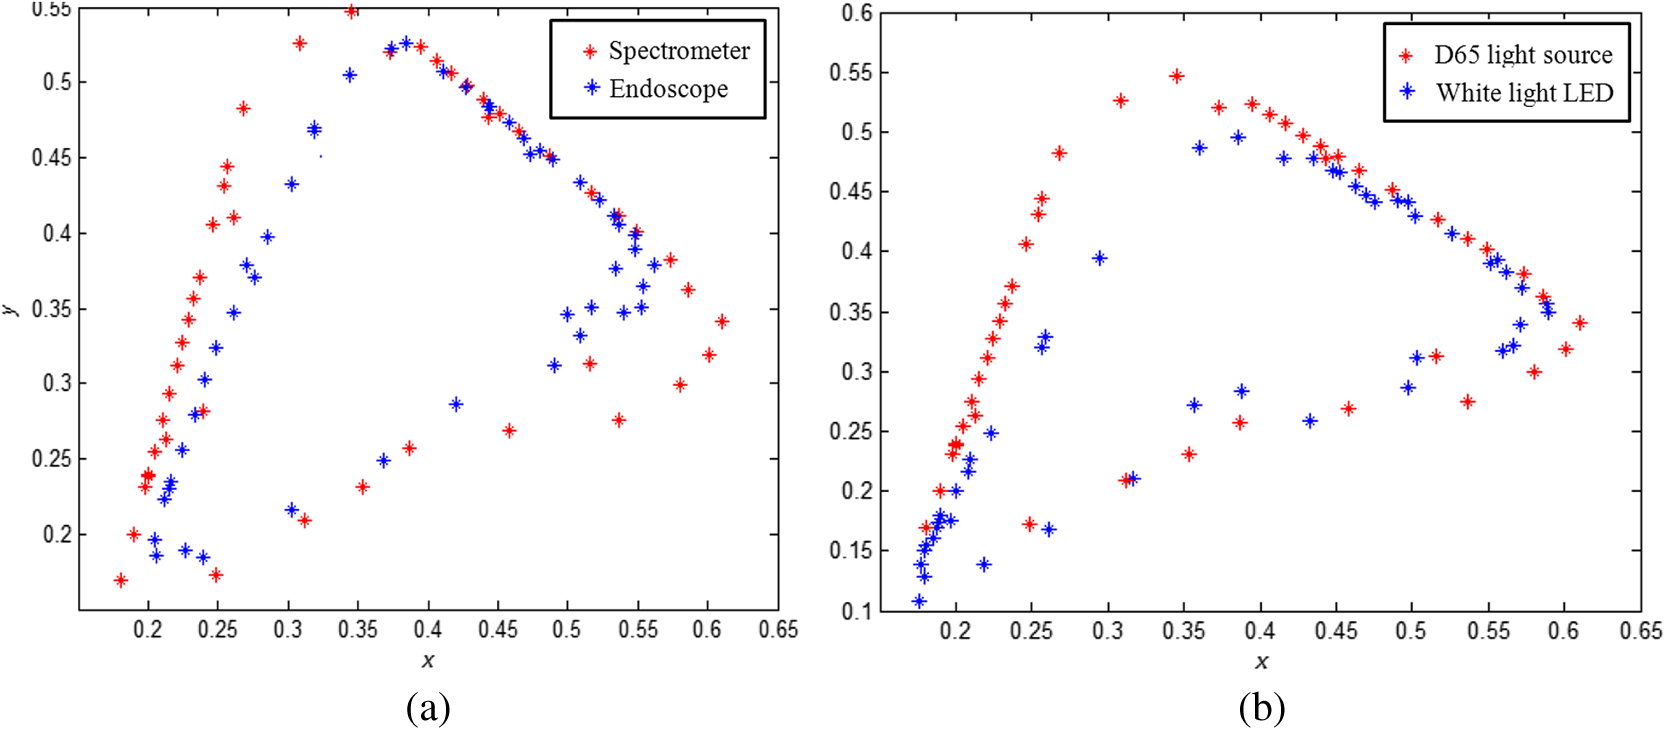 Fig. 4The color difference of RICE caused by the following factors: light source, color filter, optics and electronics. From the vector projection formula, we can know the percentage that each factor contributed to the system’s color difference.  Table 1Factors causing color difference in RICE.
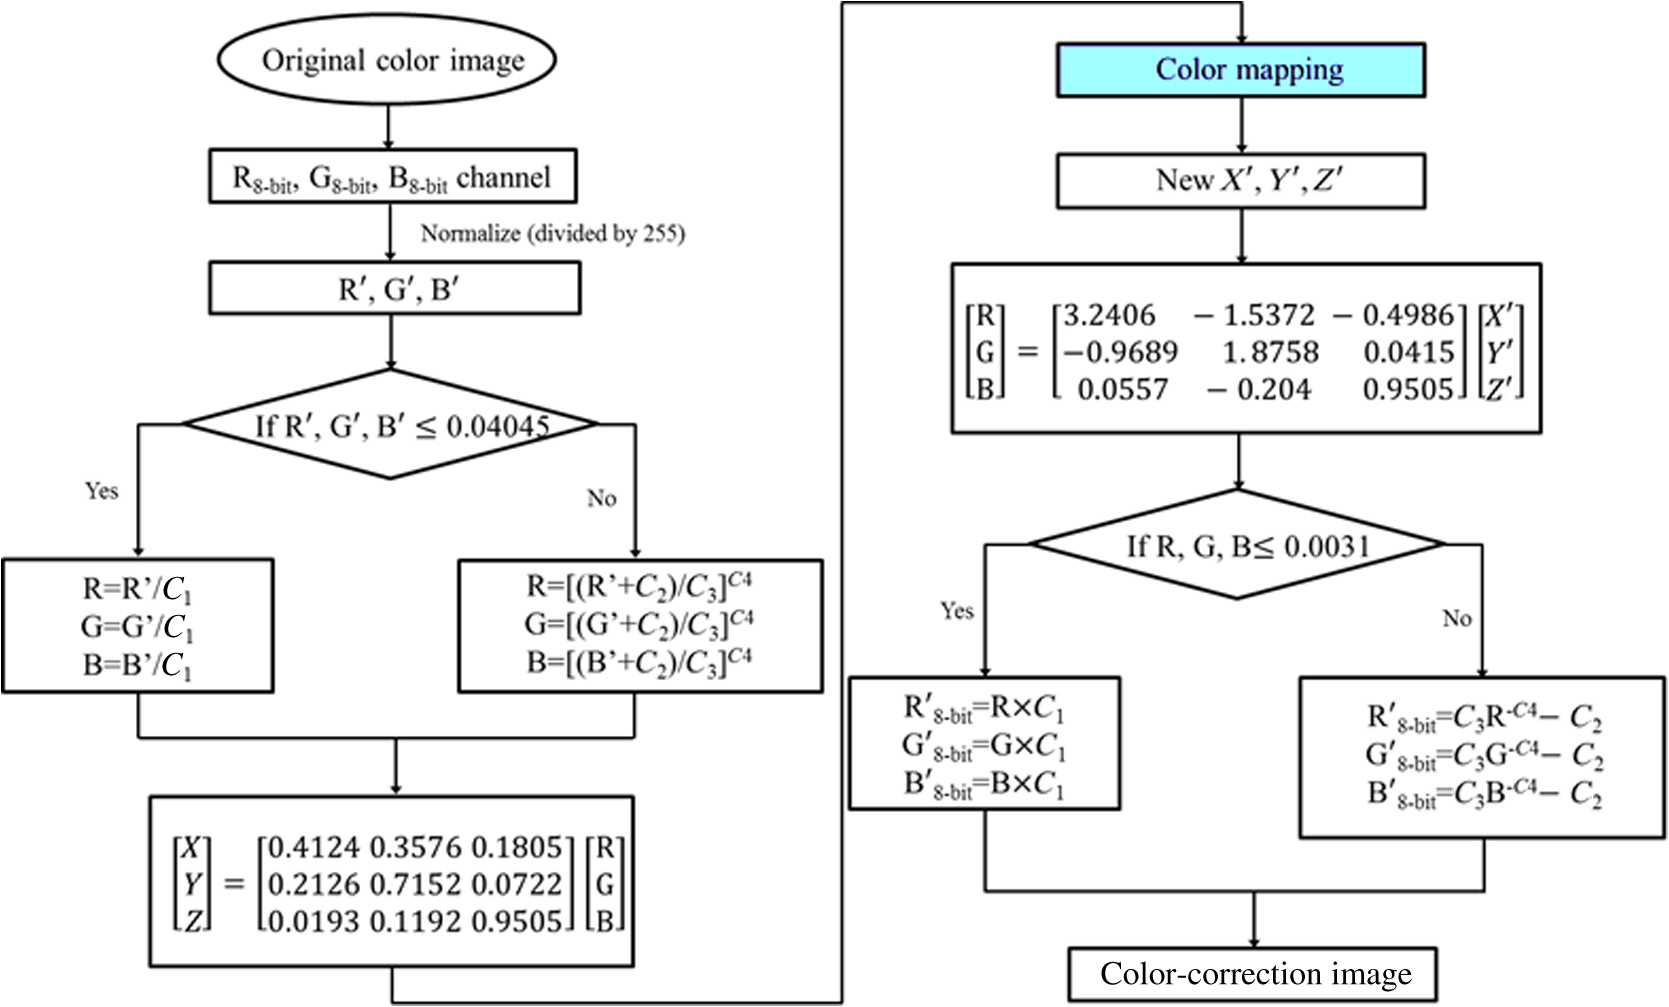
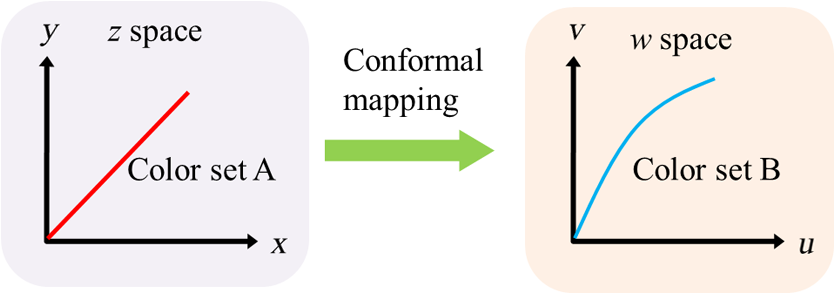
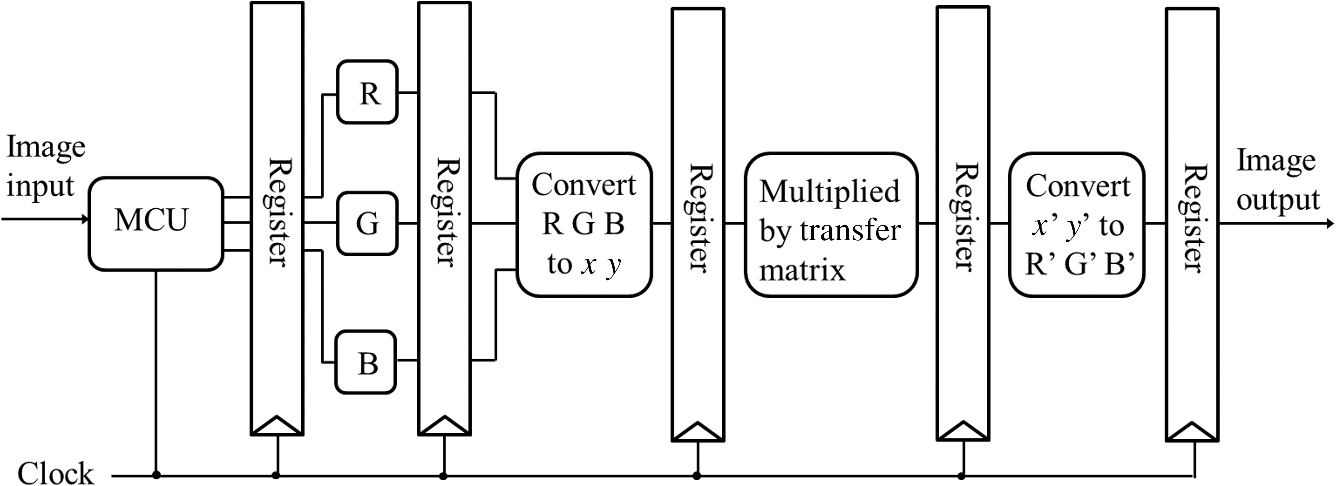
3.Methodology of Color CorrectionAs the color difference was calculated using tristimulus values and the color image information captured by the camera was the digital signals of R, G, and B gray-scale values, these digital signals must be converted to tristimulus values before calculating the color difference for color correction. Based on the standard definition of the standard RGB (sRGB) color space, because R, G, and B gray-scale values are influenced by gamma characteristics, gray-scale values must be linearly converted before R, G, and B gray-scale values can be converted to tristimulus values by using the sRGB transformation matrix.15 Figure 5 shows the conversion relationship between digital color information and tristimulus values; the most crucial color mapping approach is indicated with a blue block, where is 12.92, is 0.055, is 1.055, and is 2.4. The color-correction process is described below. 3.1.Polynomial Transform MethodThis study adopted polynomial transforms16 and conformal mapping17 to correct the distorted color images. Polynomial transform involves applying the method of least squares to obtain the optimal parameter solution as shown in Eq. (1);18 () represent reference colors, which are color information measured using a spectrometer; () represent color information measured using an endoscope or RICE. According to Sec. 2, the color information captured using the endoscope generated color difference because of the influences of color filters and LED; thus, a linear conversion relationship existed between () and (); () matrix is the transfer function we need to solve it by least squares method. In Eq. (2), means the pieces of color information existed, where () and () represent the th piece of color chart information measured by the spectrometer and RICE, respectively. To calculate the minimum value of this error, we performed differentiation to obtain the optimal parameter solution. The general solution is expressed in Eq. (2). 3.2.Conformal MappingAnother color-correction approach is conformal mapping, which is extended from the concept of complex variables. The complex number was divided into real part ( axis) and imaginary part ( axis). Subsequently, conformal mapping was used to map the space onto the new space (Fig. 6). Color set A is the color information of RICE, and color set B is the standard color information of the spectrometer. Thus, conformal mapping can be used to map color set A onto color set B. This approach applied a polynomial expansion method to map colors, as shown in Eq. (3); and , are complex constants. Equation (4) shows the example of a third-order equation, and Eq. (5) was obtained by substituting into Eq. (4). Then, and can be obtained by separately processing the real part and the imaginary part as shown in Eqs. (6) and (7). Because and on the space and and on the space were independent variables, the polynomial coefficients in the and directions were set as and . Subsequently, the method of least squares was applied to deduct the polynomial coefficient. Thus, the polynomial coefficients in the and directions are shown in Eqs. (8) and (9). Other than using MATLAB® in color correction, this study adopted the Cyclone III development board developed by Altera to attain the concept of hardware realization. In addition, incorporating peripheral sub-boards enabled the system to read image formats such as Phase Alternating Line, the National Television System Committee, and Super-Video. Subsequently, color correction was achieved using system internal logistic operation and then the Super-Video format output was transmitted. The design flowchart of the color mapping algorithm is shown in Fig. 7. Initially, the system converted data to an RGB color space; the RGB color space was converted into an color space and the linear conversion mentioned in Fig. 5. Then the was multiplied by transfer matrix, which had been determined by MATLAB®. Subsequently, the new color information was obtained and converted to RGB space, so the new color information was all the registers are needed in order to synchronize the data flow. Finally, a Nios II processor was used to transmit the to a monitor through a digital visual interface, thereby presenting the results of real-time color correction. 4.ExperimentsThe research framework primarily involved using RICE to capture color charts and compare the captured color information with that of a spectrometer. MATLAB® was also used to analyze and correct colors. The experiment flowchart is shown in Fig. 8. Because the interior of the small intestine is completely dark, to match the conditions of the experiment environment, the experiment was conducted in a dark room. When capturing the images of color charts, the LED inside RICE was the only illumination, and optic fibers positioned at an included angle of 45 deg were used to measure the color charts information to fulfill CIE specifications.19 A bright D65 light source is utilized as the illuminator for measuring the color information by spectrometer. Figure 9 shows how color charts were measured. After experimental setup, we began to capture color chart images and measure color information as shown on the upper-right corner of Fig. 8. The color information obtained after capturing color charts using RICE were (R1,G1,B1), (R2,G2,B2), (R3,G3,B3), and (R4,G4,B4). The R, G, and B values were acquired by averaging an area of 40 by 40 on color chart images, and 285 color charts images were captured to ensure that the sample size was sufficient. Concurrently, the spectrometer was used to obtain 285 sets of color tristimulus values. Thus, the R, G, and B information measured by RICE can be converted into tristimulus values by using the sRGB transformation matrix, thereby determining the conversion relationship between the spectrometer and RICE as shown on the lower-left corner of Fig. 8. To test whether this transformation matrix can be applied in an actual situation, an in vivo experiment was used to test the feasibility of color correction. A two-month-old pig cultivated in dust-free rooms at Animal Technology Institute Taiwan was used in the experiment. The institutional body was approved by National Taiwan University Hospital before this animal experiment. Professional surgeons dissected the abdominal sections of the pig, pulled the duodenum out, and placed the RICE into the duodenum. To enable RICE to move forward using the natural peristalsis of pig intestine, the doctors conducted first aid when necessary to keep the pig alive. Fig. 8Experiment flowchart. Color charts information was measured using RICE and spectrometer under the same environmental conditions. Subsequently, the RICE color image information and color coordinate information measured by the spectrometer were stored in computers. Color correction can be realized in the clinical animal experiment after the transformation matrix was obtained using the color-correction algorithm. 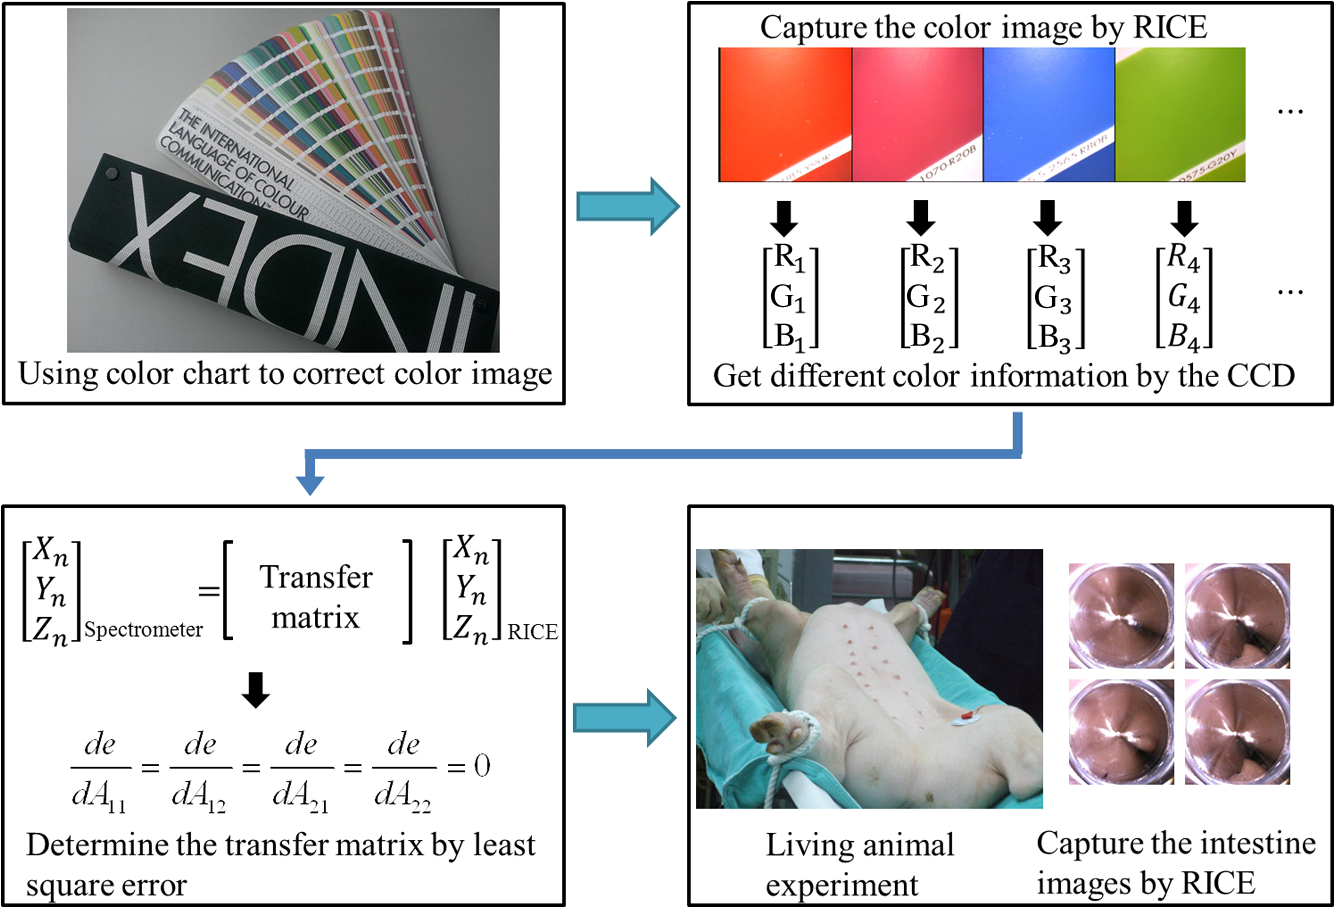 Fig. 9The setting of the RICE and spectrometer when measuring color information: optic fibers were placed at an included angle of 45 deg to measure the color information. RICE was placed flat above color charts to capture the color charts and measure the color information simultaneously.  Figure 10 shows the duodenum images; 1588 images were captured when the RICE moved in the duodenum; however, only eight images are displayed in this figure. The RICE images were warped images, and unwrapped images can be obtained using the conversion equation for converting polar coordinates into Cartesian coordinates.13 Before color correction, we considered to stitch all the images or to correct every color image before stitching images. If all the images were to be multiplied by the transformation matrix for color correction, the corrected color images would be slightly different from the original color images, which would result in minor errors during image registration. In addition, if each image must be color corrected, the computing time would be extremely lengthy, thus hindering the use of an embedded system to perform real-time color correction. To solve this problem, the captured images were stitched in advance before performing color correction. Figure 11 presents the stitched images based on the Pearson correlation coefficient.13 5.Color Correction Results and Embedded System ImplementationBefore color correction, the color gamut that the RICE and spectrometer can express must be compared. Figure 12(a) shows the color gamut of RICE and spectrometer after 285 color charts were measured; in this figure, the reference represents the color charts information measured using the spectrometer. Because the color filter on the image sensor of RICE limited the expression of color information, the color gamut was apparently compressed. Thus, the color difference between the color information of RICE and the reference was 21.45. If the chromaticity coordinates of the NCS color chart measured by RICE are restored to the NCS color space, we identified that the color information expressed by the shifted internally. Figure 12(b) shows that the color gamut were obviously compressed, yielding no true colors. Therefore, this study suggested two approaches, polynomial transform and conformal mapping, to correct colors and applied CIEDE2000 to evaluate the corrected color difference. Table 2 presents the relationship between the color correction order number and color difference. When the seventh- and eighth-order color corrections were conducted, color difference demonstrated saturation. By using the eighth-order equation in color correction, the polynomial transform enhanced the color difference to 1.53 and conformal mapping enhanced the color difference to 1.32. Equation (10) was used to quantify the improvement efficiency of color difference obtained from various orders of color corrections. The original color difference was 21.45, so the optimal improvement efficiencies of color correction achieved by polynomial transform and conformal mapping were 92.8 and 93.8% by using the eighth-order equation in color correction, respectively. Figure 13 shows the relationship between orders and color difference when the two color-correction approaches were applied in computing. The order of color correction reached a critical point at , and the color difference of RICE images was . When the order of color correction was , the color correction effect of polynomial transform was superior to that of conformal mapping. However, when the order of color correction was , the color correction effect of conformal mapping was superior to that of polynomial transform. Consequently, this characteristic can be applied in determining which approach must be adopted in color correction. When the system requires low color difference, conformal mapping can be used. When the system requirement is lenient regarding color difference, polynomial transform can be used, which has a shorter operation time than that of conformal mapping and easily achieves real-time color correction. On the other hand, the color difference is by using conformal mapping with eighth-order equation; this is very meaningful because the color difference is imperceptible for human eye when it is .19 Figure 14 displays the color gamut after color correction using eighth-order polynomial transform and conformal mapping. The blue stars represent the color gamut measured using the spectrometer and the red stars represent the RICE color gamut after color correction. After color correction using the two algorithms, the color information was not overly centralized in certain areas compared with that obtained before color correction. In addition, the color gamut of RICE was similar to that obtained by the spectrometer, suggesting that the expressed color information was richer after RICE images were color corrected and the disadvantages of the color information restricted by color filters were effectively improved. Fig. 12The RICE and spectrometer were used to simultaneously measure 285 color charts. (a) The color gamut of RICE and spectrometer showed that the color rendering indices were limited when compared with the color information measured by the spectrometer. (b) After measuring the NCS color circle using RICE, the obtained color information was reduced to the NCS color space. The black dots are concentrating toward the center, indicating that the color gamut obtained by RICE was compressed. 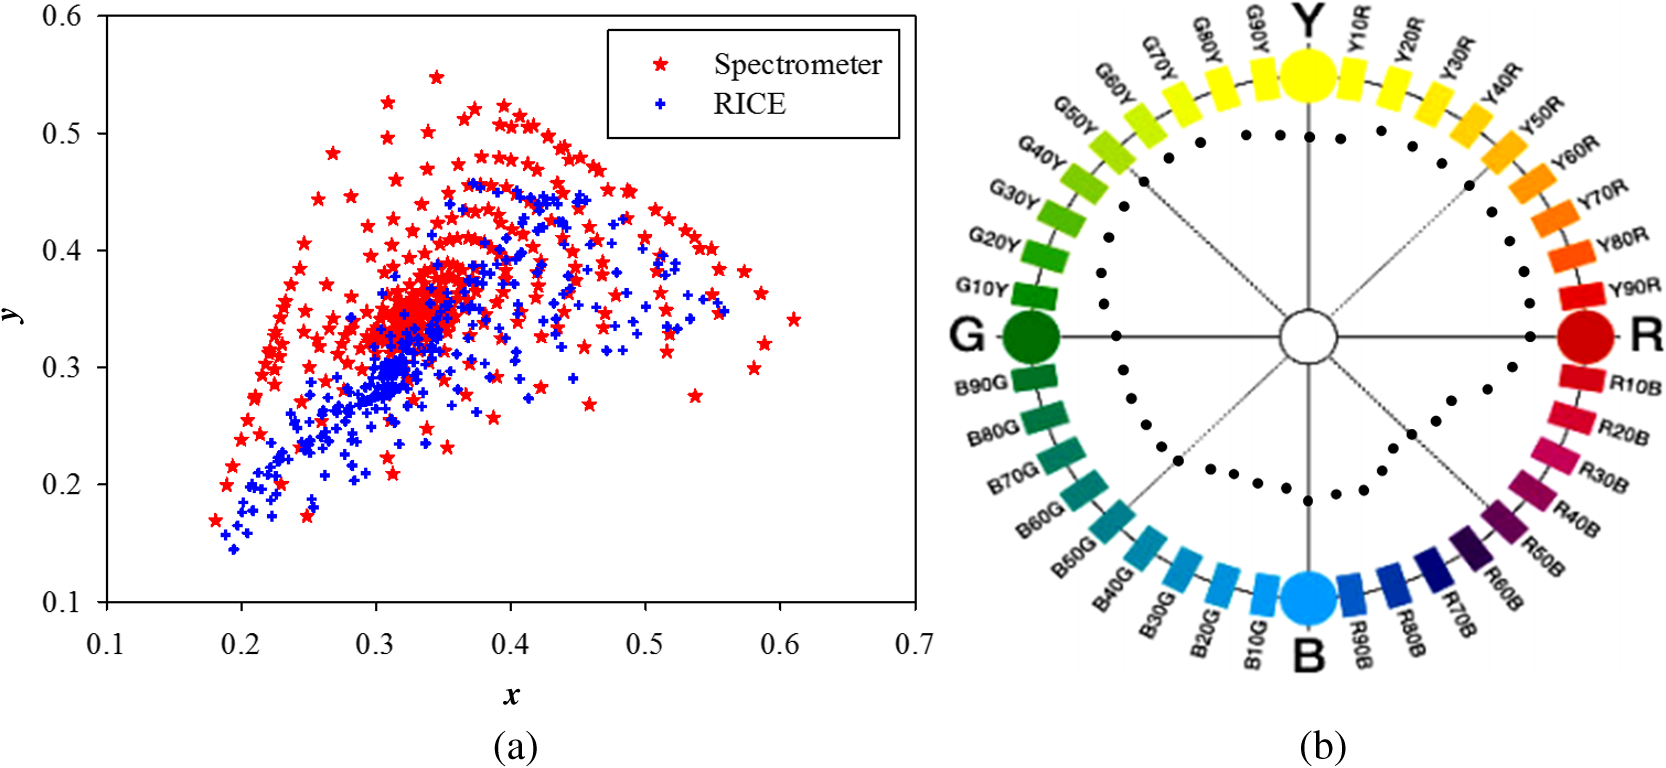 Table 2Comparison of different orders of color correction obtained using two color correction algorithms and improvement efficiency in color difference.
Fig. 13The relationship graph of the order of color correction and color difference shows that when the order of color correction is at (a critical point), the color difference of RICE images is .  Fig. 14The color gamut obtained after realizing color correction using (a) polynomial transform and (b) conformal mapping. The blue stars represent the color gamut measured by the spectrometer, and the red stars represent the color gamut obtained by RICE after color correction. These are the results of color correction obtained using an eighth-order equation. 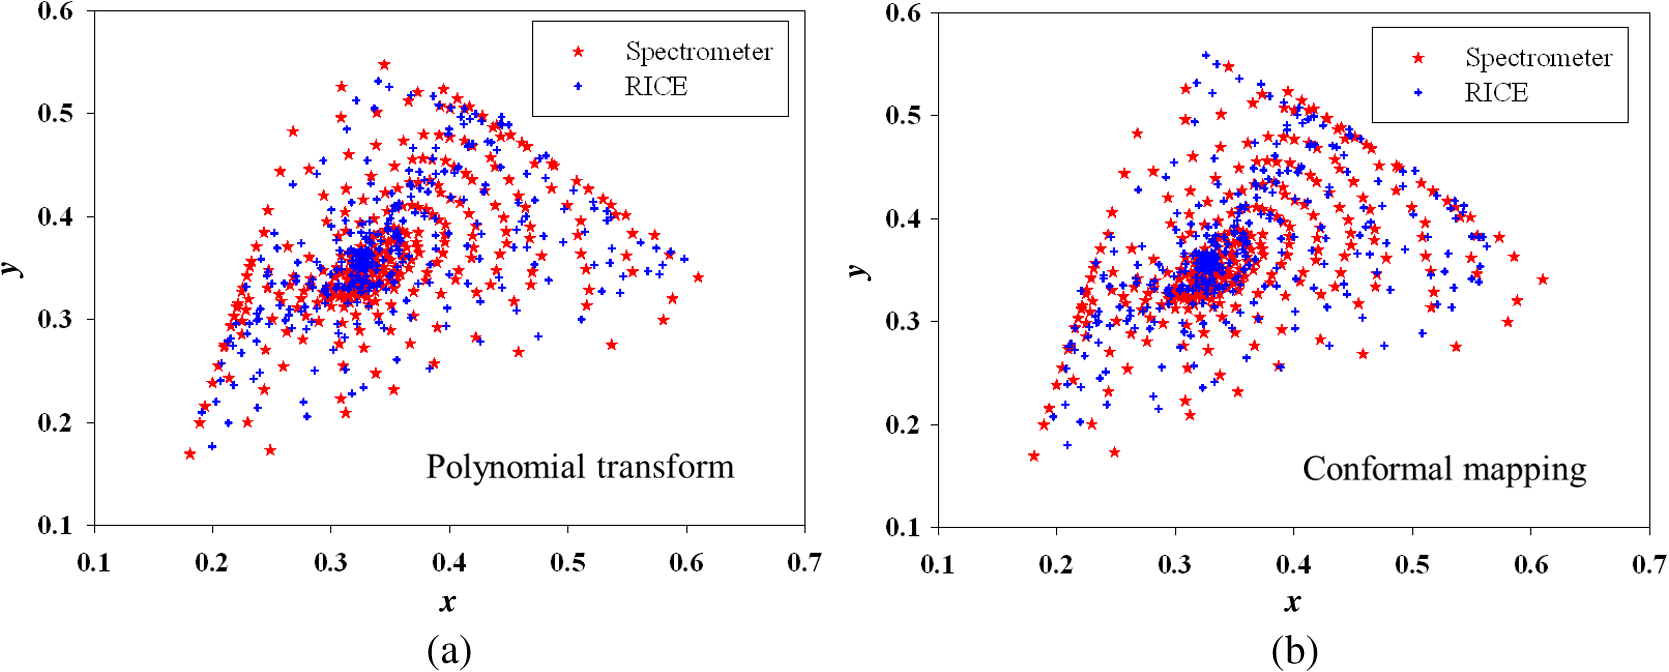 After confirming that both polynomial transform and conformal mapping can effectively correct color information, we directly applied this algorithm on real images to observe the differences between images before and after correction (Fig. 15). An eighth-order equation was applied, and the results indicated that apparent differences existed between colors before and after color correction. Before color correction, the color of the image was close to purple [Fig. 15(a)]; the color was close to skin color after color correction [Figs. 15(b) and 15(c)]. However, the duodenum images did not exhibit great differences after color correction by using polynomial transform and conformal mapping, and these results corresponded with the results shown in Table 2. When an eighth-order equation was applied in color correction, similar improvement efficiencies of color difference were observed. Fig. 15An image of a duodenum: (a) before color correction, (b) after color correction using polynomial transform, and (c) after color correction using conformal mapping. 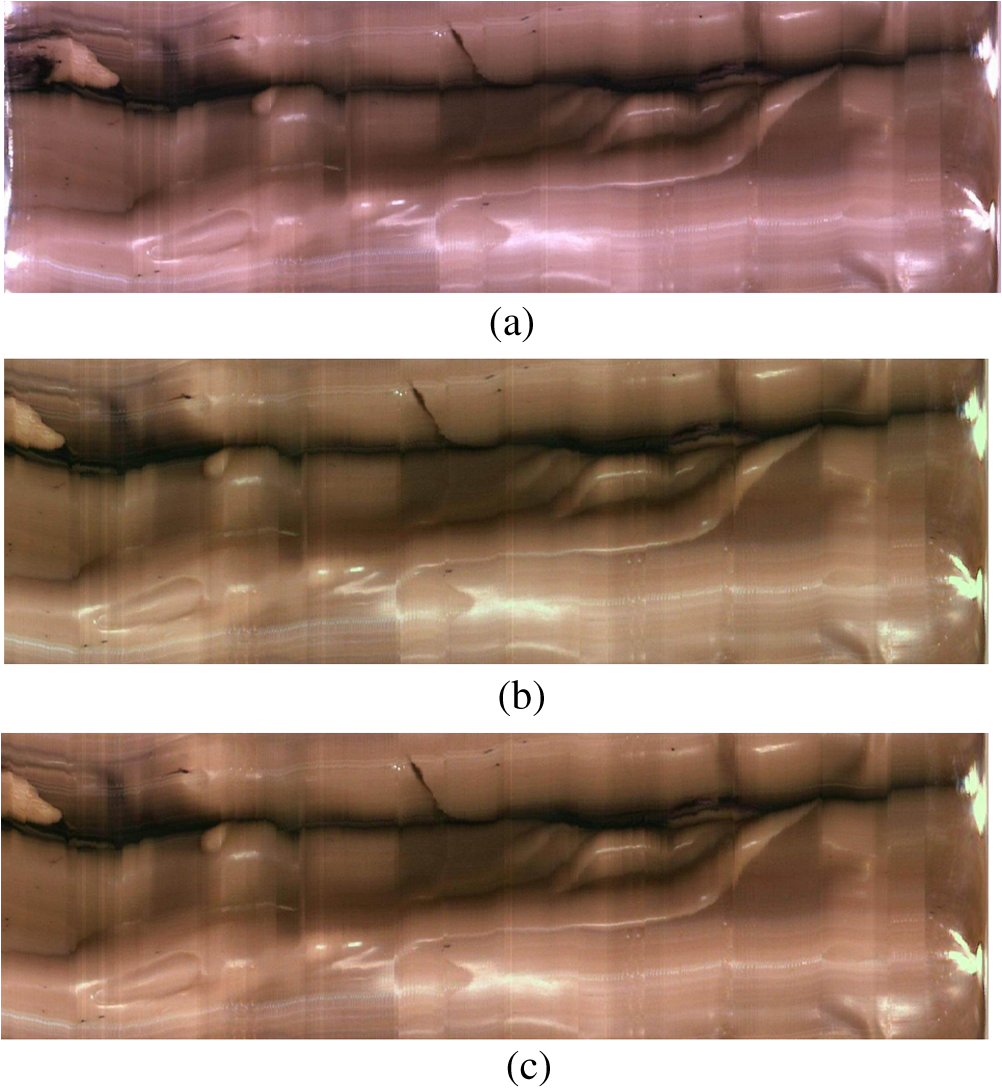 In order to understand how the primary colors R, G, and B are changed after color calibration, we analyze the intensity of R, G, and B in the original stitched image [Fig. 15(a)] and color-calibrated image [Fig. 15(c)]. Figure 16 shows the results. The mean ratios of R to G () and R to B () in the image before color calibration are and , respectively. However, the mean ratios of R to G () and R to B () increase to and in the color-calibrated image, respectively. It is obvious that the intensity of R becomes stronger than the intensity of G and B after color calibration. This is very useful for blood detection if the intestinal images have a bleeding region, thus increasing the contrast of interesting area. Fig. 16The averages of the ratio of R to G and R to B in the image before color calibration are and , respectively. However, the averages of the ratio of R to G and R to B increase to and in the color-calibrated image, respectively.  To realize the concept of an embedded system, we implement the aforementioned color-correction algorithms to the FPGA development board and applied ModelSim to test the correctness of the computation results. In addition, to realize real-time color correction, a third-order polynomial transform was used. Subsequently, after color correction was realized using ModelSim and MATLAB® the errors were observed by comparing the results. Table 3 shows the errors of using different software for color correction, and only three pieces of color information were displayed. The R, G, and B values of the first piece of color information before color correction were 118, 128, and 108 (got from the raw data). The values of the color after color correction using MATLAB® by the polynomial transform were 105, 136, and 98, and those after color correction using ModelSim were 102, 133, and 98. Therefore, computation errors were generated in the other two pieces of color information because different computing software was used, and quantization errors generally existed between digital and analog conversion. An FPGA is the logic design of digital circuits; thus, it uses the digital computing method, which contrasts with the analog computation used in MATLAB®. Because digital computing methods do not compute floating-point numbers, the computing results of floating-point numbers can be rendered after multiplying numeric values by the significand. The precision level and computation time increased as the decimal significand increased and vice versa. Currently, in ModelSim, 8-bit significand was applied in computing floating-point numbers, and the mean color difference of 30 pieces of color information between the digital and analog computing methods was . Figure 17 shows the errors that have converted the R, G, and B values to the colorimetric values. Although the corrected colors are slightly different between MATLAB® and ModelSim, this can be solved by increasing the length of data to express the floating-point numbers. Table 3Differences of color correction realized using MATLAB® and ModelSim.
6.Conclusions and DiscussionsIn this study, under a D65 light source, we simultaneously captured the same color charts by using a RICE and spectrometer. The color gamut clearly showed that the color expression of RICE was compressed because of the presence of color filters on the image sensor in RICE. The color filter limited color expression and thereby caused color difference. Because the light source of RICE also influences color gamut, we measured the LED in RICE using the spectrometer and found that considerable differences existed between the LED and D65 spectra, which also resulted in color difference. Thus, the color information captured by RICE must be corrected to attain accurate color information. Therefore, this study proposed two color-correction algorithms: polynomial transform and conformal mapping. The initial color difference of can be reduced to and using polynomial transform and conformal mapping, yielding optimal improvement efficiencies of 92.8 and 93.8%, respectively. Figure 13 shows the applicable algorithms and the order of color correction for attaining ideal color difference, which can be used as color-correction references for the RICE system. To facilitate the development of system chips, color-correction algorithms were written using Verilog syntax and were recorded on the FPGA development board to realize the concept of an embedded system. Subsequently, ModelSim was employed to simulate the results of color correction. The ModelSim results were compared with the MATLAB® simulation results, demonstrating a mean color difference of . Although this study focused on color correction when using RICE, the applications of the algorithms are not limited to RICE. The proposed color-correction methods can be extended to endoscopes or camera modules. In addition, regarding algorithm development, because the color of the interior of the human intestine is similar to the color of skin or blood, additional red and skin-hued color charts can be captured to increase the weighting of color correction. This can further decrease color difference and increase the accuracy of blood identification. Regarding hardware realization, we applied the third-order equation in real-time color correction, but achieved unsatisfactory results. Thus, in future, the pipeline framework can be applied to enhance the computation speed, and the equation order number in the algorithms can be increased to minimize color difference and enhance the precision level of color images. AcknowledgmentsThis paper was particularly supported by the Aim for the Top University Program of the National Chiao-Tung University, the Ministry of Education of Taiwan, the Ministry of Science and Technology of Taiwan (NSC 102-2220-E-009-016), and the Industrial Technology Research Institute. The authors also want to thank them for providing experimental assistance and related information. ReferencesH. H. Hopkins and N. S. Kapany,
“A flexible fiberscope, using static scanning,”
Nature, 173
(4392), 39
–41
(1954). http://dx.doi.org/10.1038/173039b0 Google Scholar
G. Iddan et al.,
“Wireless capsule endoscopy,”
Nature, 405
(6785), 417
–418
(2000). http://dx.doi.org/10.1038/35013140 Google Scholar
D. Gunjan et al.,
“Small bowel bleeding: a comprehensive review,”
Gastroenterol. Rep., 2
(4), 262
–275
(2014). http://dx.doi.org/10.1093/gastro/gou025 Google Scholar
C. Ell and A. May,
“Mid-gastrointestinal bleeding: capsule endoscopy and push-and-pull enteroscopy,”
Endoscopy, 38
(1), 73
–75
(2006). http://dx.doi.org/10.1055/s-2005-921131 ENDCAM Google Scholar
B. L. Zhang, C. X. Chen and Y. M. Li,
“Capsule endoscopy examination identifies different leading causes of obscure gastrointestinal bleeding in patients of different ages,”
Turk. J. Gastroenterol., 23
(3), 220
–225
(2012). Google Scholar
Z. Liao et al.,
“Indications and detection, completion, and retention rates of small-bowel capsule endoscopy: a systematic review,”
Gastrointest. Endosc., 71
(2), 280
–286
(2010). http://dx.doi.org/10.1016/j.gie.2009.09.031 Google Scholar
L. Baopu and M. Q. H. Meng,
“Computer-aided detection of bleeding regions for capsule endoscopy images,”
IEEE Trans. Biomed. Eng., 56
(4), 1032
–1039
(2009). http://dx.doi.org/10.1109/TBME.2008.2010526 IEBEAX 0018-9294 Google Scholar
H. Daryanavard, G. Karimian and S. M. R. Shahshahani,
“A new IC designed inside capsule endoscope for detection of bleeding region,”
in Iranian Conf. of Biomedical Engineering,
1
–4
(2010). Google Scholar
L. Phooi Yee and P. L. Correia,
“Detection of bleeding patterns in WCE video using multiple features,”
in 29th Annual Int. Conf. of the IEEE Engineering in Medicine and Biology Society,
5601
–5604
(2007). Google Scholar
M. Luckiesh, Visual Illusions: Their Causes, Characteristics and Applications, Kessinger Publishing, New York
(1922). Google Scholar
M. Ou-Yang and W. D. Jeng,
“Design and analysis of radial imaging capsule endoscope (RICE) system,”
Opt. Express, 19
(5), 4369
–4383
(2011). http://dx.doi.org/10.1364/OE.19.004369 OPEXFF 1094-4087 Google Scholar
M. Ou-Yang and W.-D. Jeng,
“Improving the uniformity of luminous system in radial imaging capsule endoscope system,”
Opt. Eng., 52
(2), 023003
(2013). http://dx.doi.org/10.1117/1.OE.52.2.023003 Google Scholar
M. Ou-Yang et al.,
“Image stitching and reconstructing image of intestines captured using radial imaging capsule endoscope (RICE),”
Opt. Eng., 51
(5), 057004
(2012). http://dx.doi.org/10.1117/1.OE.51.5.057004 Google Scholar
G. Sharma, W. Wu and E. N. Dalal,
“The CIEDE2000 color-difference formula: implementation notes, supplementary test data, and mathematical observations,”
Color Res. Appl., 30
(1), 21
–30
(2005). http://dx.doi.org/10.1002/col.20070 Google Scholar
P. Bodrogi et al.,
“On the use of the sRGB colour space: the ‘Gamma’ problem,”
Displays, 23
(4), 165
–170
(2002). http://dx.doi.org/10.1016/S0141-9382(02)00034-3 DISPDP 0141-9382 Google Scholar
H. Wannous et al.,
“Improving color correction across camera and illumination changes by contextual sample selection,”
J. Electron. Imaging, 21
(2), 023015
(2012). http://dx.doi.org/10.1117/1.JEI.21.2.023015 JEIME5 1017-9909 Google Scholar
J. W. Brown and R. V. Churchill, Complex Variables and Applications, McGraw-Hill, New York
(2009). Google Scholar
T. Johnson,
“Methods for characterizing colour scanners and digital cameras,”
Displays, 16
(4), 183
–191
(1996). http://dx.doi.org/10.1016/0141-9382(96)01012-8 DISPDP 0141-9382 Google Scholar
Colorimetry, Vienna, Austria
(2004). Google Scholar
BiographyMang Ou-Yang received his BS degree in control engineering in 1991 and his MS and PhD degrees in electro-optical engineering in 1993 and 1998 from National Chiao-Tung University, Hsinchu, Taiwan. His research interests are related to optoelectronics industrial instrumentation development, including biomedical optics, microthermal sensors, readout electronics, and projection display technology. Wei-De Jeng received his BS degree from the Department of Electrical Engineering, National Taiwan Ocean University, Taiwan, in 2008 and his MS degree from the Department of Optics and Photonics Engineering, National Central University, Taiwan, in 2010. He is currently studying toward his PhD at National Chiao-Tung University. His research interest focuses on the biomedical field. Chien-Cheng Lai is an engineer at the LIYO-Machinery Company Limited. He received his MS degree from the Institute of Electrical Control Engineering, National Chiao-Tung University, in 2011. His current research interests include image processing and color science. Hsien-Ming Wu received his master’s degree in chemistry in 1971 and his PhD in chemical engineering from Tsing-Hua University, Taiwan, in 1986. From 1995 to 2001, his major research focus was on the conductive polymer, OLED, and MEMS. Until 2005, his research focus was on biomedical instruments, especially on the capsule endoscope and digital x-ray, DR and CR sensors. Jyh-Hung Lin was an assistant research fellow in the Division of Biotechnology, Animal Technology Institute Taiwan. He received his MS degree from the Department of Veterinary Medicine, National Chung Hsing University and his PhD from the School of Veterinary Medicine, National Taiwan University. His current research interest is swine health status. |
|||||||||||||||||||||||||||||||||||||||||||||||||||||||||||||||||||||||||||||