|
|
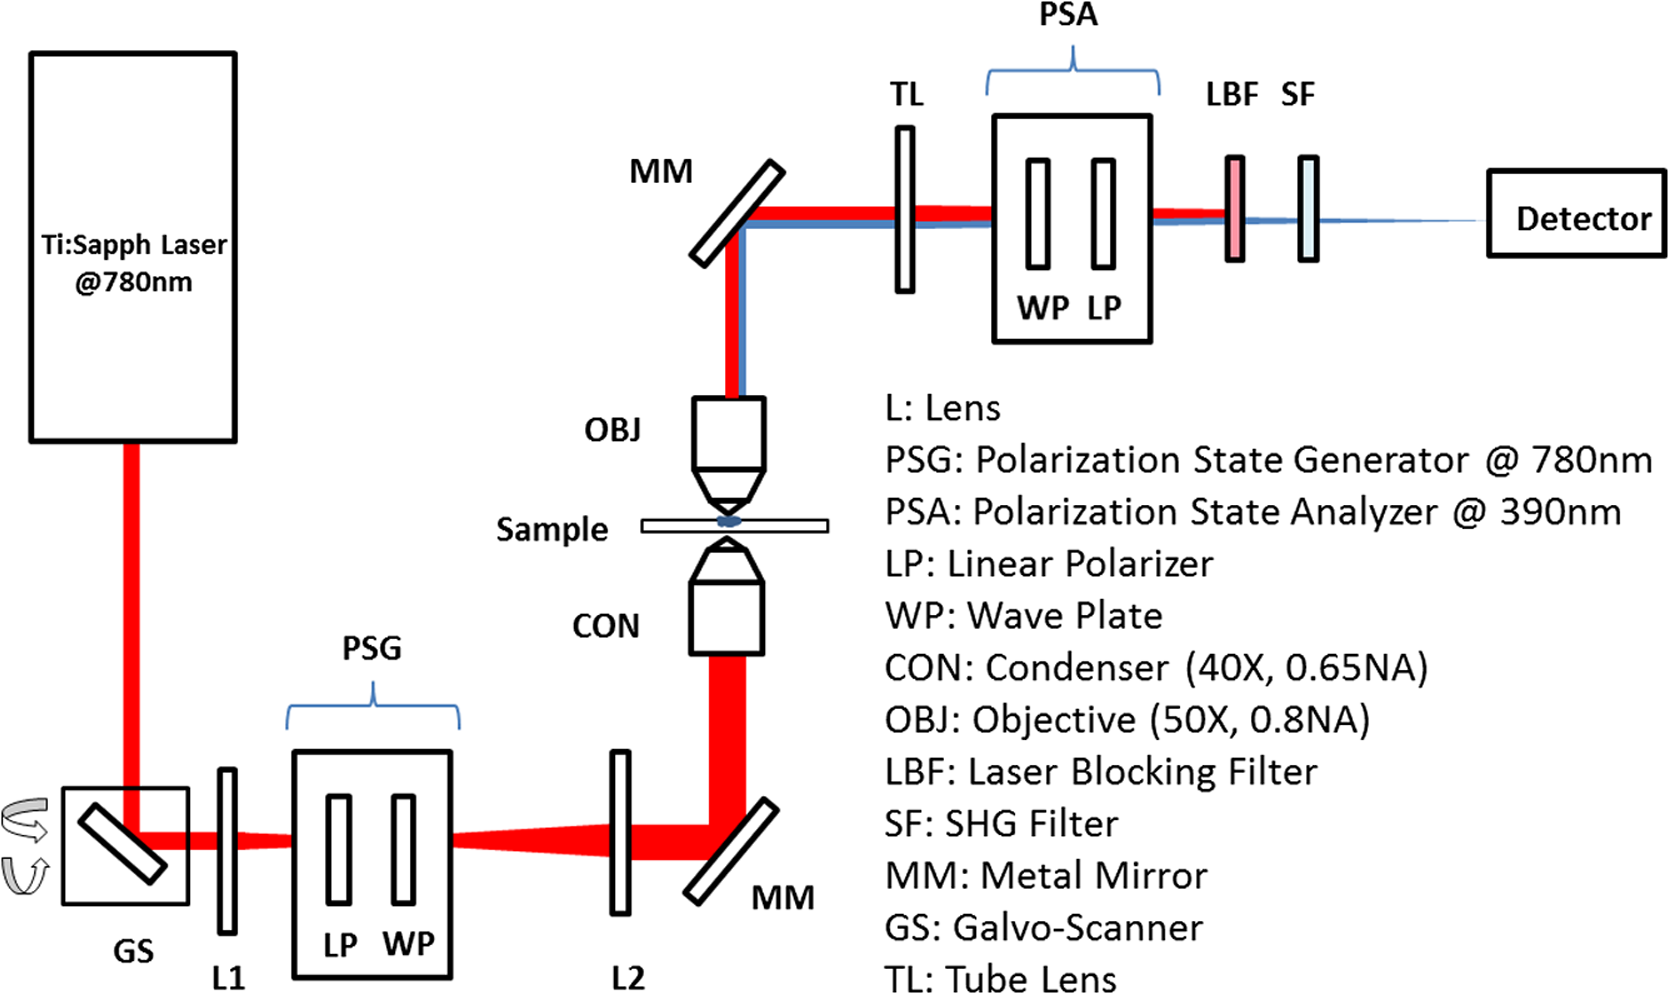
1.IntroductionAssessment of the structural organization of collagen fibers in tissues could help elucidate structure-function mechanisms, which will be important to mechanobiology as well as biomedical research areas ranging from reproductive health1 to cancer studies.2 This is made more relevant by the ubiquitousness of collagen as the most prevalent protein in the human body.3 The noncentrosymmetric structure of collagen makes it an excellent candidate for second-harmonic generation (SHG) imaging. Indeed, owing to the fact that SHG is a second-order nonlinear optical scattering process, it has been shown that SHG imaging of fibrillar collagen-based tissues results in high-contrast images with submicron three-dimensional (3-D) spatial resolution.4 Several quantitative techniques have been applied in order to assess collagen organization. An example is the forward-to-backward intensity ratio (F/B), which has been used to highlight differences in morphology between various tissues.5,6 Another approach is the Fourier-transform (FT) SHG method employed to determine the 3-D structural organization of collagen fibers.7,8 Polarization-resolved (PR) methods for SHG9 and sum-frequency generation,10 have also been used to investigate the optical anisotropic properties of collagen. The -ratio analysis, which involves the second-order susceptibility -parameters, has been used in studies of melanoma tumor tissues11 and breast tissue microarrays having different pathological conditions.2 Notwithstanding the potential utility of this approach, methods employing extraction of these -parameters are hampered by the requirement to accurately model the biological tissue, often with some particular crystallographic symmetry. Therefore, a quantitative imaging approach that utilizes well-known polarimetric methods based on a Mueller calculus would be attractive to SHG imaging since it obviates the need to have the aforementioned tissue model. The Mueller matrix can be considered a transformation from an input to an output Stokes vector representation of light, which allows one to describe the polarization altering behavior of an optical system by a matrix.12 As a metrology technique, Mueller matrix polarimetry, or a similar variant, has been previously adapted to multiphoton imaging. For example, Mazumder et al.13 presented a technique of illuminating a sample with different polarization states to obtain the Stokes parameters, and subsequently extract both a degree of polarization and an anisotropy ratio as quantitative metrics. In addition, Ávila et al.14 acquired sets of SHG images of cornea and sclera for independent polarization states, and used the Mueller matrix elements to reconstruct the images for contrasting quality metrics. However, these techniques relate the linear Mueller matrix model to the nonlinear SHG process, and thus an interpretation of the measured results is not clear. Fortunately, Shi et al.15 showed that the standard, one-photon, Mueller calculus used in linear optics can be extended to a general two-photon case through the use of a so-called double Mueller matrix. In this manuscript, we experimentally demonstrate two-photon Mueller Matrix ()-SHG microscopy by applying the double Mueller matrix polarimetry to SHG imaging. Specifically, we show that measurement of the output Stokes vector permits an estimation of the Mueller matrix for unstained porcine tendon and skin, in principle, down to the level of a single pixel. We also use the Stokes vector to determine the degree of polarization of the nonlinear output. 2.TheoryThe Stokes vector used in linear optics describes the polarization state of light in a vector form16 and can be expressed as , where stands for the intensity and the subscripts , , , , , and represent 0 deg, 90 deg, 45 deg, and , right-hand circularly polarized and left-hand circularly polarized light, respectively. The one-photon Mueller matrix relationship between input () and output () Stokes vectors is15 where is a Mueller matrix, the zero index is used for consistency with Stokes convention, and repeated subscripts imply summation over those subscripts. The Mueller calculus approach assumes a linear relation between the input and output Stokes vectors. In general, for a multiphoton effect, the Mueller matrix becomes an () dimensional array, where is the order of the effect. For two-photon effects, Eq. (1) becomes where the is a two-photon Mueller array relating two input Stokes vector ( and ) to yield an output Stokes vector.For the case of SHG having two input photons with the same energy, we can reduce the 3-D array operating on two input vectors to a matrix operating on one input vector so that and where is the double Stokes representation and can be expressed in terms of single Stokes values as17A series of nine known input polarization states are generated. The first six are chosen on the convention for linear Stokes, while the other three are chosen such that they present a symmetric disposition with respect to the first six on the Poincaré sphere as shown in Fig. 1 (a slightly different model from Ref. 15). For each input state, output images for the polarization analyzer settings should be acquired (that is, , , , , , and ). Hence, the set of nine equations to solve are where is the two-photon Mueller matrix, the () superscript denotes input two-photon Stokes vector, and () superscript stands for output Stokes vector. The individual input and output matrices obtained for each polarization input can be concatenated to obtain consolidated input () and output () matrices, respectively, as By measuring experimentally, we have access to the degree of polarization per polarization basis of the output SHG Stokes vector () and the two-photon Mueller matrix (). The former refers to the elements of a degree of polarization row vector () obtained by invoking on each column representing an input polarization state running from 1 to 9. can be thought of as the degree of polarization of the second-harmonic light generated by input polarization state , after passing through the sample. Also, represents element in matrix (and so on for , , and ). Since we have predetermined the input basis, the two-photon Mueller matrix can be determined by solvingThis approach of obtaining these two metrics can prove useful in understanding how the polarization information may change between different spatial regions within an image. 3.Experimental SetupFigure 2 shows the experimental setup used. SHG imaging is performed in the forward direction in order to eliminate the use of dichroics which have inferior polarization preserving properties when compared with metal mirrors. A Ti:Sapphire laser (Spectra-Physics Mai-Tai HP DeepSee) produces 100-fs pulses at an excitation wavelength centered spectrally at 780 nm and a repetition rate of 80 MHz. Galvanometer-based scanning mirrors (Thorlabs GVS012) are used to sweep the beam over a rectangular field of view at the sample plane. Polarization states are generated using a polarization state generator (PSG) system comprising a linear polarizer and wave plate combination (half-wave plate for linearly polarized input, quarter-wave plate for circularly polarized input, and both for elliptically polarized input). The beam is then reflected off a metal mirror toward the condenser (0.65NA Olympus PLAN N) which focuses onto the sample. The forward-emitted signal is collected by an infinity-corrected objective (0.8 NA Olympus MPlan FL N) and relayed towards a tube lens for focusing. It should be noted that the condenser lens numerical aperture (NA) was chosen to be low enough (18) to still ignore transverse polarization changes at focus while maintaining an acceptable resolution (which increases with higher NA). Polarization analysis is performed using a polarization state analyzer (PSA) system having a quarter-wave plate and linear polarizer combination. A laser blocking short-pass filter (Semrock FF01-680/SP-25) is used for illumination rejection, while an SHG band-pass filter (Semrock FF01-390/BP-18-25) is used for narrow band filtering. The detector is an electron multiplying charge-coupled device (Hamamatsu EMCCD C9100-13) camera having a gain of and an exposure time of 1 s. 4.ResultsPorcine tissue samples were obtained from a local market and embedded in optimal cutting temperature (OCT) compound at . Next, the samples were brought to , and cut into thin sections using a cryostat (Leica CM3050S). The tissue slices were then soaked in PBS to remove excess OCT, and mounted onto microscope coverslips using aqueous mounting media. Tendon samples at 5, 25, and , and skin sample at were obtained this way and used in the study. A set of 54 images, each corresponding to a combination of six PSA states for each nine PSG state, is obtained. We divide an image into smaller “subimage” cell regions, so that if, e.g., a pixel image is divided into subimage cells using a grid, each subimage cell is a pixel image. This is done so that the analysis can be localized and more spatially sensitive. The choice of subimage cell dimension is made based on sensitivity requirements and computational cost. We subsequently determine the local output Stokes vector, degree of polarization per basis and two-photon Mueller matrix within each of these smaller cells using Eqs. (6) and (8). The analysis is applied to subimage cells of two porcine sample types (skin and tendon) at thickness. Figures 3 and 4 show SHG images of porcine skin and tendon samples, respectively, with representative average values over selected localized regions highlighted. We observe that for both samples, there is little sensitivity to mode [represented in terms of a single Stokes vector by ] since the terms (where stands for the index and runs through all the rows) are negligible compared with the other elements of the matrix. It is noted that this also holds true to a lesser extent for the terms. Fig. 3Sample SHG image of porcine skin showing the division into subimage cells using grids. The average values are shown for select regions in the image, which are highlighted by the colored boxes. The bars for in the bar plots are truncated for visualization convenience.  Fig. 4Sample SHG image of porcine tendon showing the division into subimage cells using grids. The average values are shown for select regions in the image, which are highlighted by the colored boxes. The bars for in the bar plots are truncated for visualization convenience. 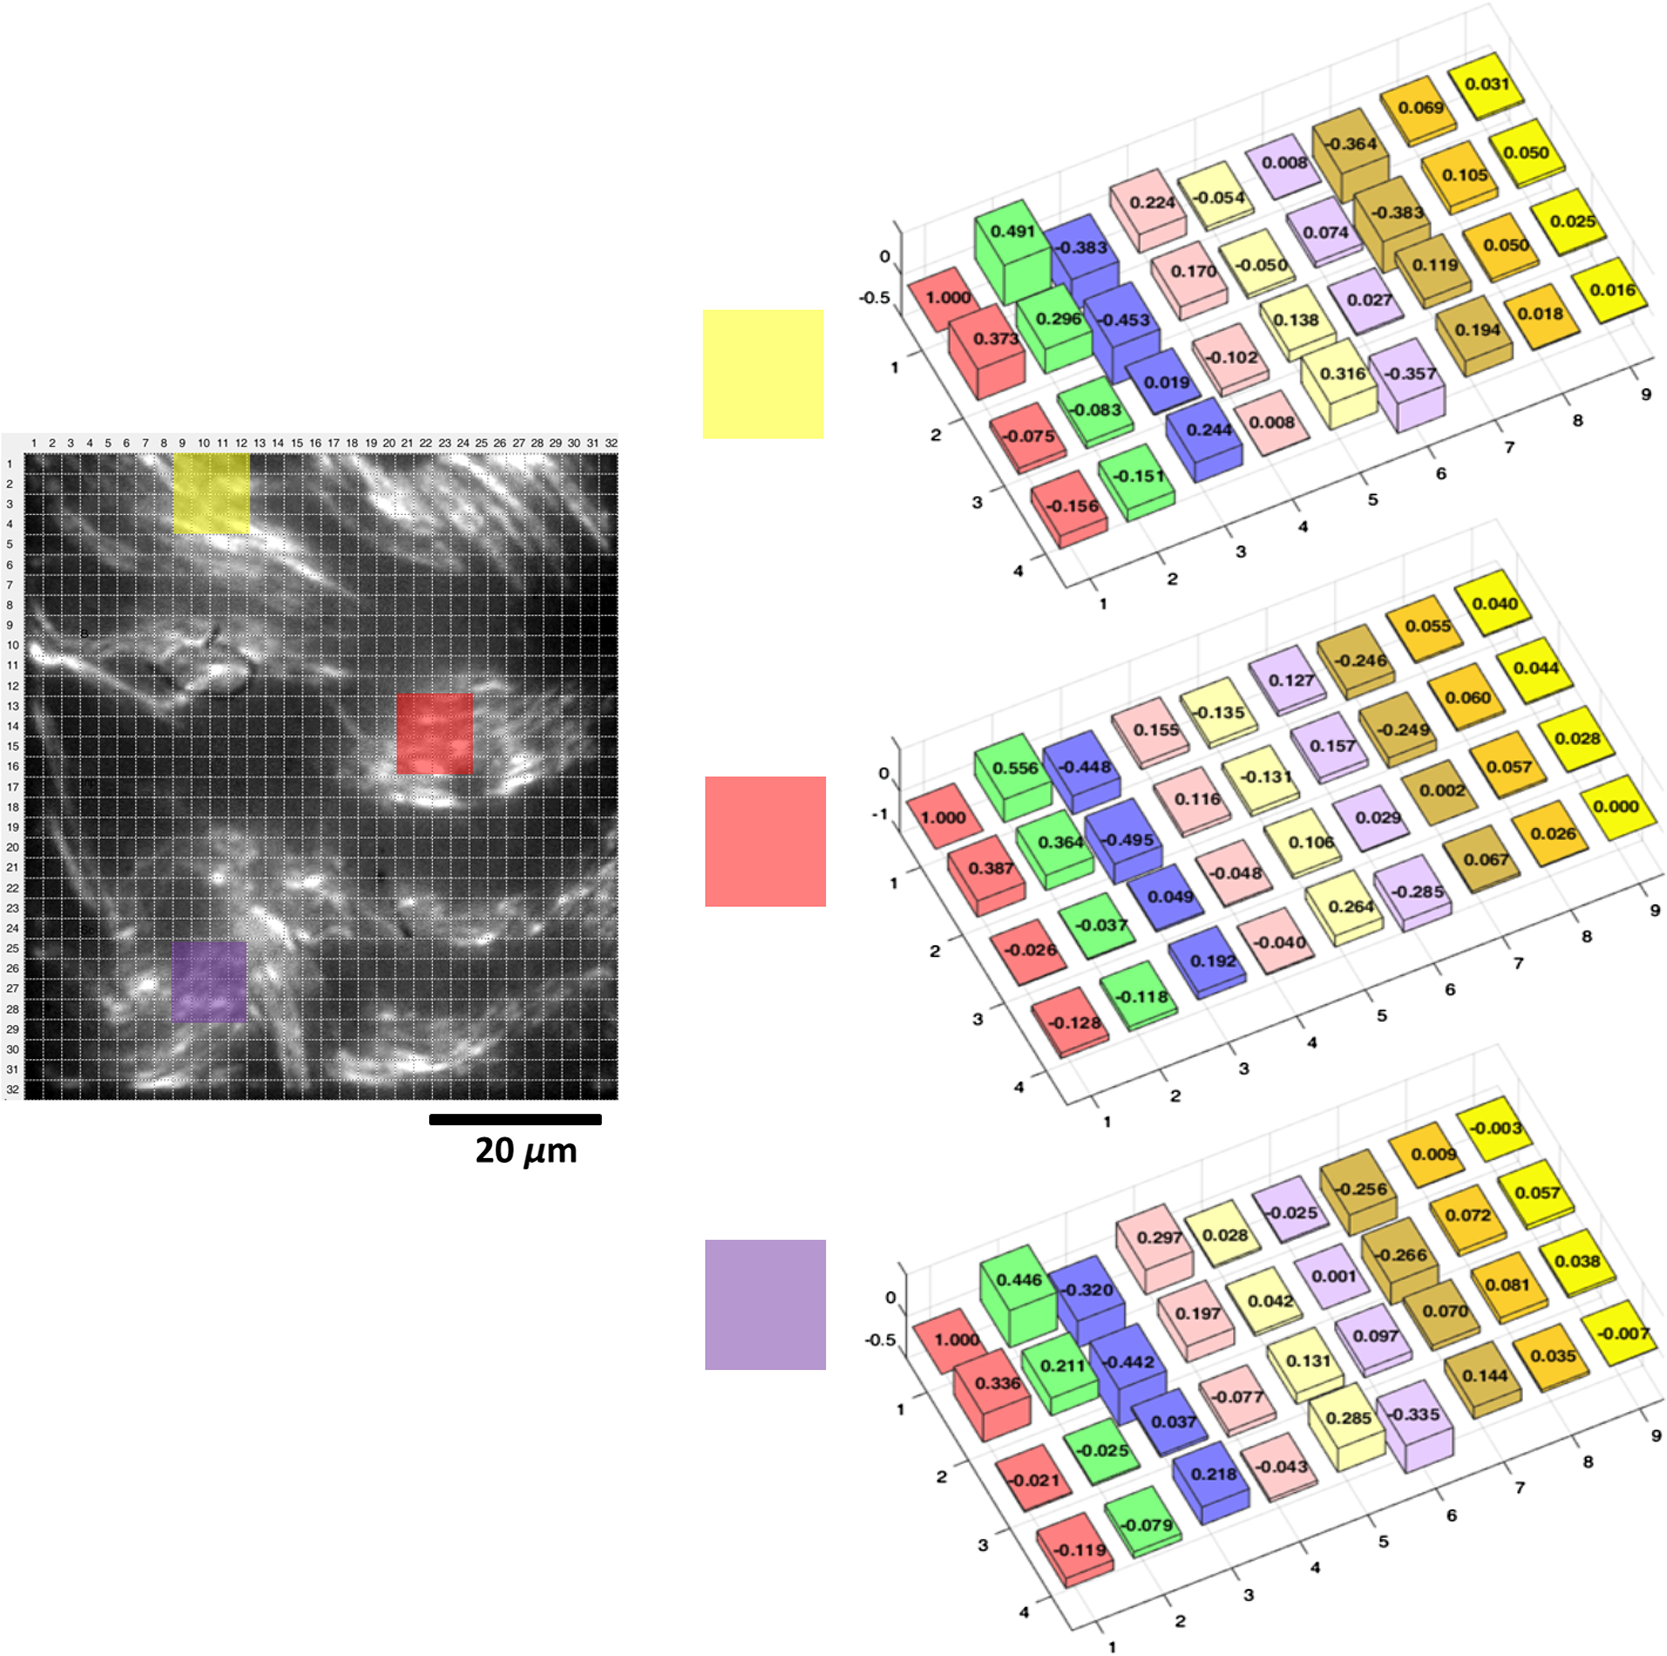 In order to investigate the effect of thickness, another study was conducted for porcine tendon samples at 5, 25, and . The values of across the various subimages are obtained, and the results represented as a histogram distribution plot. For a quantitative description, we choose to fit our data to a bimodal model with normal distribution curves as given by where represent the bimodal mean values, stand for the bimodal standard deviation values, and are mixture probability weights attached to the modes of the distribution. A new metric, the bimodal mean difference (defined by ), which can be considered a measure of shape distribution, is then retrieved.For the set of experiments involving the nine input states, input polarization state (or -input) shows the greatest variation in . The -input results for subimage cells across three different spatial regions each for 75-, 25-, and thick porcine tendon samples are shown in Fig. 5. Using the bimodal distribution equation, a best fit curve for the histogram is obtained and extracted. We find here a variation in (average of 0.068 for , 0.150 for , and 0.238 for ), which depends on the thickness. This can be thought of as implying that the thicker the sample, the greater the range of values and the larger the values that are obtained from the generated SHG. Qualitatively, this suggests that thicker samples mean more scattering events, and hence greater variation in derived parameters. However, it is important not to draw too much meaning from these results due to the limited sample size. Rather, the significance of the measurements is that they are robust and permit the inclusion of polarimetry with SHG imaging. Fig. 5Histogram plots of with -input for porcine tendon at (a) , (b) , and (c) , each taken at three different spatial regions. The solid lines are best fits using the bimodal distribution equation. The associated bimodal mean difference () is also provided. Inset for each plot shows SHG images of the different spatial regions. The scale bar above the top left image is .  In conclusion, we have carried out what is, to our knowledge, the first experimental demonstration of -SHG microscopy in extracting the nonlinear Mueller matrices for quantitative assessment of SHG images. Specifically, we experimentally measure the output Stokes vector and use this to determine the two-photon Mueller matrix and degree of polarization. Moreover, we derived another metric, the bimodal mean difference (), from the degree of polarization distribution model and observed that this metric showed increasing variation with thickness of porcine tendon samples. The increased variation is consistent with the intuition of increased scattering for thicker samples. This can possibly be used in investigating localized growth and/or changes in organizational structure as an indication of abnormality in tissues. However, we note that care should be taken in extracting meaning from because the nonlinearity of SHG complicates relating it to the depolarization of the input Stokes vector. Moving forward, we are currently exploring the computational mining of information-rich two-photon Mueller matrix to obtain additional metrics that would be consistent with a second-order nonlinear scattering process. Furthermore, a multimodal approach can be developed by taking the fiber orientation into consideration, using for example FT-SHG.8 We believe that our approach can be adapted to other multiphoton coherent imaging techniques. ReferencesT. Y. Lau et al.,
“Application of Fourier transform-second-harmonic generation imaging to the rat cervix,”
J. Microsc., 251 77
–83
(2013). http://dx.doi.org/10.1111/jmi.12046 JMICAR 0022-2720 Google Scholar
R. Ambekar et al.,
“Quantifying collagen structure in breast biopsies using second-harmonic generation imaging,”
Biomed. Opt. Express, 3 2021
–2035
(2012). http://dx.doi.org/10.1364/BOE.3.002021 BOEICL 2156-7085 Google Scholar
B. R. Masters et al., Handbook of Biomedical Nonlinear Optical Microscopy, Oxford University Press, New York
(2008). Google Scholar
M. Winkler et al.,
“High resolution three-dimensional reconstruction of the collagenous matrix of the human optic nerve head,”
Brain Res. Bull., 81
(23), 339
–348
(2010). http://dx.doi.org/10.1016/j.brainresbull.2009.06.001 BRBUDU 0361-9230 Google Scholar
R. LaComb et al.,
“Phase matching considerations in second harmonic generation from tissues: effects on emission directionality, conversion efficiency and observed morphology,”
Opt. Commun., 281 1823
–1832
(2008). http://dx.doi.org/10.1016/j.optcom.2007.10.040 OPCOB8 0030-4018 Google Scholar
R. A. R. Rao et al.,
“Quantitative analysis of forward and backward second-harmonic images of collagen fibers using Fourier transform second-harmonic-generation microscopy,”
Opt. Lett., 34 3779
–3781
(2009). http://dx.doi.org/10.1364/OL.34.003779 OPLEDP 0146-9592 Google Scholar
R. A. Rao, M. R. Mehta and K. C. Toussaint,
“Fourier transform-second-harmonic generation imaging of biological tissues,”
Opt. Express, 17 14534
–14542
(2009). http://dx.doi.org/10.1364/OE.17.014534 OPEXFF 1094-4087 Google Scholar
T. Y. Lau, R. Ambekar and K. C. Toussaint,
“Quantification of collagen fiber organization using three-dimensional Fourier transform-second-harmonic generation imaging,”
Opt. Express, 20 21821
–21832
(2012). http://dx.doi.org/10.1364/OE.20.021821 OPEXFF 1094-4087 Google Scholar
X. Han et al.,
“Second harmonic properties of tumor collagen: determining the structural relationship between reactive stroma and healthy stroma,”
Opt. Express, 16 1846
–1859
(2008). http://dx.doi.org/10.1364/OE.16.001846 OPEXFF 1094-4087 Google Scholar
Y. Han et al.,
“Polarization-sensitive sum-frequency generation microscopy of collagen fibers,”
J. Phys. Chem. B, 119
(8), 3356
–3365
(2015). http://dx.doi.org/10.1021/jp511058b Google Scholar
T. Hompland et al.,
“Second-harmonic generation in collagen as a potential cancer diagnostic parameter,”
J. Biomed. Opt., 13
(5), 054050
(2008). http://dx.doi.org/10.1117/1.2983664 JBOPFO 1083-3668 Google Scholar
C. Brosseau, Fundamentals of Polarized Light, John Wiley and Sons, Inc., New York
(1998). Google Scholar
N. Mazumder et al.,
“Polarization-resolved second harmonic generation microscopy with a four-channel Stokes-polarimeter,”
Opt. Express, 20 14090
–14099
(2012). http://dx.doi.org/10.1364/OE.20.014090 OPEXFF 1094-4087 Google Scholar
F. J. Ávila, O. del Barco and J. M. Bueno,
“Mueller-matrix second harmonic microscopy of collagen-based tissues,”
in Focus on Microscopy,
(2015). Google Scholar
Y. Shi, W. M. McClain and R. A. Harris,
“Generalized Stokes-Mueller formalism for two-photon absorption, frequency doubling, and hyper-Raman scattering,”
Phys. Rev. A, 49 1999
–2015
(1994). http://dx.doi.org/10.1103/PhysRevA.49.1999 Google Scholar
W. H. McMaster,
“Polarization and the Stokes parameters,”
Am. J. Phys, 22
(6), 351
(1954). http://dx.doi.org/10.1119/1.1933744 AJPIAS 0002-9505 Google Scholar
M. Samim, S. Krouglov and V. Barzda,
“Double Stokes Mueller polarimetry of second-harmonic generation in ordered molecular structures,”
J. Opt. Soc. Am. B, 32 451
–461
(2015). http://dx.doi.org/10.1364/JOSAB.32.000451 JOBPDE 0740-3224 Google Scholar
H. Kang, B. Jia and M. Gu,
“Polarization characterization in the focal volume of high numerical aperture objectives,”
Opt. Express, 18 10813
–10821
(2010). http://dx.doi.org/10.1364/OE.18.010813 OPEXFF 1094-4087 Google Scholar
BiographyChukwuemeka Okoro is a doctoral candidate in the Department of Electrical and Computer Engineering at University of Illinois at Urbana Champaign (UIUC). He has a masters degree in electrical engineering from UIUC and a bachelors degree in electrical engineering from University of Lagos, Nigeria. His current work involves developing quantitative second harmonic generation imaging technique as a tool for assessing biological tissues. Kimani C. Toussaint Jr. is an associate professor in the Department of Mechanical Science and Engineering, and an Affiliate in the Departments of Electrical and Computer Engineering, and Bioengineering at the University of Illinois at Urbana-Champaign. He directs an interdisciplinary lab which focuses on developing optical techniques for quantitatively imaging collagen-based tissues, and investigating the properties of plasmonic nanostructures for control of near-field optical forces. He is a senior member in SPIE, OSA, and IEEE. |