

|
|
1.IntroductionThere is an increasing interest in developing a better understanding of brain disorders. Photonics offers an opportunity to study brain tissue and diagnose brain diseases, such as brain tumors and Alzheimer’s disease (AD). AD is a progressive neurodegenerative disease, a leading cause of dementia, with loss of cognitive functions, memory, and thinking skills. Early detection of AD is desired for earlier and thus more effective treatments. Cerebrospinal fluid analysis, neuroimaging (e.g., MRI), neuropsychological testing, blood testing, and some other methods have been used for AD diagnosis. These methods are either time consuming or high in cost,1 and their reliability may depend on the disease severity.2 One characteristic of AD patients is the low level of tryptophan. Tryptophan is an essential amino acid for all cells, and it affects brain serotonin synthesis. Serotonin regulates aging, learning, and memory of animals. Acute tryptophan depletion or tryptophan degradation will lead to low serotonin in the brain and may affect the pathogenesis of AD.3–5 On the other hand, tryptophan is also a key intrinsic fluorescent molecule for cancer and bacteria detection and can be used to examine the microenvironment of tryptophan in tissues.6 Recently, Terahertz time-domain spectroscopy (THz-TDS) was used to probe the vibrational modes in biological systems and has been applied to detect concentration changes of amino acids by comparing the phase and magnitude changes of the THz spectra.7–9 THz-TDS offers a new method for pathology imaging of thin tissues or cell smears. It has been shown to be potentially useful as a diagnostic tool for protein sensing and histomorphology studies of healthy and diseased tissue. THz protein sensing of tissue is particularly applicable in diseases where an abnormal level of protein accumulation occurs, as in the formation of amyloid beta () protein plaques and tau protein threads in the cerebral cortex of the brain due to AD. Applying THz-TDS, Yu et al.9 were able to measure the absorption and refraction index of free tryptophan film and powder and found dominant torsional–vibrational modes of the tryptophan molecule. The present study is the first time that THz absorption and index of refraction of AD and normal brain tissues were measured. The THz spectral absorption peaks are attributed to torsional motion of tryptophan molecule in the tissues. The hypothesis is that the difference of tryptophan torsional frequencies, interactions, and concentrations in AD versus normal tissues can be measured and distinguished from THz spectra. The objectives of the present study are to find major fingerprints in brain tissues by comparing the THz spectra in AD and normal tissues in a mouse model of AD, and to propose THz-TDS as a new method for early diagnosis of AD. 2.Materials and Methods2.1.Brain Tissue PreparationThe absorption and index of refraction of brain tissues from AD and control (wild-type) mice were measured with THz spectroscopy. Mice were purchased from Jackson Laboratory and housed at the City College Animal Facility under conditions described previously.10 An 8-month-old triple transgenic AD mouse harboring PS1M146V, APPSwe, and tauP301L transgenes in a uniform strain background11 was used. Another wild-type mouse at the same age was used as control. Experimental procedures were approved by the Institutional Animal Care and Use Committee of the City College of New York. Mice were anesthetized with a mixture of ketamine and xylazine ( body weight), decapitated, and their brains were dissected and postfixed overnight with 4% paraformaldehyde in 0.1 M phosphate buffer (PB)12,13 and subsequently immersed in 30% sucrose in 0.1 M PB for up to 48 h. Prior to slicing, brains with hippocampus regions were quickly frozen and then sliced coronally at thicknesses of 150 and using a freezing stage microtome (American Optical, Buffalo, New York). The 150- and brain tissue slices were then placed on a TPX-sheet and quartz-plate substrate, respectively, and left to dry at room temperature. The thicknesses of TPX and quartz substrates were 0.25 and 1.25 mm, respectively, and the effect of thickness and its variation on brain tissue spectral measurements were negligible. The region of interest (ROI) was on brain hippocampus () and the beam spot was about 1.5 mm in diameter. One sample each was measured for AD and normal tissues, respectively; each sample was measured three times at different spots within the ROI at low humidity (), and then averaged. The inhomogeneity of the tissue samples might affect the magnitude of absorption peaks and contrast, but it would not shift peak frequencies. The THz wave absorption in AD and control samples were compared with that in the pure tryptophan samples under same experimental conditions. Table 1Frequencies at peak absorption in Alzheimer’s (AD) and normal (N) tissues.
Note: AD, Alzheimer’s tissue; N, normal tissue. 2.2.Terahertz SpectroscopyFigure 1 shows a schematic diagram of the THz experimental setup. THz radiation is produced by optical rectification (OR) method.9,14,15 The key parts of the THZ setup are numbered in Fig. 1. A Ti-Sapphire 100-fs pulse laser (#1) is used as the pump generator for THz source. The laser source is a Coherent Mira-Seed, a RegA 9000 amplifier pumped by a Veri-V18 laser (solid-state, single-frequency, CW 532 nm, Coherent Inc., Santa Clara, California). The average output power of the laser source is 700 mW at , with the pulse duration 100 fs and repetition rate 250 kHz. Both the emitter and detector are ZnTe crystals with 110 orientation. The focal length for both THz TPX-lenses is 100 mm; the spot size of the THz beam on the samples is around 1.5 mm. The linear polarized light output from the pump laser is divided into two parts by a beam splitter (#4), (a) the higher portion (pump optical arm 70%) of the beam power is focused onto the emitter (#6) (ZnTe crystal, 110-orientation, thickness 2 mm) by a short-focus lens (#5); and (b) the lower portion (30%) of the beam goes into a receiver optical arm. The emitted beams are collimated by a parabolic mirror (#7) and focused into a sample (#9) by a TPX (polymethylpentene) THz-lens (#8, focal length 100 mm). The THz-wave, refracted and partially absorbed by the sample, is collimated by a second THz-lens (#8) and focused by a second parabolic mirror (#10) onto a ZnTe detector (#13). This ZnTe detector is the same as the emitter (thickness 2 mm, 110 orientation). Both the ZnTe emitter and detector are placed at the focal points of the offset parabolic mirrors (#7, #10), respectively. The polarization (-vector direction) of infrared pump beam (800 nm) is parallel to the ZnTe emitter crystal 110-orientation, and parallel to the receiver optical arm beam polarization. The polarization of emitted THz wave has the same orientation as the polarization of the pump beam. The pump optical arm and receiver optical arm must have the same optical length. For precise equalizing of both arm lengths, back-reflector prism-mirrors (#2, #12) are installed on the translated stages. The receiver optical arm beam is usually named the probe beam. This method of THz-TDS was called pump-probe method.9,14,15 The probe beam is focused by a long-focus lens (#11), goes through the hole in the center of the parabolic mirror (#10) collinearly to the focused THz beam, and shoots at the same point on the detector as the focused THz-beam. Fig. 1Setup of experiment. 1. Ti-Sapphire laser (800 nm); 2. translated-stage prism-mirror; 3. mirror, 4. beam-splitter (); 5. short-focus lens; 6. THz (ZnTe) emitter; 7. parabolic mirror; 8. THz-lens; 9. tissue sample; 10. parabolic mirror with a hole; 11. long focus lens; 12. soft-driven translated-stage prism mirror; 13. ZnTe detector; 14. -waveplate; 15. Wollaston-prism; 16. balanced detector; 17. lock-in-amplifier; 18. PC; 19. chopper.  The THz pulse transmitted through a sample goes into the detector, which has a high birefringence. The electric field component of the THz-pulse modulates the amplitude of the birefringence. The infrared probe beam pulse goes through the detector and changes its own polarization (from linear to elliptical), which is synchronized to variation of intensity generated by THz-pulse electric field. This change in polarization of infrared probe beam is analyzed by a -waveplate (#14) and a Wollaston prism (#15). The THz-signal appears as a derivative curve at the output of a balance detector (#16), goes into lock-in-amplifier (#17), and is analyzed by a PC (#18). A THz-box filled with nitrogen is used to eliminate water absorption which may influence the THz spectra obtained from the samples. The profiles of absorption and refraction index were obtained from measured THz signals by performing fast Fourier transform (FFT).9,14 3.Results and DiscussionFigure 2 shows the THz temporal profiles through the AD tissue, normal tissue, and pure substrate samples. Figure 3 shows the power of THz-radiation, obtained after applying FFT of the temporal profiles. Different shapes and magnitudes measured between AD and normal tissues suggest more absorption in AD tissue. The absorption (Fig. 4) and index of refraction (Fig. 5) were obtained from FFT data and summarized in Tables 1 and 2, respectively. Fig. 2THz pulse signals passing through substrate with AD brain tissue (dash line), substrate with normal tissue (solid line), and the substrate without tissue (dot line). 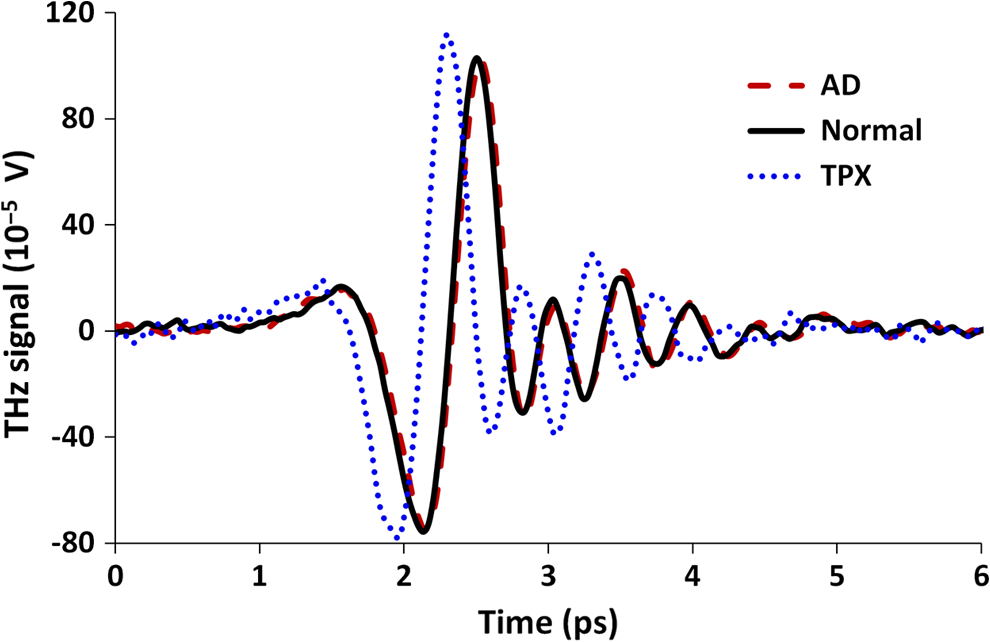 Fig. 3THz power transmitted through AD brain tissue, normal tissue and substrate. (a) Tissue thickness , TPX substrate sheet. (b) Tissue thickness , quartz substrate plate. 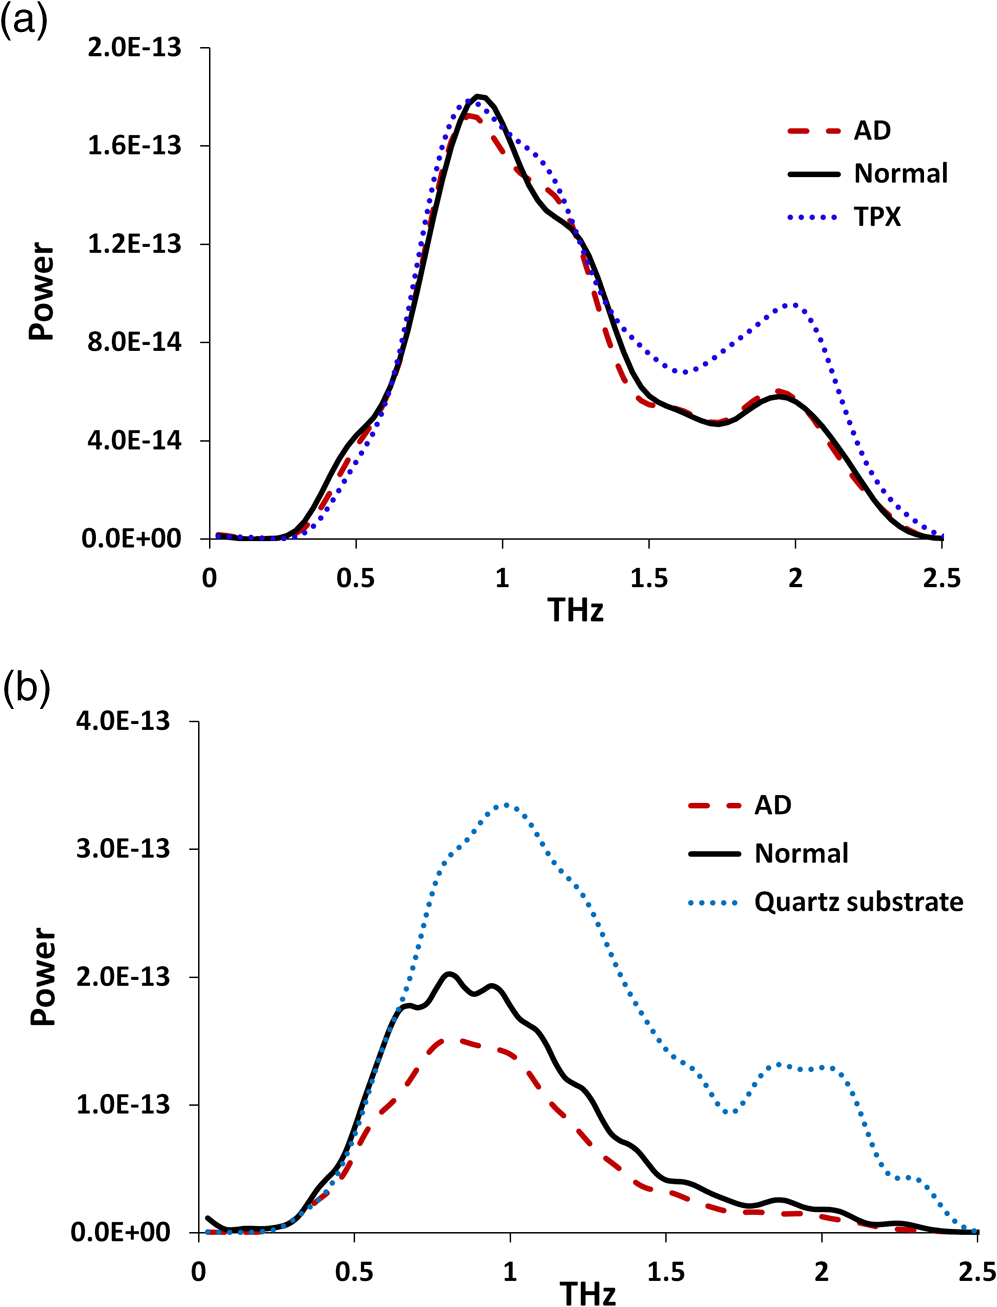 Fig. 4Absorption spectra of THz wave in AD and normal brain tissues. (a) Tissue thickness , TPX substrate sheet. (b) Tissue thickness , quartz substrate plate.  Fig. 5Refraction index of THz waves transmitted through AD and normal tissues. (a) Tissue thickness , TPX substrate sheet. (b) Tissue thickness , quartz substrate plate.  Table 2Index of refraction at peak absorption in Alzheimer’s (AD) and normal (N) tissues.
Note: AD, Alzheimer’s tissue; N, normal tissue. Figure 4 shows three peaks of absorption in the AD tissue at frequencies 1.44, 1.8, and 2.114 THz, respectively, while the peaks in normal tissue were slightly shifted from AD tissue. Previous studies7–9 measured the absorption spectra and index of refraction of tryptophan in 0.2 to 2.2 THz range, and reported two dominating torsional–vibrational modes at about 1.435 and 1.842 THz. A third free tryptophan mode was detected at 2.114 THz by Yu et al.9 (unpublished) and at 2.14 THz by Laman et al.8 The higher frequency mode at peak 3 () appears to interact differently with the host environment than peaks 1 and 2 (1.435 and 1.842 THz, respectively).8 Tables 1 and 2 summarize the modes and indices of refraction observed in the experiments. The frequencies at absorption peaks in AD and normal tissues match those of free tryptophan torsional–vibrational modes, showing that these absorption modes originate from the tryptophan molecule. The effect of etalon from multiple reflections of Fabry–Perot effect between substrate surfaces and tissue surfaces are shown to be minimum in terms of differences in any mode frequencies and small variations in transmission.9 In addition, compared with spectra peaks in normal tissue, peaks in AD tissue are closer to those of tryptophan, suggesting that tryptophan in AD brain tissue is less bonded to other molecules than in normal brain tissue. In normal tissue, tryptophan is more bonded to other molecules, and the THz mode at may be more easily affected by those tryptophan-bonded molecules. Therefore, any changes of these molecules would lead to bigger changes of THz mode in normal tissue than in AD tissue, as shown by the shift from 2.06 to 2.145 THz in normal brain with thickness changes from 150 to , while it is barely affected in AD tissue (from 2.11 to 2.1 THz). The tryptophan molecular motions and electronic transitions could be affected by the amyloid deposits and tau proteins threads. More studies are needed for further validation of this observation. The indices of refraction (Table 2) in AD tissue ( and 1.52 for 150- and thickness tissue, respectively) are bigger than those in normal tissue ( and , respectively) and free tryptophan powder film (),9 indicating that AD has additional polarizability contributed by the dielectric constant that increases the index of refraction due to electronic, ionic, and dipolar mechanisms. Water’s index of refraction () can also increase due to these mechanisms, and thicker tissues may contain more water. Therefore, thin tissues (150 and ) were used in this study to eliminate the influence of water on index of refraction. In AD mice, intraneuronal () is observed at age of 3 months. Synaptic dysfunction measured electrophysiologically at 6 months (abnormal long-term potentiation) correlates with the progressive accumulation of prior to detection of extracellular () and neurofibrillary tangles containing phosphorylated tau protein (NFT). At the age of 6 months, plaques are observed first in the cerebral cortex and then in the hippocampus, while NFT are first observed in hippocampus and then in the cerebral cortex at 12 months of age.11 The higher refraction index of AD brain is associated with the different components in AD than in normal tissues, which is most likely due to amyloid plaques and tau protein fibers in AD tissue. THz spectroscopy has been applied to distinguish healthy and diseased brain tissues.16–18 Among these studies, Oh et al.16 demonstrated that THz reflection intensity was higher in freshly excised rat brain tumors (orthotopic glioma) than in normal tissue; Meng et al.17 measured higher index of refraction, absorption coefficient, and dielectric constant in paraffin-embedded mouse gliomas than normal brain tissues. Our experimental observations of higher refractive index and absorption coefficient in diseased tissues are consistent with the study on tumor tissues by Meng et al.17 but peaks of tryptophan THz spectra were not clearly observed in their study. Study of Png et al.18 showed lower THz absorption in cingulate gyrus and inferior frontal gyrus but higher absorption in superior frontal gyrus (SFG) of AD brains. They attributed the opposite behavior of SFG to scattering from uneven surface of the sample. Different preparations of tissue samples may influence the experimental results since fresh tissues may contain more water, which will contribute greatly to the absorption. In the present study, tissues were first fixed by paraformaldehyde and then immersed in sucrose solution before slicing. Sucrose is a cryoprotectant/partial dehydrant that prevents the formation of ice crystal artifacts in frozen tissue sections, especially important in the cellular “gray matter” which freezes at a different rate than the highly lipid myelinated “white matter.” In addition, it seems that 30% sucrose freezes at approximately the same speed and to the same hardness as formalin- or paraformaldehyde-fixed brain tissue. In addition, sucrose’s THz modes are at 3.05 and 3.24 THz,19 beyond the upper limit of THz spectra (2.5 THz) in the present study. Therefore, tissue preparation in the present study greatly eliminated the influence of water and/or sucrose on experimental measurements. The goal of the study is to propose a new technique for detecting AD by comparing the THz spectra of AD and normal brain tissues with free tryptophan. A qualitative result has been obtained that THz spectra of AD brain tissue are closer to those of free tryptophan, suggesting that tryptophan molecules in AD mouse brain tissue are more isolated and freer than in a normal mouse. Future studies may be conducted on more brain tissue samples to gain a quantitative assessment of AD diagnosis using THz imaging. In conclusion, the present study is the first to detect optical molecular torsional modes due to tryptophan difference between AD and normal mouse models using THz technique. These THz absorption modes may be used as a fingerprint for AD diagnosis, which proposes a new method for early detection of AD. AcknowledgmentsThis work was supported by ARO (RRA) and NIH grants 5SC1HD068129 (ARC) and 2G12RR003060-26A1 from the National Center for Research Resources (ARC). ReferencesC. Laske et al.,
“Innovative diagnostic tools for early detection of Alzheimer’s disease,”
Alzheimer’s Dement., 11
(5), 561
–578
(2015). http://dx.doi.org/10.1016/j.jalz.2014.06.004 Google Scholar
P. J. Nestor, P. Scheltens and J. R. Hodges,
“Advances in the early detection of Alzheimer’s disease,”
Nat. Rev. Neurosci., 10
(Suppl.), S34
–S41
(2004). http://dx.doi.org/10.1038/nrn1433 1078-8956 Google Scholar
R. J. Porter et al.,
“Cognitive deficit induced by acute tryptophan depletion in patients with Alzheimer’s disease,”
Am. J. Psychiarty, 157
(4), 638
–640
(2000). http://dx.doi.org/10.1176/appi.ajp.157.4.638 Google Scholar
R. J. Porter, B. S. Lunn and J. T. O’Brien,
“Effects of acute tryptophan depletion on cognitive function in Alzheimer’s disease and in the healthy elderly,”
Psychol. Med., 33
(1), 41
–49
(2003). http://dx.doi.org/10.1017/S0033291702006906 PSMDCO 0033-2917 Google Scholar
B. Widner et al.,
“Tryptophan degradation and immune activation in Alzheimer’s disease,”
J. Neural Transm., 107
(3), 343
–353
(2000). http://dx.doi.org/10.1007/s007020050029 Google Scholar
W. Lovenberg, E. Jequier and A. Sjoerdsma,
“Tryptophan hydroxylation: measurement in pineal gland, brainstem, and carcinoid tumor,”
Science, 155
(3759), 217
–219
(1967). http://dx.doi.org/10.1126/science.155.3759.217 SCIEAS 0036-8075 Google Scholar
Z. Ozer et al.,
“Concentration-based measurement studies of L-tryptophan using terahertz time-domain spectroscopy (THz-TDS),”
Appl. Spectrosc., 68
(1), 95
–100
(2014). http://dx.doi.org/10.1366/13-07165 APSPA4 0003-7028 Google Scholar
N. Laman et al.,
“High-resolution waveguide THz spectroscopy of biological molecules,”
Biophys. J., 94 1010
–1020
(2008). http://dx.doi.org/10.1529/biophysj.107.113647 BIOJAU 0006-3495 Google Scholar
B. Yu et al.,
“Torsional vibrational modes of tryptophan studied by terahertz time-domain spectroscopy,”
Biophys. J., 86 1649
–1654
(2004). http://dx.doi.org/10.1016/S0006-3495(04)74233-2 BIOJAU 0006-3495 Google Scholar
S. Adise et al.,
“Effect of maternal care on hearing onset induced by developmental changes in the auditory periphery,”
J. Neurosci., 34
(13), 4528
–4533
(2014). http://dx.doi.org/10.1523/JNEUROSCI.4188-13.2014 JNRSDS 0270-6474 Google Scholar
S. Oddo et al.,
“Triple transgenic model of Alzheimer’s disease with plaques and tangles: intracellular Ab and synaptic dysfunction,”
Neuron, 39 409
–421
(2003). http://dx.doi.org/10.1016/S0896-6273(03)00434-3 NERNET 0896-6273 Google Scholar
S. Miraux, J. M. Franconi and E. Thiaudiere,
“Blood velocity assessment using 3D bright-blood time-resolved magnetic resonance angiography,”
Magn. Reson. Med., 56
(3), 469
–473
(2006). http://dx.doi.org/10.1002/mrm.20990 MRMEEN 0740-3194 Google Scholar
A. K. Sinha, C. Cane and S. T. Kempley,
“Blood flow in the common carotid artery in term and preterm infants: reproducibility and relation to cardiac output,”
Arch. Dis. Childhood Fetal Neonatal Ed., 91
(1), F31
–F35
(2006). http://dx.doi.org/10.1136/adc.2004.058172 Google Scholar
C. A. Schmuttenmaer,
“Exploring dynamics in the far-infrared with terahertz spectroscopy,”
Chem. Rev., 104
(4), 1759
–1779
(2004). http://dx.doi.org/10.1021/cr020685g CHREAY 0009-2665 Google Scholar
P. Shumyatsky and R. R. Afano,
“Terahertz sources,”
J. Biomed. Opt., 16
(3), 033001
(2011). http://dx.doi.org/10.1117/1.3554742 JBOPFO 1083-3668 Google Scholar
S. J. Oh et al.,
“Study of freshly excised brain tissues using terahertz imaging,”
Biomed. Opt. Express, 5
(8), 2837
–2842
(2014). http://dx.doi.org/10.1364/BOE.5.002837 BOEICL 2156-7085 Google Scholar
K. Meng et al.,
“Terahertz pulsed spectroscopy of paraffin-embedded brain glioma,”
J. Biomed. Opt., 19
(7), 077001
(2014). http://dx.doi.org/10.1117/1.JBO.19.7.077001 JBOPFO 1083-3668 Google Scholar
G. Png et al.,
“Terahertz spectroscopy of snap-frozen human brain tissue: an initial study,”
Electron. Lett., 45
(7), 343
–345
(2009). http://dx.doi.org/10.1049/el.2009.3413 ELLEAK 0013-5194 Google Scholar
P. Dean et al.,
“Dual-frequency imaging using an electrically tunable terahertz quantum cascade laser,”
Opt. Express, 17
(23), 20631
–20641
(2009). http://dx.doi.org/10.1364/OE.17.020631 OPEXFF 1094-4087 Google Scholar
BiographyLingyan Shi is a research associate at IUSL and Biology Department at the City College of New York (CCNY). She obtained her PhD degree in biomedical engineering from CCNY. Her research interests include in vivo deep tissue imaging by using multiphoton with femtosecond laser pulses to understand functional interactions between neural cells and brain vasculature, and quantification/regulation of blood-brain barrier permeability for drug delivery. Other research interests include biomedical optics and cardiovascular biomechanics. Pavel Shumyatsky is a research associate at the CCNY. Before joining CCNY his research area included far-infrared lasers and methods for laser frequency stabilization and absolute measurements. After joining CCNY he developed laser scanning and quantum dots microscopes, methods for application of Laguerre-Gaussian laser beams for imaging in scattering media, application of THz spectroscopy for investigation of materials for physics, biology, and medicine. Adrián Rodríguez-Contreras is a biology assistant professor at the CCNY. In 2008, he established the developmental neurobiology laboratory combining anatomical, electrophysiological, and two-photon microscopy tools to study animal models of brain development and disease. Other research interests include applying novel methods in fluorescence microscopy for in vivo studies, exploring the cellular mechanisms involved in the growth of brain tumors and understanding the functional interactions between neural cells and the brain vasculature. Robert Alfano is a distinguished professor of science and engineering at the City College of CUNY. He has contributed significantly to the field of ultrafast laser science and is a pioneer in the application of light and photonics technologies to the study of biological, biomedical and condensed matter systems, invented and used in his research supercontinuum and novel tunable lasers. He is a fellow of APS, OSA, IEEE, and NY Academy of Science. |
|||||||||||||||||||||||||||||||||||||||||||||||||||||||||||||


