
|
|
1.IntroductionIn the field of laser bioeffects, the type of cellular damage induced during ocular exposure depends on the laser wavelength and exposure duration. For visible and near-infrared (NIR) exposures, high temperatures and pressures can occur around laser-irradiated melanosomes, which are highly absorbing melanin-filled granules in the retinal pigment epithelium (RPE) layer. In the nanosecond (ns) to microsecond pulse regime, these high temperatures and pressures can lead to melanosome microcavitation, producing spatially confined mechanical damage to the surrounding tissue.1–10 A better understanding of the melanosome temperature required for cavitation, and of the subsequent mechanical effects, is necessary to determine the cellular damage mechanisms associated with melanosome microcavitation. The temperature required for cavitation, in the absence of irradiation, is known as the nucleation temperature and has been estimated by various groups, using temperature-dependent microcavitation data for ns-pulse exposures at 532 nm.2,3,8,11 In these studies, the nucleation temperature is often used to estimate the absorption coefficient of melanosomes in the visible exposure range. However, little data existed in the NIR regime until our previous studies,12,13 which measured room temperature, ns pulse, melanosome microcavitation thresholds at wavelengths from 532 to 1540 nm. Since temperature-dependent cavitation data in the NIR were not available at the time, NIR melanosome absorption coefficients were estimated in these studies using nucleation temperatures obtained from previous 532-nm temperature-dependence studies.3,11 In the current study, temperature-dependent measurements of melanosome microcavitation thresholds for ns-pulse exposures at 1064 nm were performed in order to validate previously estimated absorption coefficient values in the NIR. Therefore, this research focused on the empirical determination of the 1064-nm, ns-pulse nucleation temperature that is required for a more accurate NIR absorption coefficient estimation. Temperature-dependent data were also collected for 532-nm, ns-pulse exposures and compared to previously reported values. Black polystyrene microbeads were also investigated to determine microcavitation threshold values as a function of temperature for 532-nm, ns-pulse exposures. This additional study allowed a comparison of melanosome data to microcavitation data for particles of similar size with known optical and mechanical properties. Three different-sized polystyrene microparticles (diameters of 0.5, 1, and ) were used to investigate the effects of particle size on microcavitation threshold, nucleation temperature, and absorption coefficient. Average radiant exposure thresholds for microcavitation of isolated bovine melanosomes were determined with increasing temperatures using single ns laser pulses at 532 and 1064 nm. Results of this study showed a decrease in radiant exposure threshold as a function of increasing temperature for both 532- and 1064-nm exposures. The nucleation temperatures at both wavelengths were extrapolated through the linear relationship of the temperature increases versus decrease in radiant exposure threshold. Melanosome absorption coefficients for visible and NIR wavelengths were estimated from temperature and threshold data using the model of Brinkmann et al.3 In addition, these absorption coefficients were compared to estimated values previously reported by Schmidt et al.12,13 2.Materials and Methods2.1.MicroparticlesThe preparation procedure for bovine pigment granules (melanosomes) followed the method of Dontsov et al.14 After the separation procedure, stock solutions of the melanosomes were stored at 4°C. Dilutions of samples were prepared in deionized water prior to analysis. Plated aqueous melanosomes were prepared on glass microscope slides in order to observe cavitation events. A sealed silicone washer and glass cover slip were used to enclose the aqueous melanosomes and to prevent evaporation of the aqueous suspension. By plating samples on a clear glass slide, observations of the microcavitation events were made possible using a camera positioned below the sample suspension and strobe back-illumination. The total thickness of the sample layer was . Unfunctionalized, Polybead® black-dyed microspheres from Polysciences Inc. (Warrington, Pennsylvania) of three sizes were purchased and included diameters of 0.5, 1, and . Each sample was diluted in deionized water to achieve similar concentrations as the plated melanosomes, allowing for irradiation of isolated particles. These particles, with known optical and mechanical properties, were prepared in the same manner as the melanosomes and were investigated to compare their microcavitation data to the results obtained for melanosomes. Furthermore, different-sized particles were investigated to determine whether the size of the particle correlated to a different microcavitation threshold, nucleation temperature, absorption coefficient, or absorption efficiency. In order to measure the temperature surrounding the microparticles, an Epocs 10 kilo-ohm 1% thermistor (model B57540G1103F000) was inserted into the center of the thickest portion of the sealed aqueous sample of melanosomes and microspheres. A custom-built heater chamber was used to increase the ambient temperature surrounding the microparticles. The chamber was heated by an Omega Engineering OmegaLux (Samford, Connecticut) blanket style heater element (120 V, 11 W). The heater element was controlled by an Omega Engineering (model CSI8DHC24) temperature controller with a two-wire Honeywell (Morris Plains, New Jersery) resistance temperature detector sensor (model HEL705T01200) for feedback control. The temperature readout for the chamber was accomplished with a Wheatstone bridge circuit monitored by a custom LabVIEW program (National Instruments, Austin, Texas). The temperature sensors were calibrated in a water bath using a calibrated thermometer, and the temperature based on a fit of the Steinhart–Hart equation to the tabularized manufacturers’ data for 0 to 150°C. The resistance and voltage readouts of the thermistor were measured from 0 to 100°C and entered into the Steinhart–Hart equation with the fit parameters to obtain a temperature measurement. The temperature chamber containing the sample and thermistor was placed in line with the irradiation beam and strobe beam in order to observe the microcavitation events. 2.2.Experimental SetupTwo beam paths were used in order to observe the microcavitation events before, during, and after laser exposure. Figure 1 shows the general experimental setup and includes (1) the irradiation beam and (2) the strobe illumination beam. The 1064- and 532-nm irradiation beams are produced by either primary or frequency doubled emission from a -switched Nd:YAG (Spectra Physics model DCR-11, Santa Clara, California), with a pulse repetition frequency of 10 Hz and pulse duration of 10 ns. A doubling crystal and dichroic mirrors were used to obtain 532 nm and were placed in the beam path prior to the half-wave plate and the polarizing cube. A half-wave plate controlled the pulse energy delivered to the sample. A beam splitter (BS) was used to send 10% of the beam energy into a reference detector (P1), and the remaining energy passed through the splitter and was measured by a second energy detector (P2) at the sample site. The ratio between the two detectors was measured and recorded before every experimental run. The pulse energy from P1 was multiplied by the P1/P2 ratio to determine the energy delivered to the sample. A shutter was placed prior to the sample to ensure single-pulse data. Fig. 1Schematic of the laser and illumination setup for observing microcavitation bubble formation from irradiated melanosomes. BS, a beam splitter, directed 10% of the beam energy into P1, a reference power meter. Detector P2 measured the remaining energy passed through BS at the sample site. In the case of 532-nm data collection, a doubling crystal and dichroic mirrors were used along the beam path prior to the half-wave plate and polarizing cube. Light was collected in a lens at a 90 deg angle from the 532-nm pump beam once it entered into the dye cell. A lens was used to slightly focus down the light, and a set of mirrors was used to align the strobe light to the focusing lens just prior to the source of data collection. Figure 2 illustrates the speckle-free images due to the low coherence of the strobe beam. 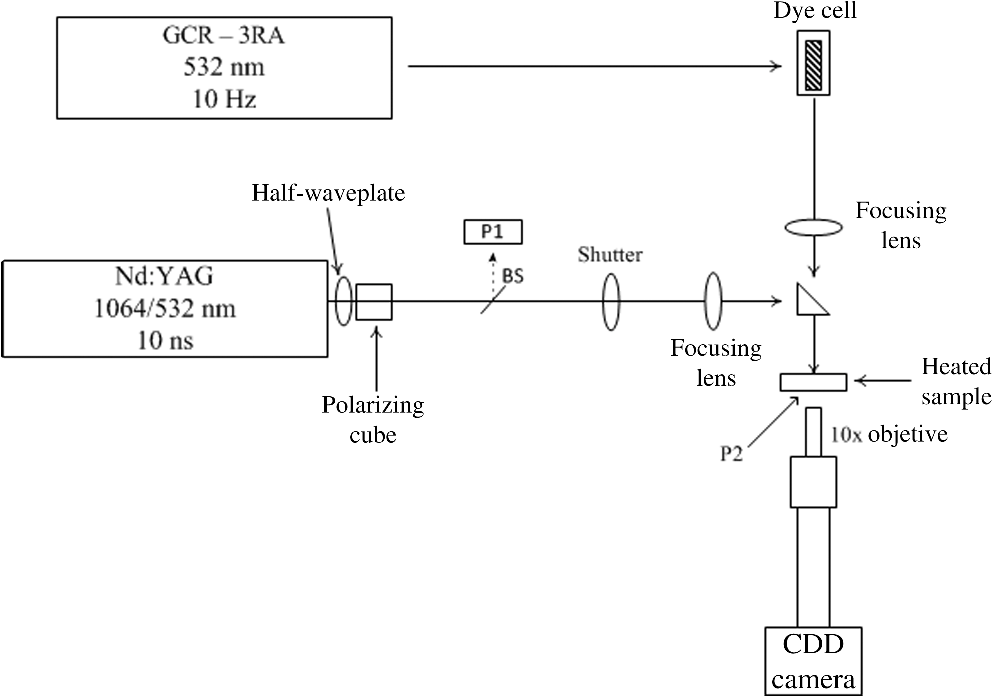 The strobe illumination beam was produced by a second -switched Nd:YAG (Spectra Physics Model GCR-130), also a 10 Hz source with 10 ns pulse duration, which was frequency doubled for output at 532 nm. This beam was directed through a dye cell containing Rhodamine 640 perchlorate dissolved in methanol, which emitted at . A lens and a set of mirrors were used to slightly focus down the light as well as align the strobe light to the focusing lens at the source of data collection. Furthermore, the focused illumination beam was directed to the sample through the back of an IR mirror that also turned the irradiation beam to the sample. Images were observed using a lab-built microscope using a Mitutoyo long-working-distance microscope objective (M Plan Apo) along with a Bobcat CCD camera (Imperx Incorporated, Boca Raton, Florida). In addition, a total magnification of was achieved through the use of a 400-mm tube lens. A delay system allowed time-resolved imagery by controlling the time delay between the irradiation beam and the strobe illumination beam as well as triggering the CCD camera for image capture. It has been shown by Kelly11 that microcavitation bubbles expanded and collapsed in , and a 125-ns delay postexposure was a sufficient stroboscopic delay to observe cavitation events. Based on this previous research, a 125-ns delay was used postexposure for the current studies. In addition, pre- and postcavitation images were collected and used to background-subtract from the exposure image for improved images. Figure 2 shows isolated melanosomes prior to laser irradiation at 532 nm [Fig. 2(a)], as well as a background-subtracted image during irradiation at threshold [Fig. 2(b)] and a background-subtracted image at 1064 nm of melanosomes at threshold [Fig. 2(c)]. Figure 2 also contains an image of polystyrene microspheres prior to laser irradiation at 532 nm [Fig. 2(d)], as well as a background-subtracted image during laser irradiation at two times above threshold [Fig. 2(e)]. Images in Fig. 2 illustrate low coherence due to the strobe technique used to collect data. Fig. 2(a) Isolated single melanosomes at 532 nm, (b) cavitation with background subtraction at threshold, and (c) cavitation with background subtraction at threshold. The images in (b) and (c) are following 532- and 1064-nm, 10-ns irradiation, respectively. (d) Isolated polystyrene microsphere and (e) cavitation of polystyrene microsphere with background subtraction at two times above threshold. (b)–(e) Delay postexposure of 125 ns. .  3.Data Analysis and Modeling3.1.Radiant Exposure Threshold AnalysisBeam diameter measurements were performed prior to each data set collection using the knife-edge technique. In each case, the spot size consisted of a Gaussian beam, which results in an average radiant exposure value. The average beam diameter at 532 nm was , and the average beam diameter at 1064 nm was . Data were collected at 532 and 1064 nm, both with a 10 ns pulse duration. For each wavelength, the ambient temperature surrounding the melanosomes was increased across eight different temperatures ranging from 20 to 85°C. A temperature range of 20 to 65°C for each wavelength was measured for the microspheres. The total number of data points () at each temperature measurement ranged from to 600 for both the melanosomes and microspheres. These data were collected over the course of several days. For each temperature, the estimated dose for 50% probability of laser-induced microcavitation bubble formation () was determined through the statistical method of Probit analysis, which is the standard technique for ascribing threshold values.15,16 The radiant exposure () is computed by Eq. (1), where is the energy per pulse and is the Gaussian beam diameter. Uncertainties in the experimental measurements were taken into account and include combined experimental measurements and instrumentation error. These result in the total uncertainty for the radiant exposure values and resulted in 20% uncertainty for 532 nm melanosome data, 23% total uncertainty for 1064 nm melanosome data, and 20% uncertainty for the polystyrene microspheres.3.2.ModelingA first-order estimate of the melanosome absorption coefficient, , as a function of threshold radiant exposure, , measured at melanosome temperature , can be obtained using the equation of Brinkmann.3 where is the melanosome specific heat, is the melanosome density, and is the threshold temperature for bubble formation in the absence of irradiation, that is, the nucleation temperature. The melanosome specific heat and particle density are and , determined from Ref. 2. All threshold radiant exposures used in Eq. (2) to calculate absorption coefficients, both in this work and in our previous studies,12,13 were those measured at an ambient temperature of . Model parameters (found in Table 6) for the microspheres were also used to determine absorption coefficients from the radiant exposure threshold values measured as a function of temperature.In our previous studies,12,13 an estimated threshold temperature (or nucleation temperature) of was used to calculate both visible and NIR absorption coefficients. This value was based on the temperature-dependent, ns pulse, 532-nm melanosome microcavitation studies of Neumann and Brinkmann2 and Kelly.11 Hereafter, we will refer to absorption coefficients calculated in this way as being calculated by method A. The visible pulse nucleation temperature was used to calculate absorption coefficients in the NIR because, at the time, no temperature-dependent NIR data were available. Thus, providing temperature-dependent data at 1064 nm was one of the primary reasons for performing this study. Later, we recalculate the visible absorption coefficients using the 532 nm nucleation temperatures obtained from the current temperature-dependent study and the NIR absorption coefficients using the 1064 nm nucleation temperatures. We refer to these values as being calculated by method B. 4.Results and Discussion4.1.Melanosome Absorption Coefficients (Method A)Table 1 summarizes the wavelength-dependent (532 to 1540 nm) data from our previous studies, including the values, upper and lower fudicial limits (FL), Probit slopes, and (method A) melanosome absorption coefficients, where represents data from Ref. 12 and represents data from Ref. 13. Estimated uncertainties for the melanosome absorption coefficients were also determined based on the combined experimental threshold error and the uncertainty in the 532-nm threshold temperature () range reported by various authors.2,3,8,11 The wavelength-dependent threshold data in Table 1, along with our newly determined 532 and 1064 nm nucleation temperatures, will be used later to calculate the method B absorption coefficients for comparison to the method A values listed here. Table 1A comparison of the experimental ED50 with the melanosome absorption coefficients (μm) (method A) as a function of wavelength from 532 to 1540 nm. The upper and lower FLs are the 95% confidence intervals. Probit slopes at each wavelength are also reported.
4.2.Temperature-Dependent Thresholds for MicrocavitationData collection occurred over several days, and the individual data trials were combined into a single file for Probit analysis. Table 2 summarizes the temperature-dependent Probit threshold data for the combined trials for bovine melanosomes at 532 and 1064 nm. Uncertainties in the experimental measurements were taken into account in order to determine the total uncertainty for the average radiant exposure value of 20 to 23%. These data illustrate the trend of decreasing threshold as a function of increasing temperature. Table 3 summarizes the temperature-dependent Probit threshold data for the combined trials for the polystyrene microspheres at 532 nm. Table 2Combined trials of temperature-dependent Probit cavitation threshold data for single 10 ns pulse exposures of bovine melanosomes at 532 and 1064 nm. The ED50 is given as average radiant exposure and indicates a decrease in radiant exposure threshold with increasing temperature.
Table 3The combined trials for the polystyrene microspheres (listed by diameter) at 532 nm from 20 to 65°C. In each case, the radiant exposure threshold decreases with increasing temperature.
4.3.Nucleation TemperatureFigure 3 shows a plot of the temperature dependence for the onset of melanosome microcavitation. By extrapolating the fit to the temperature axis (zero input radiant exposure), the nucleation temperature was determined. The temperature intercept was () for 532 nm and () for 1064 nm. Least-squares analysis was performed to determine the uncertainties in the slope and intercept between the trials of data taken on different days in order to determine the total uncertainty in the temperature intercept. The nucleation temperatures calculated at 532 and 1064 nm are statistically different. However, both of these nucleation temperatures fall within the range (136 to 150°C) and uncertainty of previously reported data at 532 nm.2,3,8,11 Fig. 3Temperature-dependent cavitation threshold measurements for isolated melanosomes irradiated by 10-ns pulses at 532 or 1064 nm. The cavitation threshold decreases with increasing ambient temperature, and the nucleation temperature () is indicated at each wavelength. The error bars represent the upper and lower 95% fiducial confidence intervals.  The difference between the 532 and 1064 nm nucleation temperatures is an interesting, and somewhat unexpected, feature of our data that deserves some discussion. Logically, we would not expect the nucleation temperature, that is, the melanosome temperature that would produce cavitation in the absence of irradiation, to vary as a function of the irradiation wavelength. We would, however, expect it to vary with differing pulse durations, as seen in the work of Kelly,11 since the speed of heating and, hence, the speed of melanosome thermal expansion would influence the contribution of tensile stress to the cavitation process. The theoretical study of laser-induced bubble formation in the retina by Gerstman et al.6 states that the nucleation temperature for RPE melanosomes, in situ, should be somewhere between the standard temperature and pressure boiling point, 100°C, and the triple point of water, 374°C, varying with pulse duration and pressure of the surrounding fluid. From the more detailed theoretical study of Sun et al.,10 we see that theoretical calculation of the true nucleation temperature, or even of the granule temperature reached at the threshold radiant exposure for laser cavitation, is highly complex, involving simultaneous solution of many coupled differential equations and consideration of the coupled physical effects of shock wave expansion and bubble formation. Such a detailed theoretical calculation is beyond the scope of this experimental study, but we can give a simpler explanation of the data. The key is to recognize that the quantity we (and other researchers publishing in this area) have referred to as the “nucleation temperature” is in fact only the -axis intercept value produced by an extension of the linear fit to the linear portion ( to 80°C) of the temperature versus threshold plot. We would argue, however, that the plot will actually become nonlinear at temperatures approaching 100°C, due to heat of vaporization, tensile stress effects, and so forth. Thus, an extension of a linear fit to the linear portion of the curve does not necessarily give the true nucleation temperature. Since the -axis intercept temperature corresponds to zero radiant exposure, it is convenient to refer to this as an estimated nucleation temperature, but this is an approximation, and consistency between the intercept points for various data sets should probably not be expected. Figure 4 is a plot of the temperature dependence for the onset of microsphere microcavitation at three different diameters. The nucleation temperatures, as in Fig. 3, are determined by extrapolating the fit to the temperature axis. Table 4 summarizes the size (in radius) and nucleation temperatures of both the isolated bovine melanosomes and the polystyrene microspheres at 532 nm. Table 4Comparison of the nucleation temperatures for isolated bovine melanosomes and three different sizes of polystyrene microspheres determined at 532 nm.
Fig. 4Temperature-dependent cavitation threshold measurements for isolated polystyrene microspheres of three different diameters, irradiated by single, 10-ns pulses at 532 nm. The cavitation threshold decreases with increasing ambient temperature, and the nucleation temperature () for each microsphere is indicated on the graph. The error bars represent the upper and lower 95% fiducial confidence intervals.  4.4.Melanosome Absorption Coefficients (Method B)In the current study, melanosome absorption coefficients at 532 and 1064 nm were calculated from Eq. (2), using the radiant exposure thresholds at found in Table 2, and the extrapolated 532 and 1064 nm nucleation temperatures found in Fig. 3. In addition, the nucleation temperature of 1064 nm was used to re-estimate absorption coefficients at other NIR wavelengths from 800 to 1319 nm, based on the 20°C NIR threshold data published in our previous studies12,13 and summarized earlier in Table 1. Table 5 lists the calculated absorption coefficients (method B values) based on the nucleation temperatures of 116 and 184°C at 532 and 1064 nm, respectively. As previously discussed, uncertainties in the coefficients are based on a combination of the threshold experimental error, instrumental uncertainties, and uncertainties in the calculated nucleation temperatures. In the NIR, the current values are slightly higher than previous (method A) estimates but still within the ranges reported in the literature. Table 5 also includes the RPE layer absorption coefficients based on a fit to data extrapolated from Birngruber et al.17 Table 5Comparison of the absorption coefficients (μm) of the RPE layer from Ref. 17 and melanosomes as a function of wavelength. The melanosome absorption coefficients at 532 and 1064 nm were determined from the estimated nucleation temperatures, and the estimated 1064-nm nucleation temperature of 184°C was used to determine values from 800 to 1319 nm (method B). The estimated uncertainty of 20 to 23% is the result of combined experimental ED50 error associated with the measurement.
Figure 5 shows the comparison of the two sets of calculated absorption coefficients, plotted on log scale, where method A represents the previously reported values from Schmidt et al.12,13 listed in Table 1, and method B represents the current estimates found in Table 5. Figure 5 also compares the melanosome and RPE layer coefficients, along with those of water, where the RPE layer values are based on a fit to data extrapolated from Ref. 17. The estimated uncertainty for the melanosome absorption coefficients is the result of the combined experimental threshold error and the uncertainty in the threshold temperature for bubble formation () measurements. Fig. 5Comparison of water absorption coefficients, the RPE absorption coefficients from Ref. 17 at 532 to 1600 nm, melanosome absorption coefficients (method A) from previous estimates in Refs. 12 and 13, and current estimated melanosome values calculated from temperature-dependent measurements (method B). The error bars associated with methods A and B are from the combined experimental threshold error and the uncertainty in the threshold temperature for bubble formation () measurements. Although the magnitude is different between RPE and melanosome coefficients, the overall relative trend of decreasing value with increasing wavelength is observed.  As discussed in our previous study,13 only a small fraction of the RPE layer volume is occupied by highly absorbing melanosomes; the bulk is primarily water, which is weakly absorbing in the visible and NIR. Thus, the granular absorption coefficients are higher than the corresponding RPE layer values over this wavelength range, but the data trends are similar. Furthermore, the newly estimated granular absorption coefficients (method B), determined from the new extrapolated nucleation temperatures, closely match the previously reported coefficients (method A). These results also show that both absorption coefficient values, estimated from methods A and B, fall within the range (2300 to ) of previously reported values found in the literature.2,4,8,18 4.5.MicrospheresMany researchers have studied laser-induced microcavitation around melanosomes due to the obvious connection to short-pulse ocular and skin damage. Microcavitation thresholds and optical properties of inorganic microspheres composed of gold, magnetic silica, and polystyrene have also been studied,2,4,19 partly for comparison with melanosome microcavitation, and partly in support of biomedical applications in which laser-induced bubble formation about implanted microparticles is used in selectively killing cancer cells.4 Jeong and Lee19 explored the absorption coefficients, absorption cross-sections, and absorption efficiencies of micron- and submicron-diameter black-dyed polystrene microspheres, similar to those used in our study. Table 6 lists some material properties of melanosomes, polystyrene, and water at . In addition to the radii of the particles, the density, and the specific heat, the last two columns list the thermal diffusivity and the thermal relaxation time of the particles. Values for melanosomes and water come from Ref. 2, and polystyrene data are from the manufacturer, Polysciences Inc. Table 6Melanosome, polystyrene, and water properties at T=20°C.
Using Eq. (2), polystyrene material properties from Table 6, the polystyrene microcavitation thresholds at from Table 3, and the polystyrene nucleation temperatures from Table 4, we can now calculate the estimated (532 nm) polystyrene absorption coefficient, . For the three diameters of polystyrene microspheres, we obtain (), (), and (). These calculated values are listed in Table 7 along with the corresponding 532-nm melanosome value (), which would appear to indicate that melanin is a better absorber of visible light than black polystyrene. Table 7Absorption coefficients and absorption efficiency (Qabs) calculated from damage thresholds as a function of temperature for melanosomes (μm) and polystyrene (μp).
Another optical property of interest that is frequently calculated in the microparticle studies2,19 is the optical absorption efficiency, , given for spherical microparticles by the ratio of the absorption cross-section to the geometric cross-section of the sphere.2 For optically thin particles (), the absorption efficiency can be approximated using where is the radius of the spherical particle and is the particle absorption coefficient.2 Using the absorption coefficients and radii in Table 7, the (532 nm) absorption efficiencies of the various particles have also been calculated and listed. Mie scattering theory predicts that absorption efficiency will rise with larger particle size,19 as indicated by our results. Increased absorption efficiency for the largest () microspheres also explains their lower cavitation thresholds, as listed in Table 3, and their increased (effective) absorption coefficient, listed in Table 7.5.ConclusionTemperature-dependent measurements of melanosome microcavitation average radiant exposure thresholds were performed for ns-pulse exposures at 532 and 1064 nm. Data at both wavelengths showed a linear decrease in threshold values with increasing temperature from 20 to 85°C. These findings are the first temperature-dependent cavitation threshold measurements performed at 1064 nm. Temperature-dependence data in the visible were consistent with results reported by other authors at 532 nm. In addition, melanosome absorption coefficients in the visible and NIR were estimated using the nucleation temperatures determined from the linear regression of the 532- and 1064-nm measurements. The resulting values fall within the range of melanosome absorption coefficients estimated in our previous research, and the data trends in the NIR are similar to the RPE layer absorption coefficients reported in the literature. Temperature-dependent microcavitation studies, for 532-nm, ns-pulse exposures, were also performed for three different sizes of black-dyed polystyrene microspheres. The results showed lower absorption in polystyrene than in melanin, and dimensionally larger absorbers showed increased absorption efficiency, as predicted by Mie scattering theory. These results help to increase our understanding of melanosome microcavitation as a short-pulse, threshold-level retinal damage mechanism. AcknowledgmentsThis research was supported by an appointment to the Postgraduate Research Participation Program at U.S. Air Force Research Laboratory, 711th Human Performance Wing, Bioeffects Division, Optical Radiation Bioeffects Branch, administered by the National Research Council, and Engility Corporation, contract FA8650-14-D-6519. ReferencesC. P. Lin and M.W. Kelly,
“Cavitation and acoustic emission around laser-heated microparticles,”
Appl. Phys. Lett., 72
(22), 2800
–2802
(1998). http://dx.doi.org/10.1063/1.121462 APPLAB 0003-6951 Google Scholar
J. Neumann and R. Brinkmann,
“Boiling nucleation on melanosomes and microbeads transiently heated by nanosecond and microsecond laser pulses,”
J. Biomed. Opt., 10
(2), 024001
(2005). http://dx.doi.org/10.1117/1.1896969 JBOPFO 1083-3668 Google Scholar
R. Brinkmann et al.,
“Origin of retinal pigment epithelium cell damage by pulsed laser irradiance in the nanosecond to microsecond time regimen,”
Lasers Surg. Med., 27
(5), 451
–464
(2000). http://dx.doi.org/10.1002/1096-9101(2000)27:5<451::AID-LSM1006>3.0.CO;2-1 LSMEDI 0196-8092 Google Scholar
C. P. Lin et al.,
“Selective cell killing by microparticle absorption of pulsed laser radiation,”
IEEE J. Sel. Topics Quantum Electron., 5
(4), 963
–968
(1999). http://dx.doi.org/10.1109/2944.796318 IJSQEN 1077-260X Google Scholar
B. A. Rockwell, R. J. Thomas and A. Vogel,
“Ultrashort laser pulse retinal damage mechanisms and their impact on thresholds,”
Med. Laser Appl., 25 84
–92
(2010). http://dx.doi.org/10.1016/j.mla.2010.02.002 Google Scholar
B. S. Gerstman et al.,
“Laser-induced bubble formation in the retina,”
Laser Surg. Med., 18 10
–21
(1996). http://dx.doi.org/10.1002/(SICI)1096-9101(1996)18:1<10::AID-LSM2>3.0.CO;2-U Google Scholar
J. Roegener, R. Brinkmann and C. P. Lin,
“Pump-probe detection of laser-induced microbubble formation in retinal pigment epithelium cells,”
J. Biomed. Opt., 9
(2), 367
–371
(2004). http://dx.doi.org/10.1117/1.1646413 JBOPFO 1083-3668 Google Scholar
J. Neumann and R. Brinkmann,
“Nucleation dynamics around single microabsorbers in water heated by nanosecond laser irradiation,”
J. Appl. Phys., 101 114701
(2007). http://dx.doi.org/10.1063/1.2740348 JAPIAU 0021-8979 Google Scholar
B. J. Lund et al.,
“Laser-induced retinal damage threshold for repetetive-pulse exposure to pulses,”
J. Biomed. Opt., 19
(10), 105006
(2014). http://dx.doi.org/10.1117/1.JBO.19.10.105006 JBOPFO 1083-3668 Google Scholar
J. M. Sun, B. S. Gerstman and B. Li,
“Bubble dynamics and shock waves generated by laser absorption of a photoacoustic sphere,”
J. Appl. Phys., 88 2352
–2362
(2000). http://dx.doi.org/10.1063/1.1288507 JAPIAU 0021-8979 Google Scholar
M. W. Kelly,
“Intracellular cavitation as a mechanism of short-pulse laser injury to the retinal pigment epithelium,”
Tufts University,
(1997). Google Scholar
M. S. Schmidt et al.,
“Trends in melanosome microcavitation thresholds for nanosecond pulse exposures in the near infrared,”
J. Biomed. Opt., 19
(3), 035003
(2014). http://dx.doi.org/10.1117/1.JBO.19.3.035003 JBOPFO 1083-3668 Google Scholar
M. S. Schmidt et al.,
“Trends in nanosecond melanosome microcavitation up to 1540 nm,”
J. Biomed. Opt., 20
(9), 095011
(2015). http://dx.doi.org/10.1117/1.JBO.20.9.095011 JBOPFO 1083-3668 Google Scholar
A. E. Dontsov, R. D. Glickman and M. A. Ostrovsky,
“Retinal pigment epithelium pigment granules stimulate the photo-oxidation of unsaturated fatty acids,”
Free Radic. Biol. Med., 26
(11–12), 1436
–1446
(1999). http://dx.doi.org/10.1016/S0891-5849(99)00003-9 FRBMEH 0891-5849 Google Scholar
C. P. Cain, L. Manning and G. D. Noojin,
“A comparison of various probit methods for analyzing yes/no data on a log scale,”
San Antonio
(1996). Google Scholar
D. J. Finney, Probit Analysis, Cambridge University Press, New York
(1971). Google Scholar
R. Birngruber, F. Hillenkamp and V. P. Gabel,
“Theoretical investigations of laser thermal retinal injury,”
Health Phys., 48 781
–796
(1985). http://dx.doi.org/10.1097/00004032-198506000-00006 HLTPAO 0017-9078 Google Scholar
R. D. Glickman et al.,
“Revisiting the internal absorption coefficient of the retinal pigment epithelium melanosome,”
Proc. SPIE, 4257 134
(2001). http://dx.doi.org/10.1117/12.434697 PSISDG 0277-786X Google Scholar
Y. K. Jeong and J. Lee,
“Optical properties of polystyrene black dyed microspheres,”
Curr. Appl. Phys., 12 S76
–S79
(2012). http://dx.doi.org/10.1016/j.cap.2012.02.024 1567-1739 Google Scholar
|


