|
|
1.IntroductionOvarian cancer accounts for more deaths than any other type of gynecological cancer. The low survival rate is mainly attributed to the late stage of detection (mainly stage III and IV) and lack of effective early screening and diagnostic techniques. Prophylactic oophorectomy (PO), which is currently accepted as the standard procedure for high-risk women, has been found to reduce the risk of ovarian cancer by more than 50%.1,2 Unfortunately, the mortality rate for women undergoing premenopausal oophorectomy seems to have considerably increased.3 Thus, there is an urgent need to develop more sensitive tools for effective evaluation of the ovary during minimally invasive surgery and reduce unnecessary surgeries. More than 90% of ovarian cancers occur at the epithelial layer on the outer surface of the ovary. Photoacoustic imaging (PAI) and optical coherence tomography (OCT) have been previously explored to evaluate the vasculature and collagen content of the intact ovary.4,5 While PAI reveals high-resolution vascular distribution of the ovary, it can provide only a qualitative estimate and lacks tissue scattering information. Likewise, OCT requires extensive scanning in order to cover the entire ovary and also lacks information related to tissue absorption. Spatial frequency domain imaging (SFDI) is an emerging modality with the potential for noncontact, rapid evaluation of ovarian tissue optical properties, e.g., absorption and scattering, over a large field of view (FOV).6–8 Additionally, spatial heterogeneity of the tumor tissue has been found to be a useful marker for diagnosis and differentiation between benign and malignant pathologies.9,10 We report in this paper, to the best of our knowledge, the first study of utilizing an SFDI system to quantitatively characterize the optical properties and their spatial heterogeneity in human ovarian tissue over a large FOV. A total of 15 ovarian tissue samples from nine patients were studied ex vivo. Twenty spatial frequencies ranging from 0 to were projected on the samples from a digital projector and captured by a camera. Wide-field absorption and scattering maps were estimated for the samples. Normalized Radon transforms of the absorption and scattering images were calculated from 0 to 90 deg and fitted to a Gaussian distribution function. The standard deviation (SD) and mean square Gaussian fitting error were used to characterize the spatial distribution and heterogeneities of the absorption and scattering maps of the tissue samples. 2.Methods2.1.Spatial Frequency Domain Imaging InstrumentationThe configuration of the SFDI imaging system is shown in Fig. 1. Sinusoidal patterns were projected using an automated Microsoft PowerPoint presentation, from a DLP projector (XD430U, Mitsubishi) consisting of a 0.55-in. single-chip digital micro mirror device and a 230-W Tungsten Halogen lamp. The RGB color wheels were removed to provide uniform illumination on the sample. The projector was turned on for 10 min before the experiments for stabilizing the source. The diffuse reflected light was captured by a camera (Edmund Optics USB EO-0413M 1/3” CMOS Monochrome, 8 bit, , dynamic range linear) synchronized with the projection system and capable of imaging up to 87 frames per second. The illumination area was , while the FOV captured by the camera was . The tissue samples were placed with respect to the camera in a way to cover most of the FOV to avoid light leakage from the sides. A laser line filter (Thorlabs FL730-10, CW 730 nm, ) was attached to the camera. The specular reflection was minimized by using two crossed linear polarizers (Edmund Optics, polarization efficiency ), and a small angle of incidence (15 deg to the normal).11 Previous studies on spectroscopic characterization of human ovarian tissue have been performed mainly in the wavelength range of 390 to 600 nm by Utzinger et al.12 using reflectance spectroscopy, and 700 to 900 nm by Aguirre et al.4 using photoacoustic tomography, but both studies are limited in providing the absolute quantitative values of tissue absorption and scattering. As an initial pilot study, the wavelength of 730 nm was selected, mainly because of previous extensive knowledge and data of malignant and benign ovarian tissue absorption or vasculature obtained from photoacoustic tomography studies in this wavelength range.4,13 Also, this wavelength was available for comparison of accuracy of phantoms from our previous frequency domain (FD) diffuse light imaging system.14 The overall acquisition time was , which makes the system suitable for ex vivo evaluation of the ovary. To minimize the effect of ambient light, the system was located in a dark room, and the laser line filter attached to the camera accepted only narrowband illumination. The sinusoidal illumination pattern can be expressed as where is the incident source intensity, is the spatial frequency, and α is the phase. Three phase-shifted images (, and ) were recorded (, 120 deg, and 240 deg) for each frequency, and the demodulated DC and AC components were obtained by the formula7 However, term is affected by the system noise from the dark current as well as the ambient light. Hence, the frequency-dependent component was calculated for each spatial frequency to cancel out the common mode system noise and calibrated with a phantom of known optical properties using the forward light transport model to yield measured reflectance . The distance between the camera and the reference phantom was adjusted to be 12 cm, while for imaging the phantom and tissue samples, the height offset was carefully adjusted with a three-dimensional (3-D) stage to within 1 mm, which had a negligible scaling effect on the measured diffuse reflectance.15,16 The penetration depth in the spatial FD depends on the effective attenuation coefficient and the spatial frequency , where , with higher frequencies probing a shallower depth.7,11 As mentioned in the introduction, the majority of ovarian cancer occurs at the epithelial layer surrounding the ovarian tissue, which is only couple of millimeters in thickness. Additionally, while imaging fresh, surgically resected tissue samples, the blood on the surface of the tissue can suppress the scattering features, arising mainly from the underlying connective tissues. It has been demonstrated by Krishnaswamy et al.17 that the underlying tissue scattering amplitude, which is sensitive to the tissue ultrastructure, can be effectively determined with the use of higher spatial frequencies (). For our system calibration with the phantoms, both 2-frequency (0 and ) and 20-frequency (0 to ) methods were compared for the system calibration, as shown in Table 1.Table 1Comparison of SFDI system with FD measurements.
2.2.System Calibration and Phantom StudyThe SFDI system was calibrated using six tissue-mimicking solid phantoms (five phantoms as samples and one as reference) with known optical properties calculated from measurements with an existing FD diffuse light imaging system.14 The phantoms were made by gradually heating polyvinyl chloride-plastisol solution with India ink and titanium dioxide powder added for controlling the absorption and scattering properties. The heated solution was poured into a flat-top glass container and allowed to solidify for several hours. The coefficients and for each pixel were obtained by minimizing the least square between the measured and theoretical diffuse reflectance values by using the Levenberg–Marquardt algorithm in MATLAB.7,18 For each absorption and scattering map, the mean value was calculated and used to represent the average level of the absorption and scattering of the image. The comparison between the absorption and reduced scattering coefficients calculated from the SFDI system for 2-frequency and 20-frequency measurements with previously measured values are provided in Table 1. The reference phantom (phantom 6) was calibrated with 10% intralipid solution of known optical properties.19 For each phantom, the measurement was repeated five times, and the statistical average was taken. Figure 2 shows the comparison between the experimentally measured absorption and scattering values for the 2-frequency and 20-frequency SFDI experiments with the previously calibrated values from the FD system. It can be observed in Table 1 that although 2-frequency and multifrequency methods are comparable, the multifrequency method produces more stable measurements with fewer errors. For our pilot clinical study, the multifrequency method was used for comprehensive characterization of human ovarian tissue. 2.3.Human Ovary StudyHuman ovarian tissue samples were obtained from patients undergoing PO at the University of Connecticut Health Center (UCHC). This study was approved by the Institutional Review Boards of UCHC, and informed consent was obtained from all patients. The overall imaging was completed within 1 to 2 h from the time of surgery to avoid excessive blood loss and changes in physiological properties. During the surgery, ovaries were surgically cut from the side of the fallopian tube so as to leave no incision mark on the ovary surface that might affect the reflection measurements. All ovarian tissue samples were imaged intact with thickness in the range of 2 to 5 cm, and the illumination was diffused so the penetration of light through the sample was not a concern. The samples were placed on a 3-D stage and carefully adjusted to avoid any tilt that might induce errors. Fifteen ex vivo ovaries (eight premenopausal, seven postmenopausal, which included five normal and two malignant) from nine patients were studied; the diagnostic details are provided in Table 2. There were no cases of premenopausal malignancy or benign tumor in our sample pool. Several nonoverlapping reflectance images () were acquired for each ovary, depending on the size of the sample. The images were then divided into nonoverlapping regions of interest (ROI) measuring , as shown by the black dashed area in Fig. 4, for taking the Radon transform and extracting the features. This resulted in a total of 22 ROI for the premenopausal normal group, 17 ROI for postmenopausal normal, and five ROI for the malignant group. The ROIs were selected in a way so as not to include the edges of the tissues, which might introduce errors in the reflectance measurements. After the imaging, the ovaries were fixed in 10% formalin solution and returned to the pathology department for histological processing. The histology slides were stained using both hematoxylin and eosin (H&E) for diagnosis and sirius red (SR) for qualitative analysis of the collagen content inside the tissue,20 which is the main elastic scattering component in ovarian tissue.21 Figures 3(a) and 3(d) show the DC reflectance images of a postmenopausal benign and postmenopausal malignant sample. The H&E histology of the malignant ovary, shown in Fig. 3(e), is characterized by more randomly distributed microvessels as compared with the benign ovary, shown in Fig. 3(b). It is evident from the SR stained histology images, shown in Figs. 3(c) and 3(f), that the benign ovary consists of a dense collagen-rich stroma with homogeneous distribution, whereas the malignant ovarian tissue is characterized by a degenerated, scattered distribution of collagen bundles. The relative differences in the wide-field functional heterogeneities can be an effective imaging marker for the diagnosis of neoplastic changes. Table 2Patient information and diagnosis.
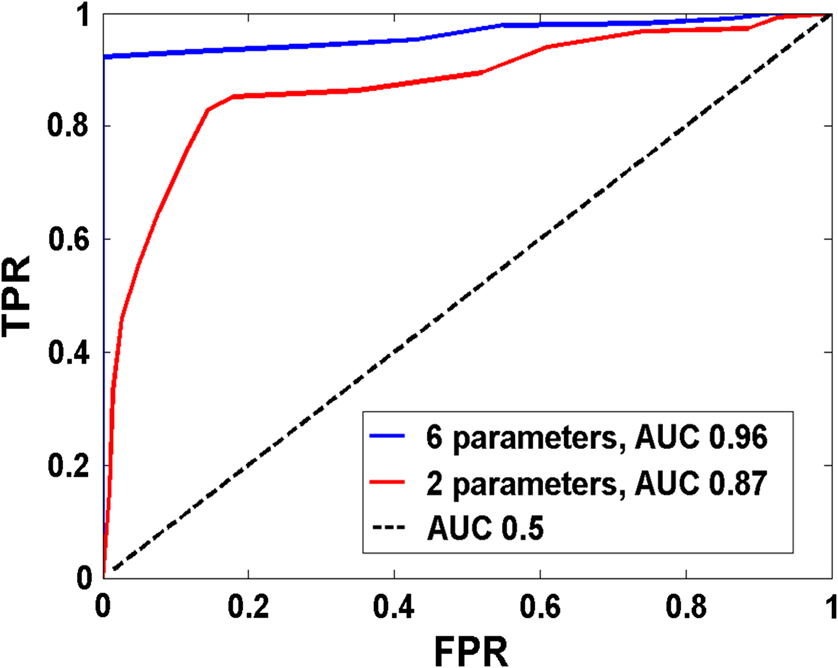
Fig. 3DC reflectance image of (a) postmenopausal normal and (d) postmenopausal malignant ovary; (b) and (e) boxed area showing the region from which corresponding H&E and (c) and (f) SR-stained histology images are acquired; arrows in (e) point to micro vessels; arrows in (f) show the degenerated collagen structure of the malignant ovarian stroma, as compared to the dense, homogeneous stroma of the normal ovary (c). 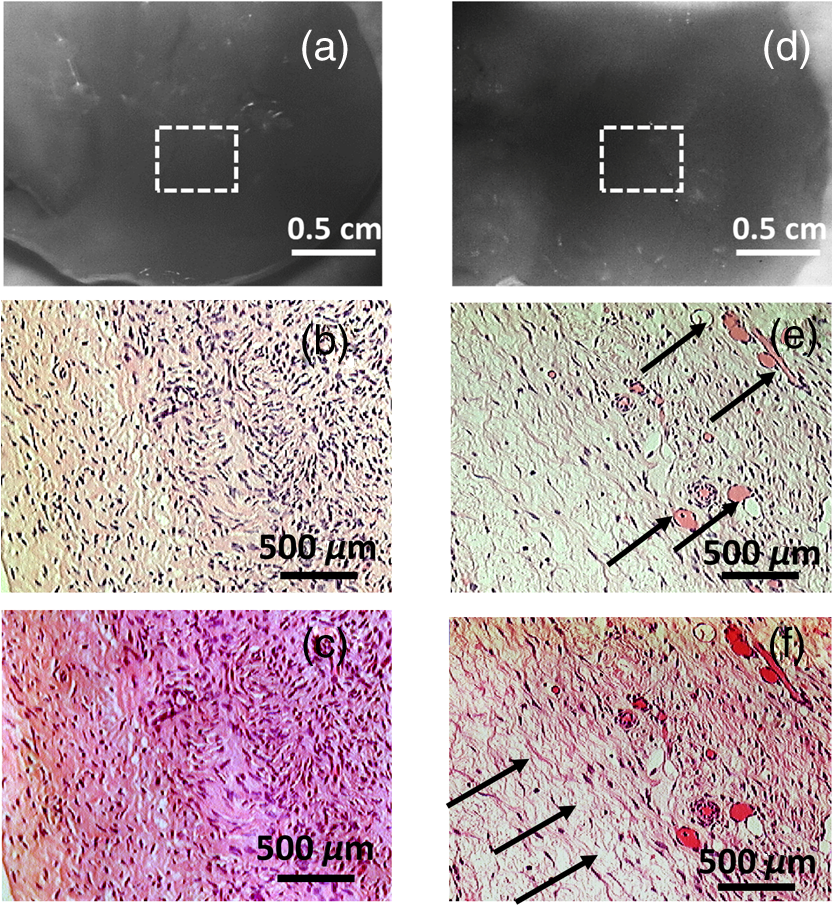 2.4.Extraction of Spatial Absorption and Scattering FeaturesSample images of normal and malignant ovaries along with the wide-field absorption and scattering maps are shown in Figs. 4(a)–4(l). The black dashed area represents the region from which the mean normalized Radon transform was computed, from 0 deg (-axis) to 90 deg (-axis) for both the absorption and scattering maps. The comparison of the absorption and scatter Radon transform from a normal and a malignant ovary is shown in Figs. 5(a)–5(d). The two-dimensional Radon transform of a function can be defined as where is the angle of the projection and is the projection axis of the Radon output. The details of this method can be found in Ref. 13. After calculating the mean normalized Radon transform, a Gaussian model was used for fitting In Eq. (5), is the index of the estimated centroid of the Gaussian function and is the SD of the Gaussian function, which characterizes the spatial extent of the image along the projection direction. The Gaussian fitting error was defined as the norm of the difference between the mean Radon transform and the fitting value of the Gaussian model, and was used to characterize the spatial heterogeneity of both absorption and scattering of the ovarian tissue.Fig. 4Photographs and absorption and scattering maps of (a)–(c) premenopausal normal ovary; (d)–(f) postmenopausal normal ovary; and (g)–(i) and (j)–(l) postmenopausal malignant ovaries. The black dashed areas represent where the Radon transform was computed. 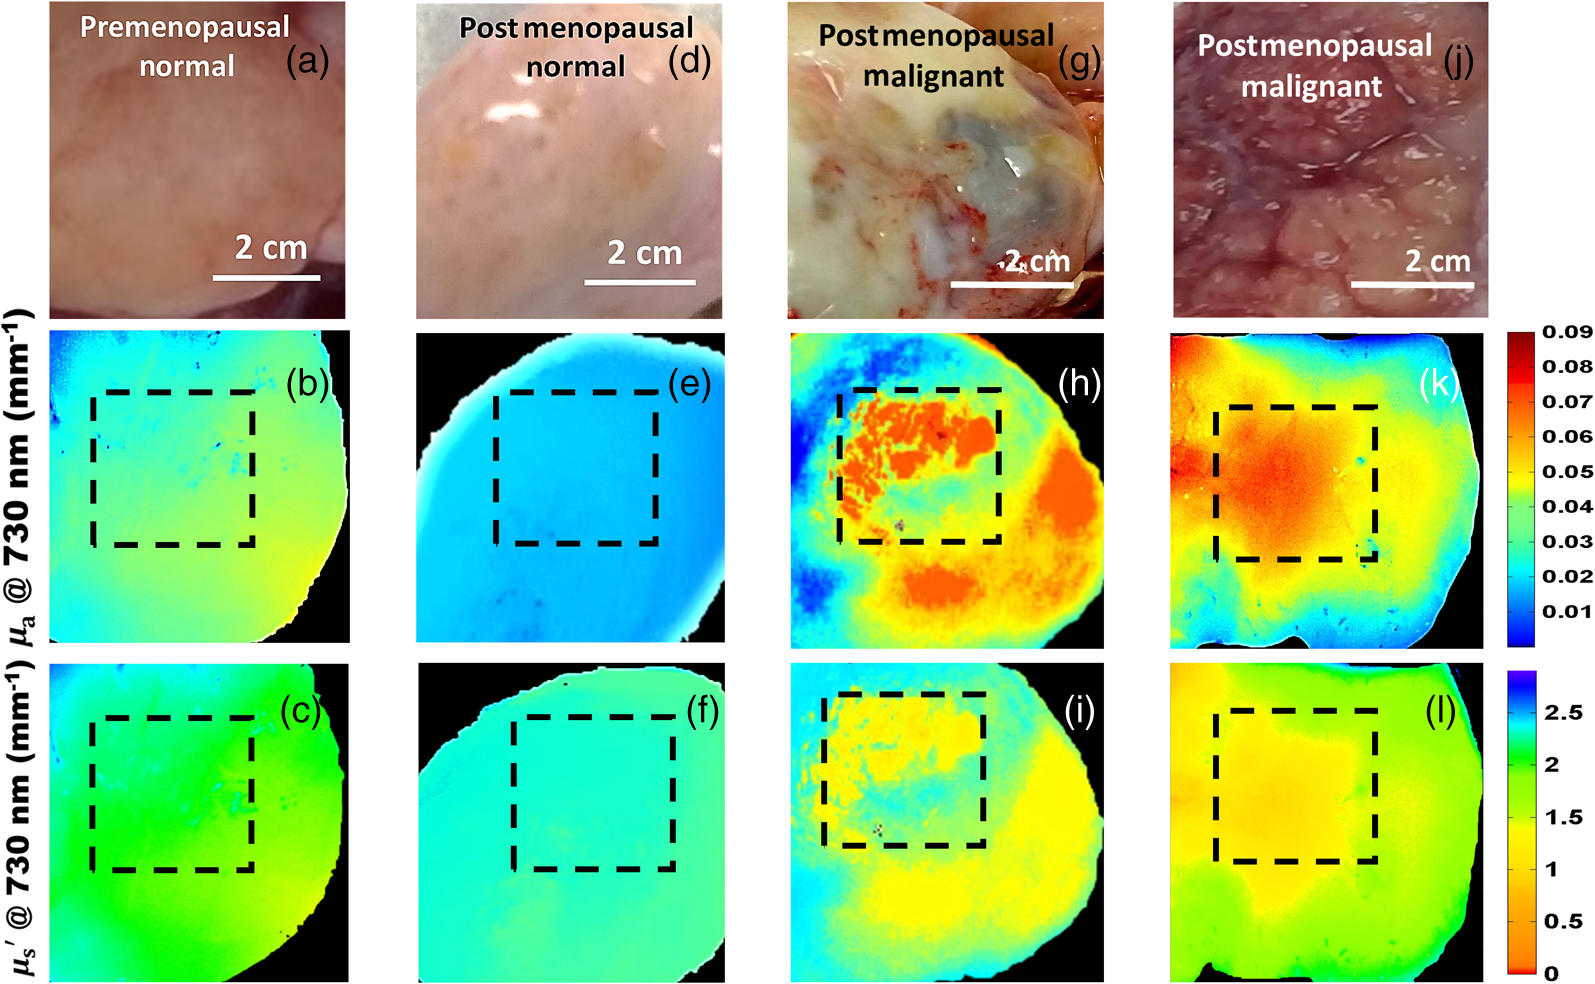 Fig. 5Normalized mean Radon transform profile and corresponding (a) and (b) Gaussian fitting of absorption corresponding to Figs. 3(e) and 3(k); (c) and (d) Gaussian fitting of scattering corresponding to Figs. 3(f) and 3(l).  2.5.Logistic Regression ModelLogistic regression is a direct probability model that can describe the relationship of several predictor variables to a binary response variable (0 or 1).22 The probability of occurrence of one of the two possible outcomes of can be described by the following equation: Given the data , the unknown coefficients , can be estimated using the maximum likelihood method. In this study, we used six predictors (mean absorption and scattering, and the Gaussian SD and fitting errors of both absorption and scattering images) to classify normal and malignant ovarian tissue groups. The MATLAB GLMFIT function was used to estimate the coefficients , of the logistic model using the predictors, and the GLMVAL function was used to estimate the responses for the testing sets. The same set of coefficients obtained from the training set was used to predict the response of the testing set, and a threshold of 0.5 was used for sensitivity and specificity estimation. A total of 42 ROIs from nonoverlapping areas (example shown with the black dashed area in Fig. 4) were acquired from 15 ex vivo ovaries (eight premenopausal, seven postmenopausal, which included five normal and two malignant based on pathological diagnosis) for computing the Radon transform and corresponding feature extraction. We followed the rule of thumb in machine learning, which is to have sufficient data to obtain an accurate estimate of the model, and to have tractable data to validate (test) the model. Thus we have chosen approximately two-thirds of the data for training the logistic model, and the rest was used for testing. For training, 27 ROI (24 from normal groups and three from the malignant group) were randomly selected from the dataset, and the remaining 15 were used for testing. Because malignant samples were limited, for each training and testing pair, three samples from this group were used in training and the rest were used for testing. A total of 20 cross-validations was used, and mean and SD were reported. The accuracy of the model was evaluated using the receiver operating curves (ROCs) and the area under the curve (AUC).3.Results and DiscussionFigure 6 shows the box plots and corresponding values of the different absorption and scattering parameters of the premenopausal normal, postmenopausal normal, and postmenopausal malignant ovarian tissue groups. It is evident from Fig. 6(a) that the malignant ovaries have the highest absorption due to increased angiogenesis. The postmenopausal group has the highest scattering amplitude, as shown in Fig. 6(d), which can be attributed to the reduced vascular activity and dense stromal structure, as shown in Fig. 3(c). The Gaussian SD, which characterizes the spatial extent of the absorption and scattering distributions, is lowest in the malignant cases for both absorption and scattering, as shown in Figs. 6(b) and 6(e); this is due to the clustering of the vasculature in the tumor area and degeneration of collagen structure, as shown in Figs. 3(e) and 3(f). The Gaussian fitting mean square error, characterizing the spatial heterogeneity, is highest for the malignant group, as shown in Figs. 6(c) and 6(f). The reason for this is the increased number of clustered microvessels and scattered distribution of collagen bundles. The premenopausal normal group has higher absorption and lower scattering as well as larger spatial functional variations as compared to the postmenopausal normal group; this is also due to higher follicular activity. Statistically significant differences in the Gaussian fitting SD of absorption () and scattering () were observed between the postmenopausal normal and malignant groups. The heterogeneity, characterized by the mean square fitting error, was also highly statistically significant for both absorption () and scattering () between the postmenopausal normal and malignant ovarian tissue. This can be extremely useful in differentiating between normal and malignant ovaries, as the majority of ovarian cancers occur in the postmenopausal stage. Fig. 6Boxplots of (a) mean absorption; (b) absorption Gaussian fitting SD; (c) absorption Gaussian fitting error; (d) mean scattering; (e) scatter Gaussian fitting SD; and (f) scatter Gaussian fitting error. 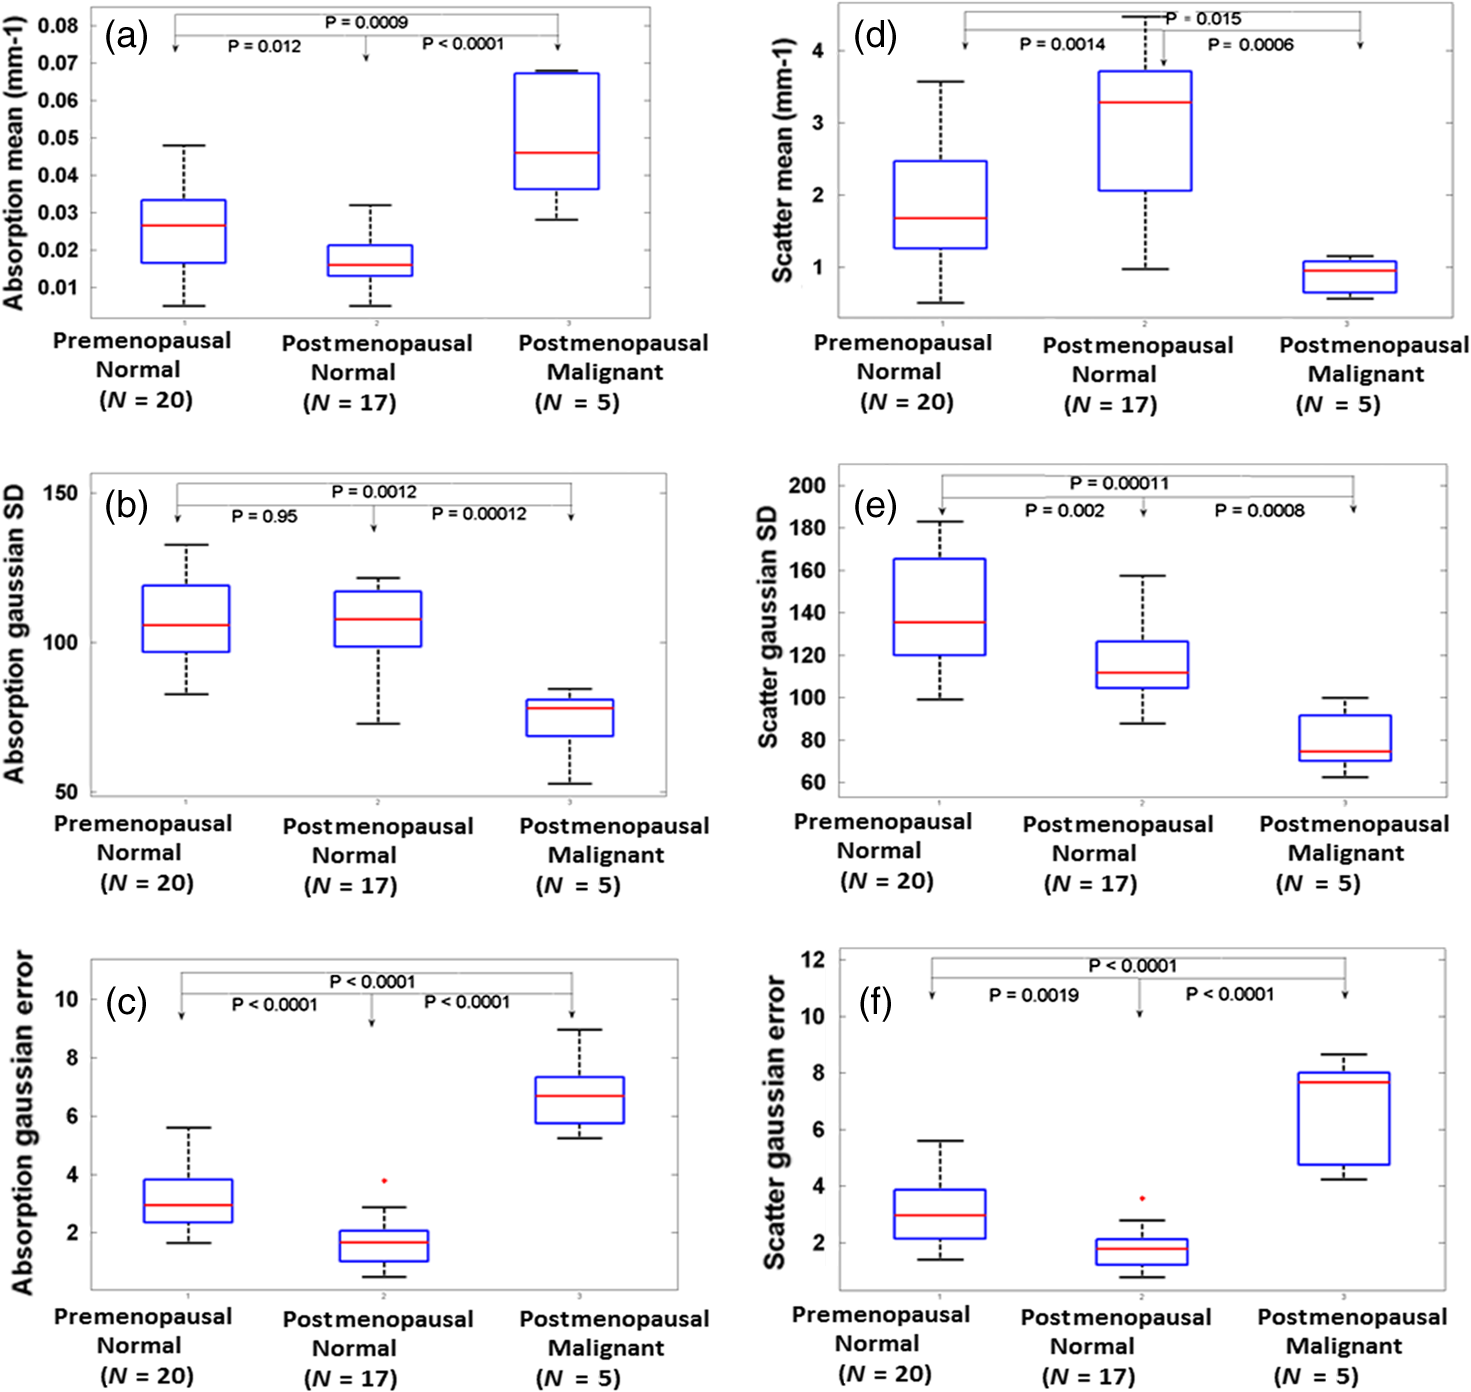 Although the imaging is done ex vivo, the time window between the surgery and imaging across all samples is within 1 to 2 h. It has been observed in previous studies by Alqasemi et al.13 and Wang et al.23 that the ovarian vasculature structure does not degrade considerably within this time window. Tissue sample studies performed by other groups showed similar results. Laughney et al.24 have performed detailed analysis of the functional absorption parameters from ex vivo lumpectomy samples and shown that the total hemoglobin concentration (estimated from absorption at two or more wavelengths) remains fairly consistent, while the oxygen saturation is affected significantly. However, some variation between the in vivo measurements and ex vivo measurements is expected, and future clinical studies may answer this important question. Yang et al.21 have shown for ovarian tissue samples and Bydlon et al.25 have shown for breast samples that the variation expected for the scattering coefficient due to excision is not a confounding factor, as it remains fairly consistent after excision and can be used as an important functional parameter. The scattering amplitude has been ranked to be the most important ex vivo diagnostic parameter in previous SFDI experiments for breast samples by Laughney et al.,24 and has also been established as an important functional marker for ovarian tissue by Yang et al.21 However, multispectral parameters, e.g., scattering slope and scatter power, may be advantageous in characterization of the tumor as well as providing additional information about the size and location of the scattering microstructures.16,24 The six parameters extracted from SFDI images were used as predictor variables, and the diagnosis results obtained from histopathology were used as the response variables. Figure 7 shows one example of ROCs obtained by using only two parameters (mean absorption and scattering) and all six parameters together. Using two parameters, an average sensitivity of 70% () and a specificity of 97% () were obtained, with the AUC value of 0.83 (). Using all six parameters, an average sensitivity and specificity of 95% () and 100.0% () were achieved, respectively, with an AUC of 0.98 (). The results indicate that the addition of the spatial heterogeneity of the optical properties can significantly improve the diagnostic performance of the SFDI for ovarian cancer detection. This work has several limitations. The training and testing results are based on a limited sample pool, and more data will need to be acquired to further enhance the validity of these initial but promising results. As an exploratory study, all the ovarian tissues were imaged ex vivo at 730-nm wavelength, based on our extensive knowledge and data of malignant and normal ovarian tissue absorption characteristics or vasculature obtained from photoacoustic tomography studies in this wavelength range. Also, the processing time and size of the setup, along with free space illumination, need to be taken into account for translating this technology to an operating room for clinical applications. Additionally, we did not perform any height correction for potential errors resulting from surface topology and curvature, which will need to be addressed for future studies.26 The ultimate goal is to provide a wide-field, real-time examination of the ovary as well as the fallopian tube for assisting surgeons during minimally invasive surgery and reducing unnecessary surgical procedures. Future work will focus on multispectral characterization of the functional heterogeneity of the ovarian tissue and miniaturization of the device for in vivo examination of the ovary during minimally invasive surgery. 4.SummaryIn this study, we used an SFDI system to image ovarian tissue samples ex vivo and quantitatively determined the wide-field optical absorption and scattering properties. Normalized mean Radon transform of the absorption and scattering maps were calculated and fitted with a Gaussian function. The SD and fitting errors of the absorption and scattering images were used to characterize the spatial extent and tissue functional heterogeneity, respectively. Significant differences in mean absorption, mean scattering, spatial distribution, and heterogeneity were observed between the premenopausal normal, postmenopausal normal, and malignant ovarian tissue groups. A sensitivity of 95%, specificity of 100%, and AUC of 0.98 were obtained using six parameters extracted from the SFDI images. The initial results indicate that wide-field absorption and scattering levels and spatial heterogeneities can be potentially useful for the characterization of ovarian tissues. Future studies will be focused on multispectral, real-time characterization of the human ovarian tissues, which can be extremely useful for in vivo inspection and diagnosis and therefore reduce unnecessary surgical procedures. AcknowledgmentsThis research was supported by NCI R01CA151570. The authors thank Hassan Salehi for helping with tissue samples, Karen Metersky for consenting patients, and Melissa Parente for coordinating the tissue sample study. ReferencesT. R. Rebbeck et al.,
“Prophylactic oophorectomy in carriers of BRCA1 or BRCA2 mutations,”
N. Engl. J. Med., 346
(21), 1616
–1622
(2002). http://dx.doi.org/10.1056/NEJMoa012158 NEJMAG 0028-4793 Google Scholar
N. D. Kauff et al.,
“Risk-reducing salpingo-oophorectomy in women with a BRCA1 or BRCA2 mutation,”
N. Engl. J. Med., 346
(21), 1609
–1615
(2002). http://dx.doi.org/10.1056/NEJMoa020119 NEJMAG 0028-4793 Google Scholar
W. A. Rocca et al.,
“Survival patterns after oophorectomy in premenopausal women: a population-based cohort study,”
Lancet. Oncol., 7
(10), 821
–828
(2006). http://dx.doi.org/10.1016/S1470-2045(06)70869-5 Google Scholar
A. Aguirre et al.,
“Potential role of coregistered photoacoustic and ultrasound imaging in ovarian cancer detection and characterization,”
Transl. Oncol., 4
(1), 29
–37
(2011). http://dx.doi.org/10.1593/tlo.10187 Google Scholar
T. Wang, M. Brewer and Q. Zhu,
“An overview of optical coherence tomography for ovarian tissue imaging and characterization,”
Wiley Interdiscip. Rev. Nanomed. Nanobiotechnol., 7
(1), 1
–16
(2015). http://dx.doi.org/10.1002/wnan.1306 Google Scholar
D. J. Cuccia et al.,
“Modulated imaging: quantitative analysis and tomography of turbid media in the spatial-frequency domain,”
Opt. Lett., 30
(11), 1354
–1356
(2005). http://dx.doi.org/10.1364/OL.30.001354 OPLEDP 0146-9592 Google Scholar
D. J. Cuccia et al.,
“Quantitation and mapping of tissue optical properties using modulated imaging,”
J. Biomed. Opt., 14
(2), 024012
(2009). http://dx.doi.org/10.1117/1.3088140 JBOPFO 1083-3668 Google Scholar
D. Yudovsky, J. Q. M. Nguyen and A. J. Durkin,
“In vivo spatial frequency domain spectroscopy of two layer media,”
J. Biomed. Opt., 17
(10), 107006
(2012). http://dx.doi.org/10.1117/1.JBO.17.10.107006 JBOPFO 1083-3668 Google Scholar
F. Davnall et al.,
“Assessment of tumor heterogeneity: an emerging tool for clinical practice?,”
Insights Imaging, 3
(6), 573
–589
(2012). http://dx.doi.org/10.1007/s13244-012-0196-6 Google Scholar
R. F. Schwartz et al.,
“Spatial and temporal heterogeneity in high-grade serous ovarian cancer: a phylogenetic analysis,”
PLoS Med., 12
(2), 1001789
(2015). http://dx.doi.org/10.1371/journal.pmed.1001789 1549-1676 Google Scholar
D. J. Cuccia et al.,
“Modulated imaging: quantitative analysis and tomography of turbid media in the spatial-frequency domain,”
Opt. Lett., 30 1354
–1356
(2005). http://dx.doi.org/10.1364/OL.30.001354 OPLEDP 0146-9592 Google Scholar
U. Utzinger et al.,
“Reflectance spectroscopy for in vivo characterization of ovarian tissue,”
Lasers Surg. Med., 28
(1), 56
–66
(2001). http://dx.doi.org/10.1002/1096-9101(2001)28:1<56::AID-LSM1017>3.0.CO;2-L Google Scholar
U. Alqasemi et al.,
“Recognition algorithm for assisting ovarian cancer diagnosis from coregistered ultrasound and photoacoustic images: ex vivo study,”
J. Biomed. Opt., 17
(12), 126003
(2012). http://dx.doi.org/10.1117/1.JBO.17.12.126003 JBOPFO 1083-3668 Google Scholar
C. Xu et al.,
“Ultrasound-guided diffuse optical tomography for predicting and monitoring neoadjuvant chemotherapy of breast cancers: recent progress,”
Ultrason. Imaging, 38
(1), 5
–18
(2015). http://dx.doi.org/10.1177/0161734615580280 ULIMD4 0161-7346 Google Scholar
N. Bodenschatz et al.,
“Sources of errors in spatial frequency domain imaging of scattering media,”
J. Biomed. Opt., 19
(7), 071405
(2014). http://dx.doi.org/10.1117/1.JBO.19.7.071405 JBOPFO 1083-3668 Google Scholar
A. M. Laughney et al.,
“Spectral discrimination of breast pathologies in situ using spatial frequency domain imaging,”
Breast Cancer Res., 15
(4), R61
(2013). http://dx.doi.org/10.1186/bcr3455 BCTRD6 Google Scholar
V. Krishnaswamy et al.,
“Structured light scatteroscopy,”
J. Biomed. Opt., 19
(7), 070504
(2014). http://dx.doi.org/10.1117/1.JBO.19.7.070504 JBOPFO 1083-3668 Google Scholar
T. Pham et al.,
“A broad bandwidth frequency domain instrument for quantitative tissue optical spectroscopy,”
Rev. Sci. Instrum., 71
(6), 2500
(2000). http://dx.doi.org/10.1063/1.1150665 RSINAK 0034-6748 Google Scholar
S. T. Flock et al.,
“Optical properties of Intralipid: a phantom medium for light propagation studies,”
Lasers Surg. Med., 12
(5), 510
–519
(1992). http://dx.doi.org/10.1002/lsm.1900120510 Google Scholar
W. Malkusch, B. Rehn and J. Bruch,
“Advantages of Sirius Red staining for quantitative morphometric collagen measurements in lungs,”
Exp. Lung Res., 21 67
–77
(1995). http://dx.doi.org/10.3109/01902149509031745 EXLRDA 0190-2148 Google Scholar
Y. Yang et al.,
“Optical scattering coefficient estimated by optical coherence tomography correlates with collagen content in ovarian tissue,”
J. Biomed. Opt., 16
(9), 090504
(2011). http://dx.doi.org/10.1117/1.3625247 JBOPFO 1083-3668 Google Scholar
D. Kleinbaum et al., Applied Regression Analysis and Other Multivariable Methods, 3rd ed.Duxbury Press, Pacific Grove, California
(1998). Google Scholar
T. Wang et al.,
“Characterization of ovarian tissue based on quantitative analysis of photoacoustic microscopy images,”
Biomed. Opt. Express, 4
(12), 2763
–2768
(2013). http://dx.doi.org/10.1364/BOE.4.002763 BOEICL 2156-7085 Google Scholar
A. M. Laughney et al.,
“System analysis of spatial frequency domain imaging for quantitative mapping of surgically resected breast tissues,”
J. Biomed. Opt., 18
(3), 036012
(2013). http://dx.doi.org/10.1117/1.JBO.18.3.036012 JBOPFO 1083-3668 Google Scholar
T. M. Bydlon et al.,
“Advancing optical imaging for breast margin assessment: an analysis of excisional time, cautery, and patent blue dye on underlying sources of contrast,”
PLoS One, 7 e51418
(2012). http://dx.doi.org/10.1371/journal.pone.0051418 POLNCL 1932-6203 Google Scholar
J. M. Kainerstorfer et al.,
“Direct curvature correction for noncontact imaging modalities applied to multispectral imaging,”
J. Biomed. Opt., 15
(4), 046013
(2010). http://dx.doi.org/10.1117/1.3470094 JBOPFO 1083-3668 Google Scholar
|