|
|
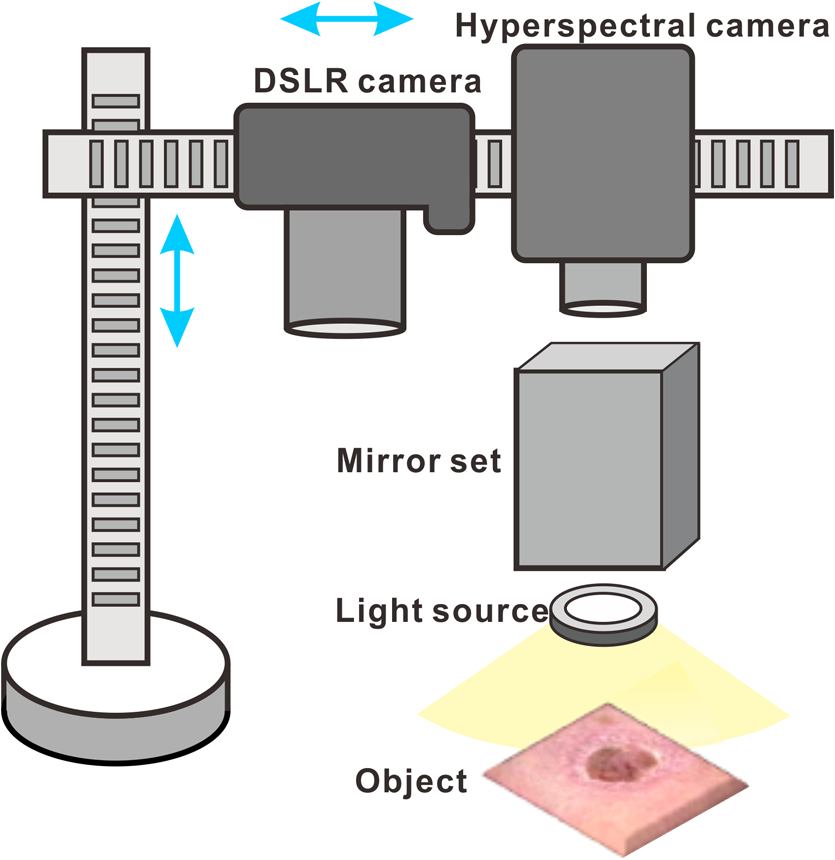
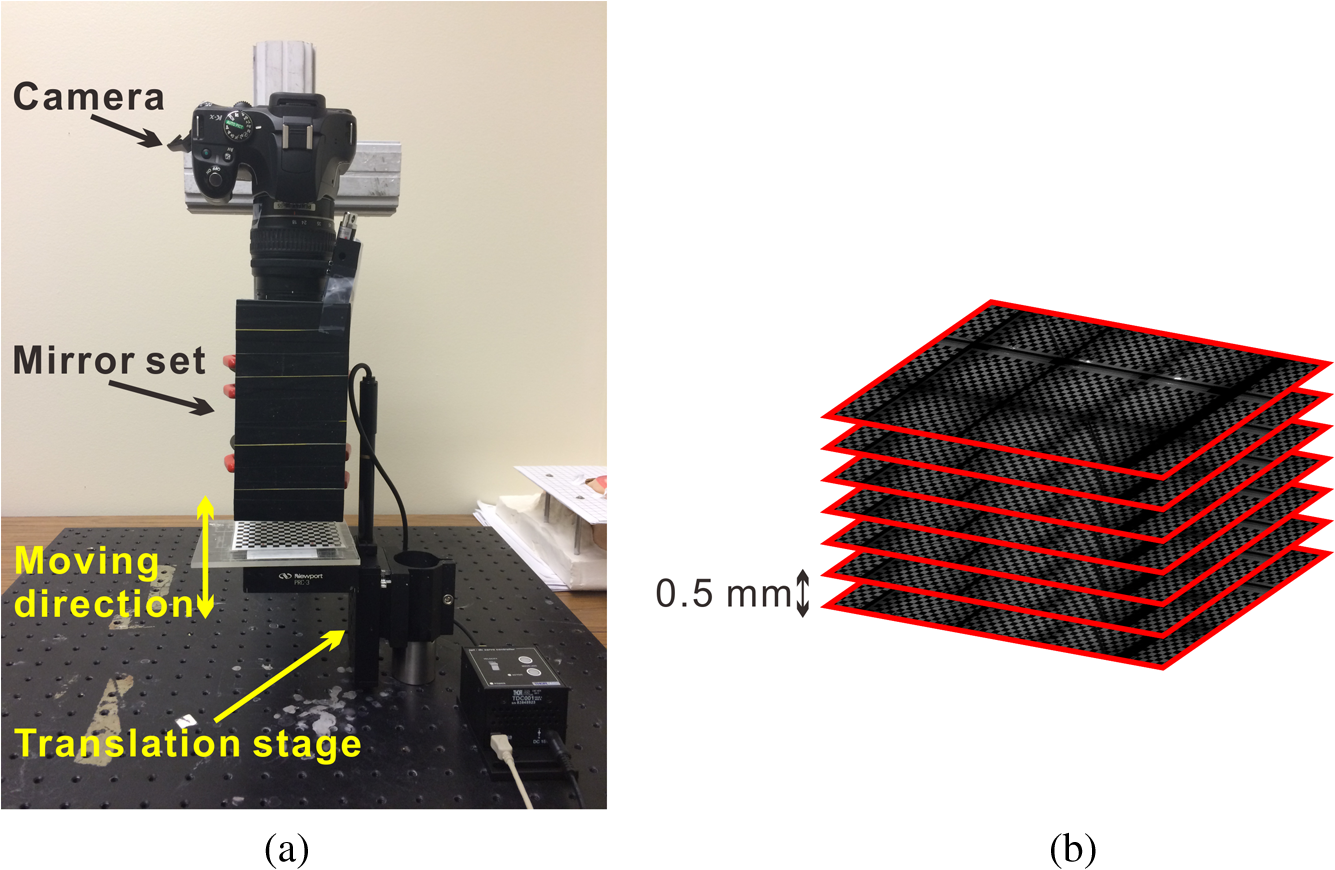
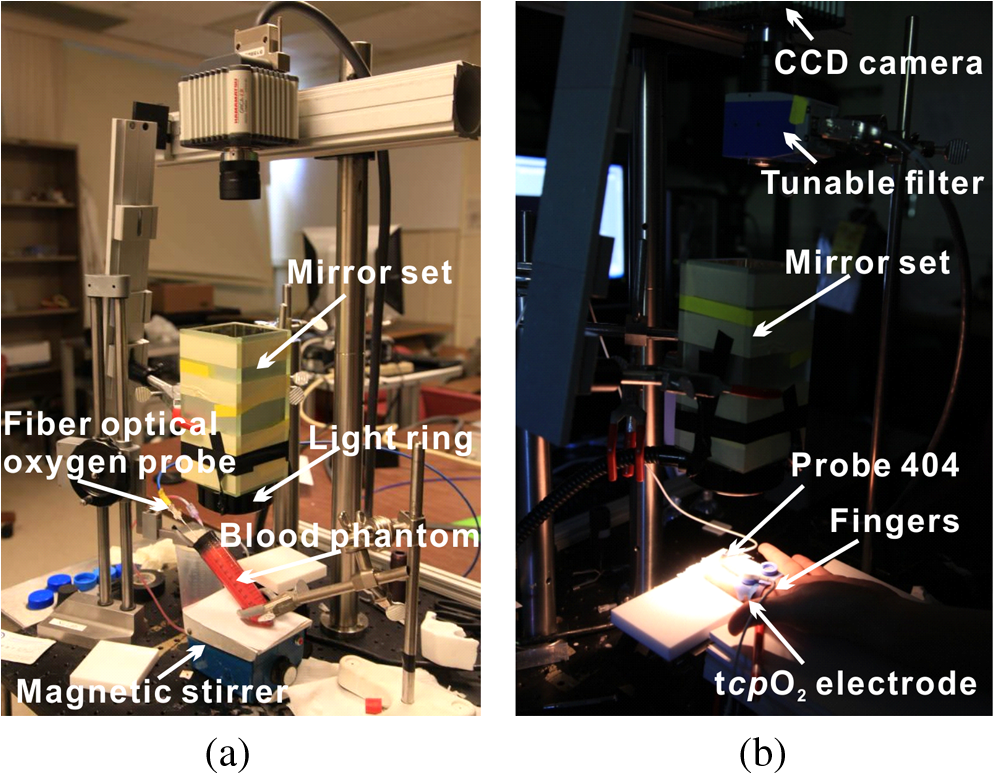
1.IntroductionAccurate and in vivo characterization of structural, functional, and molecular characteristics of biological tissue will facilitate quantitative diagnosis, therapeutic guidance, and outcome assessment in many clinical applications, such as wound healing, cancer surgery, and organ transplantation. Traditionally, structural characteristics are measured with a standard phantom or a transparent paper, which are invasive and inconvenient.1 Optical techniques, such as optical coherence tomography (OCT) and multiview imaging, provide noninvasive, rapid, and quantitative methods for characterizing tissue topography. OCT is able to obtain depth-resolved structural information of biological tissue with an imaging depth up to 3 mm.2 Multiview images utilize multiple viewpoints and captured multiple pictures of objective tissue to reconstruct three-dimensional (3-D) tissue topography. However, these methods reveal only 3-D structural information of biological tissue without functional characteristics. Tissue functional characteristics provide important parameters for accurate and quantitative assessment of many tissue disorders, such as chronic wounds and cancer. Clinically relevant tissue parameters include oxygenation and vascular perfusion. Hyperspectral imaging, laser speckle imaging, and laser Doppler imaging are clinically effective techniques for acquiring a tissue oxygenation map and blood perfusion.3–5 However, these imaging systems cannot provide 3-D structural information of the biological tissue for the real-time guidance of clinical intervention. We propose to integrate multiview imaging and hyperspectral imaging in a single portable unit for simultaneous 3-D imaging of tissue structural and functional characteristics. Four plane mirrors were cohered together to form a multiview reflective mirror set with a rectangular cross section. The multiview reflective mirror set was placed between the camera and the measured biological tissue. Since multiview image reconstruction requires high-resolution images that cannot be achieved by the hyperspectral camera in our lab, we consequently demonstrated 3-D oxygenation imaging by acquiring multiview and hyperspectral images using different cameras. For a single image acquisition task, a five-view image comprising a main objective image and four reflective images were first captured by a multiview camera at a high resolution (). 3-D topography of the test scene was achieved by correlating the matching pixels between the objective image and the reflective images. After that, a hyperspectral data cube of the same scene was acquired using a hyperspectral camera at a lower resolution (). The tissue oxygenation map was derived from hyperspectral imaging analysis and coregistered with the 3-D topographic image in order to obtain 3-D mapping of tissue oxygenation. Our multiview hyperspectral imaging technique was validated in a chronic wound model, a tissue-simulating blood phantom, and an in vivo biological tissue model. The preliminary results have demonstrated the technical feasibility of using multiview hyperspectral imaging for 3-D topography of tissue functional properties. 2.Materials and Methods2.1.Multiview ImagingThe multiview imaging setup consists of a Pentax Kx digital single-lens reflex (DSLR) camera with a resolution of (Ricoh Imaging Company Ltd., Tokyo, Japan) and a square mirror set. The square mirror set was composed of four plane mirrors that were cohered together with a square cross section. This configuration allowed us to obtain five different views of the target within a single image at exactly the same time. With a 3-D reconstruction algorithm, the 3-D superficial characteristics of the tissue could be obtained. The basic principle underlying the multiviewpoint imaging system is shown in Fig. 1. The multiview camera is placed on one end of the square mirror, and its optical axis is coincident with the axis of the square mirror set. Each of the four mirrors produces a virtual subcamera on the other side. Thus the virtual subcameras are symmetric with respect to the optical axis, and the distance between a real subcamera and a virtual subcamera is equal to that between the opposite mirrors. The five “cameras” will take pictures of point from different viewpoints. As a result, 3-D topography of the scene can be achieved by correlating the matching pixels between the objective image and the reflective images. 2.2.Reconstruction of Structural Characteristics2.2.1.Pinhole camera modelA camera converts a 3-D world coordinate into a two-dimensional (2-D) pixel coordinate on the imaging plane by projecting a point in space onto its image sensor. This pinhole camera model consists of the following three-coordinate systems: (1) pixel coordinate system on the image sensor, (2) camera coordinate system with its origin at the camera aperture, and (3) world coordinate system based on a fixed point in space. A point in space has a 3-D world coordinate of and a 3-D camera pixel coordinate , and its projection on the image sensor has a pixel coordinate of . The relationship between the pixel coordinate and the world coordinate can be described as where and are the homogeneous coordinates of a point ; is the intrinsic matrix of the camera which can convert the 3-D camera coordinate into 2-D pixel coordinate; is the rotation matrix; and is the translation matrix. Matrix converts the world coordinate into the camera coordinate and denotes the extrinsic parameters of the imaging system. The intrinsic matrix is defined as which includes five intrinsic parameters. and represent the focal length of the camera in the and directions in terms of pixels, respectively. represents the skew coefficient between the - and -axes, and is often zero. and represent the pixel coordinate of the principle point.If the lens introduce significant distortion, several nonlinear parameters have to be used to describe the distortion effect.6 is a vector that stores the image distortion coefficients (radial and tangential distortions). For a point , let be the normalized image projection Let , and the new normalized coordinate including the distortion is defined as where is the tangential distortion vector Finally, with distortion, the pixel coordinate of the projection of point on the image plane can be described as To calibrate our multiview imaging system, we need to (1) calibrate the digital camera to undistort the acquired images; (2) calibrate each of the five real and virtual subcameras to get their intrinsic and extrinsic parameters; and (3) stereo calibrate each subcamera pair to obtain the 2-D to 3-D coordinate conversion.2.2.2.Image undistortionThe camera in the multiview imaging was a Pentax Kx camera with a Pentax DAL18-55 mm lens. Since a wide-angle view including the objective image and all the reflection images was needed, the focal length was set to 18 mm. However, wide-angle lenses brings distortions to the captured images, and those distortions can be corrected by the camera calibration. As shown in Fig. 2(a), 15 images of a flat checker board placed at different positions and orientations were captured. Knowing that the size of each square on the checker board is , the focal length, principal points, skew coefficient, distortion coefficient, and its extrinsic parameters were obtained using the camera calibration toolbox.7 Then any captured images with distortion can be undistorted. Figure 2(b) shows the reconstructed checker board position with respect to the camera in each captured image. 2.2.3.Stereo calibration of the real and the virtual subcamerasThe 3-D coordinate of a space point can be calculated by any two of the real and virtual subcameras shown in Fig. 1. In our system, the real subcamera was stereo-calibrated with each virtual subcamera, respectively, so we were able to use four stereo image pairs to reconstruct the same point. Viewing from these five subcameras at the same time can significantly reduce the occlusion caused by the fluctuant surface of the object. For each real-virtual subcamera pair, we calibrated it as a stereo system intrinsically and extrinsically using the method provided in the toolbox. These parameters were used to rectify the image pairs of the sample and convert the 2-D pixel coordinate pair into 3-D world point coordinate in the future. Similarly, 15 images of a small flat checker board with the size of squares were taken. Each of the images was cut into five small images corresponding to the real and the virtual subcameras. Those virtual subcamera images were flipped as they were reflected by mirrors. Thus we got four groups of small checker board calibration images: middle-left, middle-right, middle-top, and middle-bottom. Figure 3(a) shows one of the small checker board calibration images, and Fig. 3(b) shows the cut and flipped images. Figure 3(c) displays one pair of cameras and the reconstructed position of the calibration planes after the stereo calibration. 2.2.4.Three-dimensional reconstructionA local and window-based method for stereo matching was used to find the corresponding points in each image pair. This method is based on normalized cross-correlation,8 incorporating subpixel9 computation into the matching matrices to avoid the contouring effects caused by integer-valued disparity estimates, and detecting the occluded areas using cross-checking,10 which refined the corresponding points estimate. With the stereo calibration results, the 3-D coordinates of a set of points can be calculated using the stereo triangulation function in the toolbox when given their corresponding pixel coordinates on the image pair. The reconstructed coordinates from the four image pairs were then averaged to reduce the reconstruction error. 2.3.Multiview Hyperspectral ImagingThe procedure of multiview hyperspectral imaging consists of the following three consecutive steps: (1) multiview images were acquired using the reflective mirror set and the high-resolution camera in order to reconstruct 3-D topography of the objective tissue; (2) hyperspectral data cubes were acquired for calculation of a tissue oxygenation map; and (3) 3-D tissue topography and the oxygenation map were fused for 3-D mapping of tissue functional parameters. Two methods were used to obtain the hyperspectral images of the objective tissue. The first one is to utilize OL 490 Agile Light Source (Gooch & Housego, Orlando, Florida) as the tunable light source that provided a wide wavelength range (380 to 780) nm at a spectral resolution of 2 nm. A fiber optic ring light guide (Edmund Optics, Barrington, New Jersey) was connected to the tunable light source to provide uniform illumination. The second method is to mount a liquid crystal tunable filter (Cambridge Research Inc., Cambridge, Massachusetts) with the wavelength range of 400 to 720 nm and a bandwidth of 7 nm in front of the camera lens to enable imaging at designated wavelengths. A Hamamatsu C4742-80-12AG air-cooled digital CCD camera (Hamamatsu, Bridgewater, New Jersey) with resolution was mounted at the same position of the DSLR camera to capture hyperspectral images. The experimental system as shown in Fig. 4 was carefully aligned for the coincident optical axes of two cameras. Two cameras were alternately used to acquire multiview and hyperspectral images to guarantee sufficient resolution for the multiview imaging and the high sensitivity for hyperspectral imaging simultaneously. The camera for multiview imaging has a resolution of , which is similar to the resolution of the hyperspectral camera after being equally divided into five separate views. The hyperspectral camera has a high sensitivity (quantum efficiency ) at wavelengths from 400 to 700 nm. Switching between the two cameras and coregistering their corresponding images would be the best way to obtain both high-quality structural and functional information of the objective tissue. We took out the middle view from the multiview camera and registered it with the hyperspectral image. The scale-invariant feature transform method was used to find at least three sets of feature points on the two images, and the transform matrix was calculated.11 Since the 3-D model was reconstructed based on the middle view, with the transform matrix we were able to map any functional information obtained from hyperspectral imaging onto the 3-D results. After obtaining the hyperspectral images of the objective tissue, a wide gap second-derivative spectroscopic technique was used to reconstruct tissue oxygenation maps based on the hyperspectral images.12 2.4.Validation Experiment2.4.1.Three-dimensional reconstruction accuracy and axial resolution measurementTo determine the reconstruction accuracy of the multiview system, we used two known geometry objects as the imaging targets, a flat checker board and a cylindrical checker board with a diameter of 57.70 mm, as shown in Fig. 5(a). The captured images are shown in Figs. 5(b) and 5(c). Sixty-four corner points of the black and white squares were extracted, and their spatial coordinates were reconstructed using the calibrated parameter obtained in the previous work. Then a plane and a cylindrical surface were fitted using these set of points as the reconstructed surfaces. The root mean square error between the reconstructed points and the best-fit surface can indicate the reconstruction accuracy of the multiview system. Fig. 5Checker board validation for multiview imaging: (a) a flat checker board and a cylindrical checker board; (b) multiview image of the flat checker board; and (c) multiview image of the cylindrical checker board.  To measure the axial reconstruction resolution, we mounted the flat checker board onto a linear motorized translation stage PT1-Z8 (Thorlabs Inc., Newton, New Jersey) that has a minimal achievable incremental movement of and a bidirectional repeatability of . The translation stage moved 7 mm in total along the axis of the multiview system with a step size of 0.5 mm. At each step, we captured one image and reconstructed the plane at that position. The minimal axial distance of the system can be resolved by comparing the distance between each reconstructed plane. Figure 6(a) shows the configuration of the accuracy test experiment. Figure 6(b) shows the images we captured at different axial positions. 2.4.2.Three-dimensional topography of a pressure ulcer foot modelA pressure ulcer foot model (3BScientific, Tucker, Georgia) with four chronic wounds representing different phases of the pressure-induced chronic wound was used in experiment to validate the multiview system, as shown in Figs. 7(b) and 7(c). One of the wounds was measured by the multiview imaging system, as shown in Fig. 7(a). The wound model was mounted on a gypsum base manufactured especially for it. A flat board with a 1-cm grid was also mounted onto the base to illustrate the size of the model. With the algorithm described in Sec. 2.2, we could reconstruct the 3-D morphology of the wound. 2.4.3.Three-dimensional oxygenation mapping of a tissue-simulating blood phantomWe also combined multiview imaging with hyperspectral imaging for 3-D mapping of oxygenation. The experimental setup consists of the high resolution DSLR camera, the hyperspectral camera, the multiview reflective mirror set, the tunable light source, a light ring, and a tube simulated blood phantom, as displayed in Fig. 8(a). The tunable light source was used to illuminate the test objects at the designated wavelengths. To verify the performance of the multiview hyperspectral system, a tube-shaped blood phantom was placed at a tilted angle within the field of view. The topography of the phantom was reconstructed based on the multiview image, while the oxygenation map was reconstructed from the hyperspectral images using a wide gap second derivative spectroscopic technique. The tube-shaped blood phantom was prepared in advance by the following protocol: (1) add 20-g milk powder into deionized water to make 200-ml milk suspension; (2) mix 200 ml of milk, 70 ml of deionized water, and 12 ml of donated blood; and (3) put the mixture in a polycarbonate centrifuge tube of 60 ml. The oxygenation level of the phantom was adjusted by the drop-wise addition of sodium hydrosulfite solution into the phantom mixture by a syringe. The sodium hydrosulfite solution was prepared in advance by adding 1 g of hydrosulfite to 40 ml of deionized water. A series of blood phantoms with consequentially decreased oxygenation levels were produced by adding the following amount of sodium hydrosulfite solution into the centrifuge tube: 0, 0.1, 0.15, 0.15, 0.20, 0.25, and 0.30 ml, respectively. After the sodium hydrosulfite solution was added, the centrifuge tube was sealed and stirred for uniform distribution of oxygenation. A fiber optical sensor of an OOISensors system (Ocean Optics Inc., Dunedin, Florida) was inserted in the phantom to monitor the partial pressure of dissolved oxygen and compare with the oxygenation map acquired by hyperspectral imaging. The measurement of oxygen partial pressure was used to validate the multispectral oximetry technique because of an approximately linear correlation between oxygen saturation and oxygen tension in an oxygen saturation range from 20% to 80%.13 2.4.4.In vivo tissue modelThe integrated multiview hyperspectral method was also validated in vivo following a clinical protocol approved by the Ohio State University IRB (Protocol No: 2010H0017). The experimental setup consists of a high resolution DSLR camera, a hyperspectral camera, a liquid crystal tunable filter, a multiview reflective mirror set, a broadband light source, a light ring, and a tube simulated blood phantom, as displayed in Fig. 8(b). The Varispec visible liquid crystal tunable filter (Cambridge Research Inc., Cambridge, Massachusetts) with the wavelength range of 400 to 720 nm and a bandwidth of 7 nm was mounted in front of the camera lens to enable imaging at designated wavelengths. A healthy subject’s fingers were put in the view field of the integrated system and monitored, and an occlusion experiment was conducted. The fingers were continuously monitored from the beginning of the occlusion to the postocclusive reactive hyperemia. Before the experiment, a pressure cuff was applied around the upper arm of the subject. Then we began to simultaneously monitor the tissue structural and functional characteristics with the multiview hyperspectral imaging setup. After a 1-min baseline measurement, an occlusion was created with the pressure cuff. We quickly inflated the cuff above and maintained the pressure for another 2 min, which was called the occlusion stage. Then the cuff was released and a reactive hyperemia stage came, which also lasted for 4 min. The dynamics of 3-D oxygenation saturation of the fingers could be obtained from the analysis on the data from the multiview hyperspectral imaging technique. A probe 404 of the PF5010 unit and a electrode of the PF5040 (Perimed, Kings Park, New York) unit were attached on the fingers for continuous monitoring of blood perfusion and oxygen partial pressure, respectively. 3.Results3.1.Accuracy and Axial Resolution for Three-Dimensional Topographic ReconstructionFigure 9(a) shows the reconstructed points of the flat checker board imaged in Fig. 5(b) and their best-fit plane. The RMS error obtained by fitting the reconstructed points with a plane is only 0.0120 mm. Figure 9(b) shows a slice of the best-fit plane and the reconstructed points on it, indicating its high reconstruction accuracy. Figures 9(c) and 9(d) show the reconstructed points of the cylindrical checker board imaged in Fig. 5(c) and a slice across the best-fit cylinder, respectively. We used a cylindrical surface to fit these points. The RMS error between the reconstructed points and the best cylinder is 0.1491 mm. The diameter of the best-fit cylinder surface is 57.348 mm, which shows a very good reconstruction accuracy compared to the real value of 57.70 mm. The different colors in Figs. 9(a) and 9(c) represent different height values of the reconstructed images, with the scales shown as the -axis. Fig. 93-D reconstruction accuracy measurement results: (a) reconstructed points of the flat checker board; (b) a slice of the best-fit plane with the reconstructed points; (c) reconstructed points of the cylindrical checker board; and (d) a slice across the best-fit cylinder with the reconstructed points.  Figure 10 shows the results of the axial resolution measurement. Fifteen planes were reconstructed corresponding to the 15 axial positions of the flat checker board, with a total axial range of 7 mm, as shown in Fig. 10(a). Figure 10(b) shows a slice across the reconstructed points and the best-fit planes that are indicated in Fig. 10(a), where each layer of the best-fit planes can be easily distinguished. Thus, the axial resolution of 0.5 mm (translation stage movement step size) can be achieved by the multiview imaging technique. 3.2.Reconstruction of Wound ModelFigure 11 shows the reconstructed topography of the wound model using the multiview imaging system. Figure 11(a) illustrates the 3-D reconstructed surface, where the different colors represent different height values of the reconstructed surface. Then we project the color textured image captured by the middle “real subcamera” onto the 3-D surface, as shown in Fig. 11(b). 3.3.Multiview Hyperspectral Reconstruction of the Simulated Blood PhantomFigure 12(a) shows the reconstructed topography of the tube, where the different colors represent different height values of the reconstructed surface. Figures 12(b)–12(h) display oxygenation maps of the tube-shaped blood phantom with the topography characteristics. From the figure, it can be easily observed that the oxygenation saturation of the blood phantom decreased along with the increased volume of the sodium hydrosulfite solution. This result indicated that the structural and functional characteristics of the simulated blood phantom could be easily achieved with the simple multiview hyperspectral method. The mean of the region of interest on the blood phantom obtained from the hyperspectral imaging and the partial pressure () of dissolved oxygen in the blood phantom measured by the fiber optics probe connected to an OOISensors system are shown as a green curve and a blue curve, respectively, in Figs. 12(i) and 12(j). The consistency of the change of and from the recipe 1 to 7 also validates the multiview hyperspectral method. Fig. 12Multiview hyperspectral imaging of a tube simulating blood phantom: (a) topography of the tube; (b)–(h) topographic map of the tube simulated blood phantom from recipe 1 to 7, red color denotes a higher oxygen saturation, while blue color denotes a lower oxygen saturation; and (i) and (j) of the region of interest obtained from the hyperspectral imaging and the partial pressure of dissolved oxygen in the blood phantom measured by the fiber optics probe that connected to an OOISensors system.  3.4.Multiview Hyperspectral Imaging of an In Vivo Tissue ModelFigure 13 displays the result of the occlusion experiment on the healthy subject. Figure 13(a) is the dynamics of the blood perfusion of the fingers during the occlusion experiment, while Fig. 13(b) is the dynamics of of the fingers during the occlusion experiment. Figures 13(c)–13(e) are the topography of the fingers with oxygenation characteristics at one moment during the baseline, occlusion, and reperfusion stage, respectively. The result indicated the occlusion effect and hyperemia effect clearly, which also implies that the system simultaneously can obtain topographic and oxygenation characteristics in live tissue. Fig. 13Multiview hyperspectral imaging of a healthy subject’s fingers in an occlusion experiment: (a) dynamics of blood perfusion of fingers during occlusion experiment; (b) dynamics of of fingers during occlusion experiment; (c) 3-D oxygenation distribution of the fingers at one moment during the baseline stage; (d) 3-D oxygenation distribution of the fingers at one moment during the occlusion stage; (e) 3-D oxygenation distribution of the fingers at one moment during the reperfusion stage; and (f) 3-D topography of the fingers.  4.Discussion4.1.Camera SelectionIn our system, a DSLR camera is used to acquire a multiview image while a hyperspectral camera is used to acquire multispectral images. Ideally speaking, it is better to use a single camera to acquire all the images. However, a single camera system cannot be implemented because a hyperspectral camera has a much lower total pixel amount () than that of the DSLR camera. If we use a hyperspectral camera to capture all the images, these pixels have to be reassigned to nine views (including five views used for image processing), with only for each view. In contrast, using a relatively low-cost Pentax DSLR camera can readily increase the pixel per view level to so that 3-D reconstruction will yield a higher spatial resolution. A hyperspectral camera will acquire the center view of the test subject without sacrificing its achievable resolution. Our next step is to integrate multiview and hyperspectral imaging procedures using a single high-resolution hyperspectral camera. 4.2.Image Time and System AlignmentSince we use two cameras to obtain structural and functional information of the subject, the cameras should be easily switched in order to shorten the operating time. The total imaging time includes multiview imaging time, hyperspectral imaging time, and the time to switch between two cameras. Multiview imaging only takes one shot on the target object. The exposure time ranges from 0.05 to 0.5 s, depending on the illumination and the reflectance conditions. Hyperspectral imaging takes five images of the object at five wavelengths for the blood oxygen measurement. The exposure time ranges from 0.05 to 1 s, depending on the illumination wavelengths. The time of switching cameras is less than 10 s. Therefore, the total time for acquiring a complete set of images is estimated less than 20 s. To minimize the positional error induced by switching two cameras, we used a coaxial alignment for the optical axes of two cameras and coregistered the hyperspectral images with the center view image. First, both cameras were mounted onto clamping slides (Thorlabs Inc., Newton, New Jersey), slid along on a horizontal 66 mm optical construction rail (Thorlabs Inc., Newton, New Jersey), and fixed at specific positions. Second, a dovetail optical rail (Thorlabs Inc., Newton, New Jersey) was vertically aligned with a rail carrier slide (Thorlabs Inc., Newton, New Jersey) on the operation table below the camera. A round alignment disk target (Thorlabs Inc., Newton, New Jersey) was then mounted onto the slide with the horizontal position of the rail fixed so that the target can only move along the rail vertically. Third, the DSLR camera was aligned so that the target remained at the center of the acquired images as it was placed at different heights from 0 to 15 cm. The calibration procedure ensured that the camera was coaxial with the path of the moving target. The same calibration procedure was repeated for the hyperspectral camera so that the optical axes of both cameras were precisely aligned and readily switchable in a short time with accuracy. After each experiment, the acquired hyperspectral images and the center view image were coregistered in order to obtain the 3-D structural and functional information. 4.3.Imaging Distortion Induced by Target–Camera Distance and Target CurvatureTarget–camera distance and target curvature contribute to the distortion of the acquired images by the multiview system. To minimize the influence of target–camera distance on imaging distortion, the target is placed at a designated target–camera distance (around 10 mm to the end of the square mirror set) and the corresponding area in the five views is maximized. With the designated target–camera distance in the experiment, its influence on the imaging distortion can be effectively compensated. To minimize the influence of target curvature on imaging distortion, we calibrate the multiview system in advance by placing a checker board at the designated target–camera distance. The checkerboard is orientated in different directions corresponding to different shapes and curvatures for a target object in 3-D space. Based on the results of the calibration test, the radial and the tangential factors of the distortion can be calculated and corrected. In a space volume, reconstruction of a flat board after the above calibration procedures is able to reach an RMS error of in comparison with the best-fit plane. Similarly, reconstruction of a cylindrical board after the above calibration procedures is able to reach an RMS error of less than 0.1491 mm in comparison with the best-fit cylinder. These results imply that the proposed calibration procedures can effectively reduce the imaging distortion induced by target–camera distance and target curvature. 4.4.Scattering of Biological TissueFor multiview imaging of biological tissue, the scattering of light will also affect the imaging reconstruction accuracy. On one hand, light scattering in deep tissue may blur the surface texture and induce difficulty for stereo matching. On the other hand, depending on different view angles, light scattering may cause different levels of dislocation for deep layers of tissue. This effect exists in not only multiview imaging, but also other 3-D surface reconstruction methods such as surface scan and structured light illumination. Since it is difficult to eliminate imaging distortion due to light scattering, the alternative effect is to reduce the light scattering from deep tissue. Jacques et al. used polarized light to differentiate between superficial and deep tissue.14,15 O’Toole et al. used structured-light-transport imaging to geometrically get rid of the strong subsurface scattering.16 Despite these effects, 3-D imaging distortion induced by light scattering has not been fully studied or compensated. Many researchers simply neglected the scattering effect as they estimated wound tissue topography using various 3-D imaging techniques such as multiview imaging, laser scanning, and structured light illumination.17–20 By using polarized light and combining multiple imaging modalities, it is possible to acquire only the surface reflectance of biological tissue for reducing imaging distortion in 3-D reconstruction and for obtaining other pathophysiologic information of biological tissue.14 5.Conclusions and Future WorkA multiview hyperspectral imaging method was introduced to map the 3-D oxygenation distribution on biological tissue. A multiview reflective mirror set was placed in front of the lens of the imager, and the topography of the tissue with an oxygenation map could be obtained with a 3-D reconstruction algorithm and a wide gap second-derivative spectroscopic algorithm. The imaging devices in the method are reportable, noninvasive, cost effective, and clinically implementable for applications such as wound healing assessment, intraoperative surgical navigation, and organ transplantation. The method was calibrated with a stereo camera calibration method. Four experiments were conducted to validate the method. Reconstruction accuracy and axial resolution measurement showed that this multiview imaging was able to reconstruct a subject accurately with high resolution. A wound model was imaged and reconstructed in 3-D. A tissue-simulating blood phantom and an in vivo experiment were also conducted and the results also indicate that the method can simultaneously achieve the structural and functional characteristics of the tissue. Our preliminary results have demonstrated the technical feasibility of using multiview hyperspectral imaging for 3-D topography of tissue functional properties, which is very useful for clinical treatment. Future work will mainly concern the development of an integrated portable system that utilizes one camera to simultaneously capture the multiview images and hyperspectral images. AcknowledgmentsThis research was sponsored by the National Institute of Standards and Technology (60NANB10D184) and National Science Foundation of China (81271527). The authors are grateful for experimental help provided by Professor Allen Yi and his student Peng He at The Ohio State University, and helpful discussions with Professor Chandan Sen at The Ohio State University Medical Center. ReferencesC. Ahn,
“Advances in wound photography and assessment methods,”
Adv. Skin Wound Care, 21
(2), 85
–93
(2008). http://dx.doi.org/10.1097/01.ASW.0000305411.58350.7d Google Scholar
J. G. Fujimoto et al.,
“Optical coherence tomography: an emerging technology for biomedical imaging and optical biopsy,”
Neoplasia, 2
(1), 9
–25
(2000). http://dx.doi.org/10.1038/sj.neo.7900071 Google Scholar
D. C. Kellicut et al.,
“Emerging technology: hyperspectral imaging,”
Perspect. Vasc. Surg. Endovasc. Therapy, 16
(1), 53
–57
(2004). http://dx.doi.org/10.1177/153100350401600114 Google Scholar
G. E. Nilsson, T. Tenland and P. Å. Öberg,
“Evaluation of a laser Doppler flowmeter for measurement of tissue blood flow,”
Biomed. Eng. IEEE Trans., BME-27
(10), 597
–604
(1980). http://dx.doi.org/10.1109/TBME.1980.326582 Google Scholar
S. J. Kirkpatrick and M. J. Cipolla,
“Laser speckle microstrain measurement in vascular tissue,”
Proc. SPIE, 3598 121
–129
(1999). http://dx.doi.org/10.1117/12.347480 PSISDG 0277-786X Google Scholar
D. C. Brown,
“Decentering distortion of lenses,”
Photometric Eng., 32
(3), 444
–462
(1966). Google Scholar
J.-Y. Bouguet,
“Camera Calibration Toolbox for Matlab,”
(2004) http://cn.mathworks.com/products/computer-vision/features.html#camera-calibration ( 1 2016). Google Scholar
D. Scharstein and R. Szeliski,
“A taxonomy and evaluation of dense two-frame stereo correspondence algorithms,”
Int. J. Comput. Vision, 47
(1–3), 7
–42
(2002). http://dx.doi.org/10.1023/A:1014573219977 IJCVEQ 0920-5691 Google Scholar
T. W. Ryan, R. Gray and B. Hunt,
“Prediction of correlation errors in stereo-pair images,”
Opt. Eng., 19
(3), 193312
(1980). http://dx.doi.org/10.1117/12.7972515 Google Scholar
P. Fua,
“A parallel stereo algorithm that produces dense depth maps and preserves image features,”
Mach. Vision Appl., 6
(1), 35
–49
(1993). http://dx.doi.org/10.1007/BF01212430 Google Scholar
D. G. Lowe,
“Object recognition from local scale-invariant features,”
1150
–1157
(1999). Google Scholar
D. E. Myers et al.,
“Noninvasive method for measuring local hemoglobin oxygen saturation in tissue using wide gap second derivative near-infrared spectroscopy,”
J. Biomed. Opt., 10
(3), 034017
(2005). http://dx.doi.org/10.1117/1.1925250 JBOPFO 1083-3668 Google Scholar
A. Bashkatov et al.,
“Optical properties of human skin, subcutaneous and mucous tissues in the wavelength range from 400 to 2000 nm,”
J. Phys. D, 38
(15), 2543
(2005). http://dx.doi.org/10.1088/0022-3727/38/15/004 JPAPBE 0022-3727 Google Scholar
S. L. Jacques, J. C. Ramella-Roman and K. Lee,
“Imaging skin pathology with polarized light,”
J. Biomed. Opt., 7
(3), 329
–340
(2002). http://dx.doi.org/10.1117/1.1484498 JBOPFO 1083-3668 Google Scholar
S. L. Jacques, J. R. Roman and K. Lee,
“Imaging superficial tissues with polarized light,”
Lasers Surg. Med., 26
(2), 119
–129
(2000). http://dx.doi.org/10.1002/(SICI)1096-9101(2000)26:2<119::AID-LSM3>3.0.CO;2-Y LSMEDI 0196-8092 Google Scholar
M. O’Toole, J. Mather and K. N. Kutulakos,
“3-D shape and indirect appearance by structured light transport,”
3246
–3253
(2014). Google Scholar
A. F. M. Hani et al.,
“Assessment of ulcer wounds size using 3D skin surface imaging,”
Visual Informatics: Bridging Research and Practice, 243
–253 Springer, Berlin Heidelberg
(2009). Google Scholar
H. Wannous, Y. Lucas and S. Treuillet,
“Enhanced assessment of the wound-healing process by accurate multiview tissue classification,”
IEEE Trans. Med. Imaging, 30
(2), 315
–326
(2011). http://dx.doi.org/10.1109/TMI.2010.2077739 ITMID4 0278-0062 Google Scholar
P. Plassmann and T. Jones,
“MAVIS: a non-invasive instrument to measure area and volume of wounds,”
Med. Eng. Phys., 20
(5), 332
–338
(1998). http://dx.doi.org/10.1016/S1350-4533(98)00034-4 MEPHEO 1350-4533 Google Scholar
S. Treuillet, B. Albouy and Y. Lucas,
“Three-dimensional assessment of skin wounds using a standard digital camera,”
IEEE Trans. Med. Imaging, 28
(5), 752
–762
(2009). http://dx.doi.org/10.1109/TMI.2008.2012025 ITMID4 0278-0062 Google Scholar
BiographyPeng Liu is a PhD student and research assistant in Lab for Multimodal Biomedical Imaging and Therapy at University of Science and Technology of China (USTC). He is a member of the International Society for Optics and Photonics (SPIE). He earned his BS of mechanical engineering at USTC. His research interests include multimodal imaging of biological tissue with hyperspectral imaging, laser speckle imaging, fluorescent imaging, structured light imaging, 3-D reconstruction, and microscopic imaging. Jiwei Huang is a scientist and engineer with expertise in optical microscopy imaging, fluorescence spectroscopy and imaging, low-photon-flux detection system, hyperspectral imaging system and algorithm, tissue optics model, oximetry, and imaging contrast agent. He earned his BS from Sun Yat-Sen University and PhD from Lab of Multimodal Imaging and Image-Guided Therapy of the Ohio State University. Currently he works in semiconductor industry and involves in R&D of optical microcopy system. Shiwu Zhang is an associate professor in the Department of Precision Machinery and Precision Instrumentation at USTC. He received his BS degree in mechanical and electrical engineering and PhD in precision instrumentation and precision machinery from USTC. He has also been a visiting scholar in the Department of Biomedical Engineering, the Ohio State University. His research interests include biomedical optics and intelligent robot. Ronald X. Xu is an associate professor of Biomedical Engineering at the Ohio State University and professor of Precision Machinery and Instrumentation at USTC. He is also a fellow of the Institute of Physics and a senior member of the International Society for Optics and Photonics (SPIE). His research interests include novel micro-/nano-encapsulation techniques for controlled drug delivery, multimodal imaging and image-guided surgery, and 3-D printing of tissue-simulating phantoms for standardized biomedical imaging. |