|
|
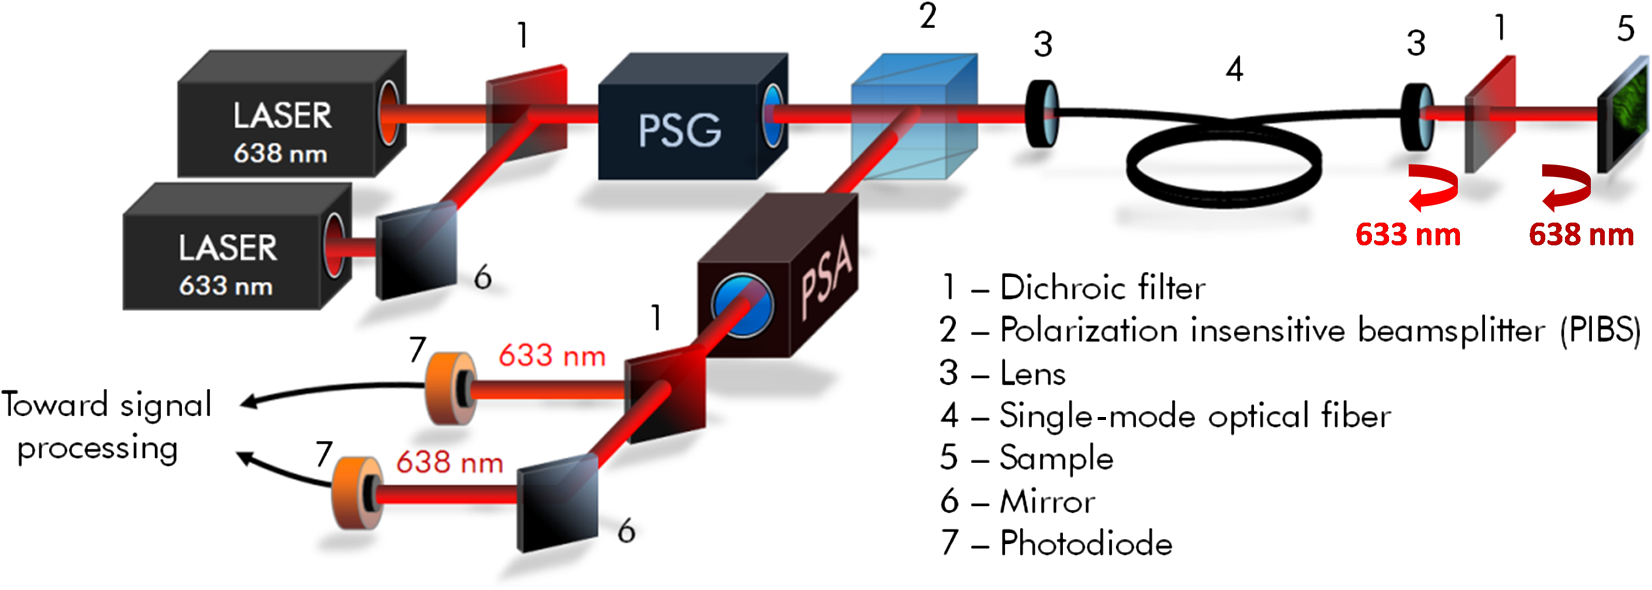
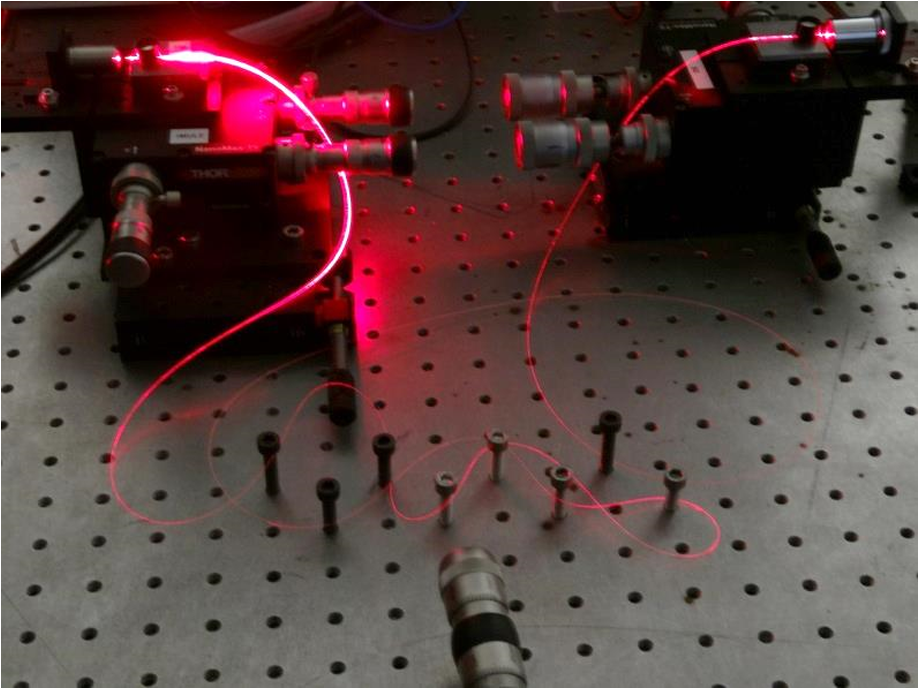
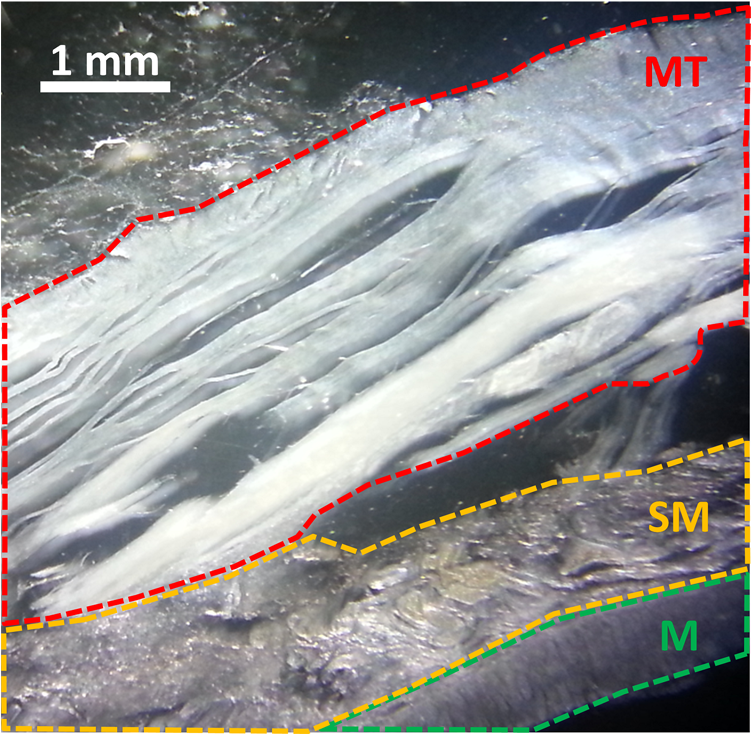
1.IntroductionAmong the techniques that can be used to characterize biological tissues, optical polarimetry has already been shown to be very attractive for analyzing their structure at the submicronic scale.1,2 Thanks to this feature, it has been proved to be an efficient tool for the diagnosis of different pathologies.3–8 Mueller polarimetry is the most complete polarimetric technique, which is capable of measuring all the polarimetric characteristics of any sample, i.e., its retardance, diattenuation, and depolarization.9 To perform in vivo in situ characterizations of inner tissues, optical probes must be coupled to an endoscopic device. Integration of Mueller polarimetry into existing endoscopic examinations that are intensity-based has the potential to substantially improve contrasts between healthy and pathological regions. However, standard polarimetric instrumentation is not compatible with the required endoscopic equipment, because light is guided from the source to the sample to be observed through an optical fiber. This incompatibility is due to the fact that optical fibers are components whose birefringence varies in an unpredictable way with time all along the path, inducing uncontrollable variations of the output polarization states. Even the use of polarization maintaining fibers cannot solve this problem since such fibers preserve only two orthogonal linear polarization states.10 Thus, making polarimetric characterization of a sample through an optical fiber is particularly difficult. Despite this, a few techniques to perform polarimetry through an endoscopic device have been reported up to now. One of them is achieved through a rigid endoscope;11 others provide only part of the polarimetric parameters of interest.12–15 Recently, a Mueller polarimeter operating through a flexible optical fiber was reported.16 It combines a channeled spectrum polarimeter and an interferometer for high-speed measurement. However, it suffers from several inconveniences, in particular the complexity of the measuring process, the need for a long and intricate calibration procedure, and a noticeable lack of accuracy due to a spectral depolarization generated by the optical fiber. Concerning our own research, we recently reported a much simpler technique that is able to measure a full Mueller matrix of a sample through an optical fiber with high precision.17 Our method is based on a temporal differential polarimetric characterization of (1) the fiber alone and (2) the assembly of the fiber and the sample. For this purpose, a microswitchable mirror (MSM) set at the distal end of the fiber alternately reflects light into the fiber (MSM on) or lets it pass toward the sample (MSM off). By using a suitable mathematical treatment, the fiber contribution was decoupled from the measurements performed with the fiber plus sample assembly, thus making possible the determination of the Mueller matrix of the sample. The main drawback of this technique is the use of a moving component at the distal end of the fiber (MSM), which makes it hardly compatible with actual miniaturized scanning probes. Another drawback is its reduced speed, as two successive measurements are required for a single point characterization. In this communication, we report a new method based on a spectrally differential approach, which is able to overcome the two drawbacks of our precedent method. The spectrally differential approach implies the simultaneous use of two close wavelengths. The first wavelength is used to characterize the fiber, while the second one is used to perform the measurements of the assembly consisting of the fiber plus the sample. The new approach does not make use of any moving optical component. Thus, it offers better integration possibilities with an endoscopic probe together with a reduction of the measurement time. In this paper, the experimental setup designed to realize spectrally differential measurements is described first. Then, the method used to extract the Mueller matrix from these measurements is presented. It is validated by means of experimental results on different calibrated samples. Finally, polarimetric images of biological samples achieved with the proposed technique are compared to those obtained with the previous temporal differential method. They are also compared with the results obtained with a free space Mueller microscope with proven accuracy, considered as a reference. 2.Experimental Setup and Measurement PrincipleThe experimental setup used for spectrally differential measurements is shown in Fig. 1. Using a dichroic filter, two beams from two monochromatic laser sources (Oxxius LBX633, , 100 mW and Oxxius LBX638, , 100 mW) were coupled into a 2 m long single-mode optical fiber (Corning RGB-400, ) at the proximal side, after passing through a polarization states generator (PSG) and a polarization insensitive beam splitter (PIBS, Thorlabs BS010). Another dichroic filter was set in the optical path after the fiber output (distal side) to reflect back and pass . The light reflected by either the filter () or the sample () was back-coupled into the fiber and directed toward two photodiodes (Hamamatsu S8745-01) by using a third dichroic filter, after being analyzed by a polarization states analyzer (PSA). Dichroic filters are either Semrock LP02-633RE or Semrock LPD01-633RU, depending on their orientation versus the incident beams. The PSG is the same as that used in Ref. 17. It consists of a linear polarizer, followed by two tunable ferroelectric liquid crystal cells with a quarter waveplate in between. The PSA is built with the same optical components in the reverse order with respect to the beam propagation direction. More details on these PSG and PSA can be found in Ref. 18. The endoscopic Mueller polarimeter was first calibrated without the fiber and lenses by means of the eigenvalue calibration method (ECM).19,20 This calibration was achieved at each wavelength and , a mirror replacing the sample in order to reflect . The ECM intrinsically takes into account all polarimetric effects induced by the optical components of the instrument not being part of neither the PSG or the PSA, such as possible retardance and/or diattenuation of the PIBS and of the dichroic filters. Once the calibration is completed, the ECM imposes that both the Mueller matrix of the distal dichroic filter at and the Mueller matrix of the distal mirror at are identity matrices. Finally, two Mueller matrices, (at ), which characterizes the fiber only, and (at ), which characterizes the assembly of fiber plus sample, were measured simultaneously. For each Mueller matrix determination, 16 discrete measurements are achieved, each based on six averaged acquisitions. The simultaneous measurement of both matrices took 32 ms. In our previous paper, we have shown that the Mueller matrix of the fiber in single pass can be written as follows:17 where , , and are the orientation angles of one eigenaxis of the fiber at the input, at the output, and its linear retardance, respectively. This means that a linear polarization state launched at the input of the fiber with an orientation in a reference frame (so-called lab frame) will exit at the output with a preserved linear polarization state, but oriented in the direction defined by in the lab frame. The rotation matrix and Mueller matrix of a linear retarder are expressed asThe Mueller matrix of the fiber in double pass is given by17 The general expression of matrix is Thus, orientation and linear retardance can be extracted from Eq. (5) as follows: where is the coefficient of on the ’th row and ’th column.In our experiment, the Mueller matrix of the fiber in double pass, measured at , is For its part, the Mueller matrix of the assembly fiber plus sample measured at is where is the Mueller matrix of the sample in the lab frame.In Eqs. (7) and (8), subscripts 1 and 2, respectively, refer to parameters measured at and . Matrix is the Mueller matrix of the sample in a frame defined by the unknown orientation of the fiber eigenaxes at the distal side. However, this does not affect values of the polarimetric parameters of the sample. Thus, they can be extracted from except for an absolute orientation of the sample eigenaxes (i.e., their orientation in the lab frame). Matrix can be deduced from Eq. (8) by Let us note that and , since and matrices are orthogonal. To compute the Mueller matrix , one should know and , which are the polarimetric characteristics of the fiber at . Therefore, one has to relate these characteristics to and , which can be determined through the measurement of matrix [see Eq. (7)]. For this purpose, experiments were carried out on the fiber without sample, in different conditions. First, the fiber was severely curved with varied bend radii, as shown in Fig. 2. In this situation, we measured and , the Mueller matrices of this fiber in double pass, at and , respectively. Taking into account the uncertainty of the measurements, matrices MFB1 and MFB2 have the same form as Eq. (5). The values of the angles and and of the linear retardances and extracted from matrices MFB1 and MFB2 by means of Eq. (6) are reported in Table 1. Table 1Linear retardance 2δ and eigenaxis orientation θa measured at 633 and 638 nm, in the fiber whose conditioning is shown in Fig. 2. As can be seen, and remain very close to each other (), whereas a difference of only 3 deg is measured between and . This discrepancy is the largest we found due to such drastic conditioning of the fiber, and it was typically limited to with less severe conditioning. Then, the fiber was vibrated over its whole length, both ends being kept fixed, at a frequency of 3 Hz. The amplitude of the vibrations locally reached . In Fig. 3, we plot differences in linear retardances and in orientation angles in the fiber vibrated at 3 Hz, measured over 30 s ( successive measurements). Mean differences are of 0.3 and 0.2 deg for and , respectively, with maximum values of 0.6 and 0.3 deg. These very small differences measured when perturbing the fiber are due to the small gap between and . In these conditions, we can consider that and . Fig. 3Differences between polarimetric parameters of the fiber at and at , measured along time when the fiber is vibrated at 3 Hz. Considered parameters are (a) the linear retardance of this fiber in double pass and (b) the orientations of the eigenaxis at the proximal end of the fiber. 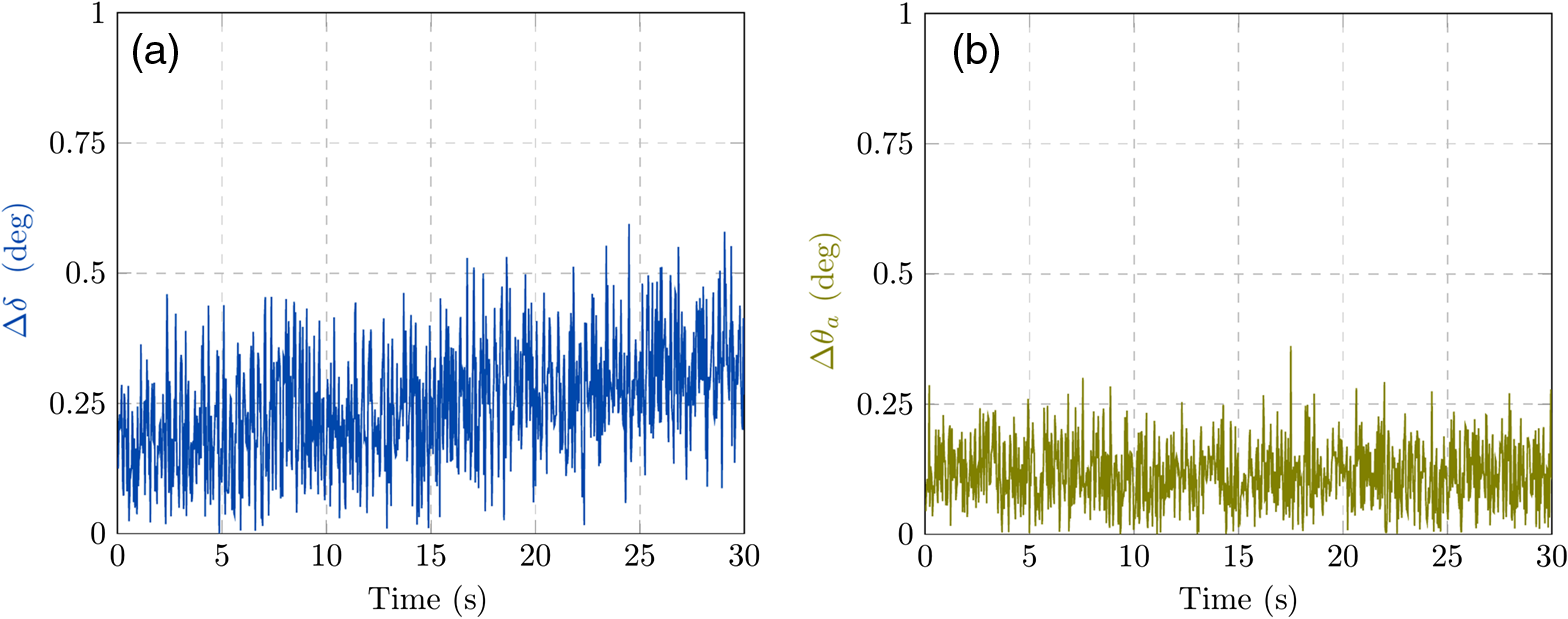 Therefore, Eq. (8) can be written as Finally, matrix can be extracted from Eq. (11) as follows: 3.Results and Discussion3.1.Polarimetric Characterization of Calibrated Optical ComponentsTo validate the proposed method, Mueller matrices of various calibrated components, such as waveplates, a tunable linear retarder [Babinet-Soleil compensator (BSC)], and a tilted glass plate behaving like a linear diattenuator, have been measured. The polarimetric characteristics of these components were extracted, and maximal discrepancies with nominal values were found to be 1.7 deg for the linear retardance, 1 deg for eigenaxis relative orientations, and 0.02 for the diattenuation, whatever the considered component. To increase the optical complexity of the sample, combinations of these components have also been measured. As an example, we considered an arrangement of a fixed tilted glass plate () followed by a BSC, their eigenaxes being, respectively, oriented at 0 and 45 deg in the lab frame [Fig. 4(a)]. The simulated and measured polarimetric characteristics of this combination of components, measured in double pass, are displayed in Fig. 4(b). This arrangement exhibits at the same time linear retardance, linear diattenuation, and circular diattenuation, the latter two being related to the value of the linear retardance. Retardance of the BSC was tuned from 0 to 180 deg, and experimental polarimetric characteristics of the arrangement were extracted from measured matrices, using the polar decomposition method in which is decomposed as follows:21 where , , and are Mueller matrices of a depolarizer, a retarder, and a diattenuator, respectively.Fig. 4(a) Schematic representation of a combination of components to be characterized at the output of the fiber (sample), consisting of a fixed tilted glass plate () followed by a tunable Babinet-Soleil compensator. The eigenaxes orientations of the plate and of the Babinet-Soleil compensator are, respectively, 0 and 45 deg in the lab frame. (b) Polarimetric characteristics of this arrangement measured in double pass. LR, linear retardance; LD, linear diattenuation; CD, circular diattenuation.  These measured characteristics were in excellent agreement with simulated ones, whatever the retardance of the BSC. 3.2.Polarimetric Images of Biological Samples3.2.1.Image of a human colon sample by the proposed two-wavelength differential techniqueBiological specimens were imaged with the setup depicted in Fig. 1 by means of a very simple scanning device. A microscope objective was positioned after the distal dichroic filter in order to focus light on the sample to be imaged. The sample was moved across the focal plane of the objective by means of motorized XY stages (Thorlabs MT3-Z8). In the following, we discuss the images of a healthy human colon sample provided by the Institut Mutualiste Montsouris (Paris). The tissue of colon was fixed in formalin for 24 h and embedded in paraffin. A thick slide was cut on a plane orthogonal to the axis of the colon tube and deposited, without standard staining, on an aluminum coated glass plate with 98% of reflectivity. An intensimetric image of the transversal section of colon is shown in Fig. 5. Three different layers are visible: the mucosa (M), mainly composed of epithelial cells and a loose network of collagen fibers, the submucosa (SM), almost entirely made of a dense network of collagen fibers, and the muscular tissue (MT), composed of elongated and well-organized muscular fibers. A coverslip has been used to keep the native sample structure. The glass material has been chosen for this coverslip to avoid birefringence effects induced by standard plastic films. For a biological sample with the considered thickness, the depolarization induced by light scattering in all the previously described layers is negligible. However, a strong birefringence effect has been observed on the muscular tissue and appears negligible elsewhere. Figures 6(b) and 6(c), respectively, show images of linear retardance and of its relative orientation in this region. They are determined by means of the polar decomposition of the measured Mueller matrices.21 The processing time of these images () was , i.e., 1.2 s. The significant measured linear retardance is due to well-organized fibers at the macroscopic scale, as confirmed by the continuous orientation of the linear retardance eigenaxes shown in Fig. 6(c). A reduced area from the muscular tissue region is identified by the white dashed boundaries in Fig. 6(c). A histogram of the pixels corresponding to the eigenaxes orientations in this area is plotted in Fig. 6(d). Well-defined orientation of the muscular fibers in this area, which can be noticed in Fig. 6(c), is confirmed by the narrow shape of this histogram, with a peak value of and FWHM of . Then, the sample was rotated by 20 deg and the linear retardance and its eigenaxes orientations were measured again [Figs. 6(g) and 6(h)]. As expected, the obtained retardance is unchanged over the entire sample whereas a shift of 20 deg of the eigenaxes orientation is observed between Figs. 6(c) and 6(h). The histogram of these orientations in the rotated delineated area is displayed in Fig. 6(i). As can be anticipated, it exhibits a shape close to that of the previous one, with a peak value shifted by 20 deg (peak value ). A slight discrepancy between the two histogram shapes is due to a small difference in the definition of the area boundaries in the two cases. In muscular region (fibrillar tissue), slight linear diattenuation was measured () and its eigenaxes orientation was found to be very close to that of the linear retardance. Fig. 6(a) Muscular tissue region in the sample depicted in Fig. 5; polarimetric images of this region with the proposed technique: (b) linear retardance, (c) orientation of the linear retardance eigenaxes, (d) histogram of these orientations (), analogous images for the sample rotated by 20 deg, (g) linear retardance, (h) orientation of the linear retardance eigenaxes, (i) histogram of these orientations (); polarimetric images of this region with the endoscopic polarimeter reported in Ref. 17: (f) linear retardance, (e) orientations of the linear retardance eigenaxes; (images size: , , resolution: , acquisition time for one image: 5 min). 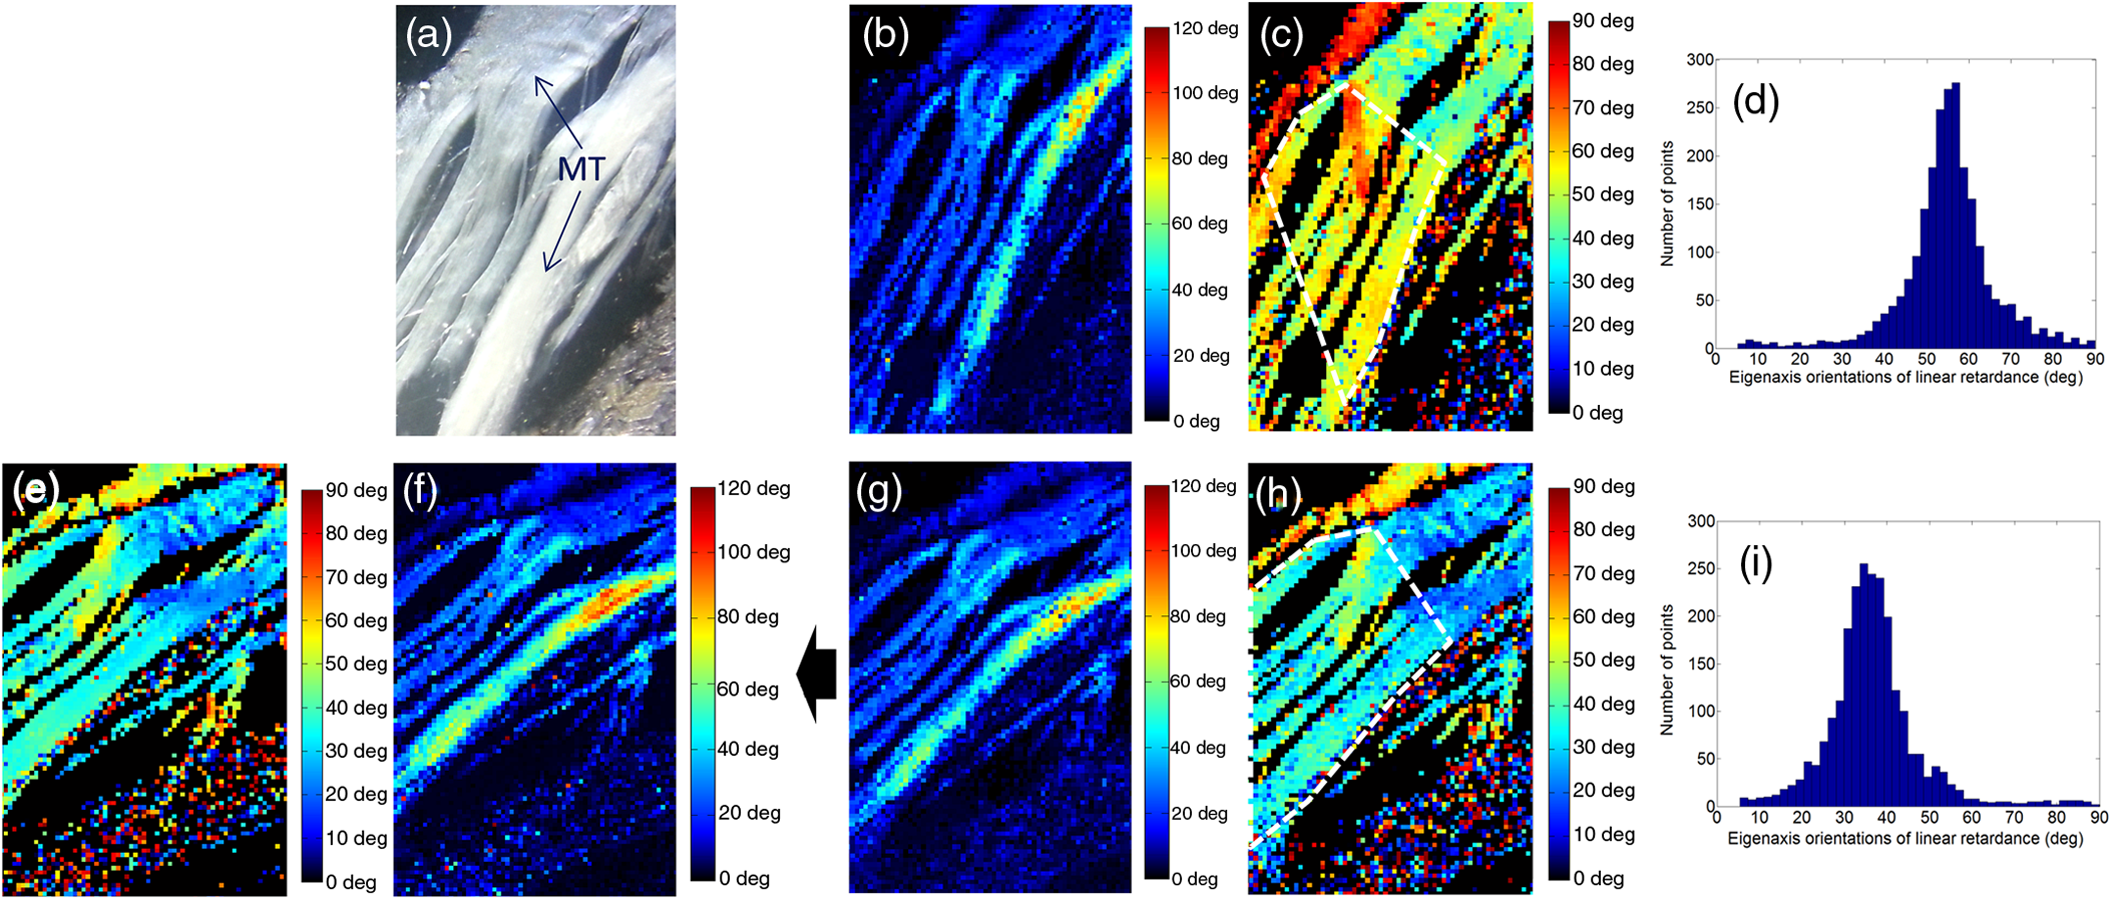 For comparison, the Mueller matrix of this sample has been measured by means of other Mueller polarimeters as discussed in Sec. 3.2.2. We first compared the previously discussed polarimetric images with those obtained by the setup described in Ref. 17. Then, we compared these images with the polarimetric images acquired by a standard free space Mueller microscope in backscattering configuration. 3.2.2.Polarimetric images performed by an endoscopic Mueller polarimeter working with the microswitchable mirrorWe imaged the sample by means of the endoscopic Mueller polarimeter based on differential measurement at a single wavelength () thanks to the use of a MSM at the distal end of the fiber.17 Images of linear retardance and of its eigenaxes orientations obtained with this setup are shown in Figs. 6(f) and 6(e), respectively. These images are very similar to the corresponding images obtained with the two-wavelength method, displayed in Figs. 6(g) and 6(h). Let us note that, because orientations measured with our devices are only relative information, an offset had to be applied to the orientations measured for Fig. 6(e), in order to fit with Fig. 6(h). The good agreement between the images provided by the two setups confirms the reliability of the technique proposed in this paper. 3.2.3.Polarimetric images performed by a free space Mueller microscopeA Mueller microscope in backscattering configuration has been used for polarimetric analysis of some regions of the biological sample [Fig. 7(a)]. This microscope, designed and installed at PICM laboratory, can operate in real and Fourier space as discussed in more detail in Ref. 22. The real space configuration shown in Fig. 7(b) has been used for the experiments performed in this study. A halogen lamp (S) is imaged on the sample with a telescopic system of two lenses, L1 and L2, placed in the illumination arm, and coupled to a objective. The same objective, coupled with a second telescopic system of two lenses L3 and L4 in detection arm, is used to image the sample on a CCD camera (Hamamatsu ORCA II BT, resolution ) cooled at . The lateral size of the image is . The PSG and the PSA are also based on ferroelectric liquid crystal retarders, as the ones used in the setup of Fig. 1. The spectral width of the halogen lamp was filtered with a band-pass filter (20 nm FMHW) centered at 633 nm. The sample is placed on an automatic sample-holder allowing a precise movement in all directions. Axial adjustment is used to place it in the focal plane of the objective. The lateral adjustment is used to explore different zones of the sample. The 16 required measurements, corresponding to the four different input and output polarization states of PSG and PSA, are acquired to measure the Mueller matrix of the sample for each pixel of the image within a few seconds. Experimental polarimetric characteristics of each pixel were extracted from the measured Mueller matrix, by means of polar decomposition.21 Fig. 7Comparison between the linear retardance measured by using the proposed endoscopic setup with the linear retardance obtained by a Mueller free space microscope on two different zones of the muscular tissue of colon sample. (a) Linear retardance measured with the endoscopic setup: the magnifications of two regions of interest [(a1) and (a2)] where the microscopic polarimetric measurements [(b1) and (b2)] have been performed. In (b), the experimental scheme of the Mueller polarimetric microscope working in backscattering configuration is shown. Sizes of images (a1), (a2), (b1), and (b2): [(a1) and (a2): ; (b1) and (b2): ]; acquisition time for (a1) and (a2): 52 s; acquisition time for (b1) and (b2): . 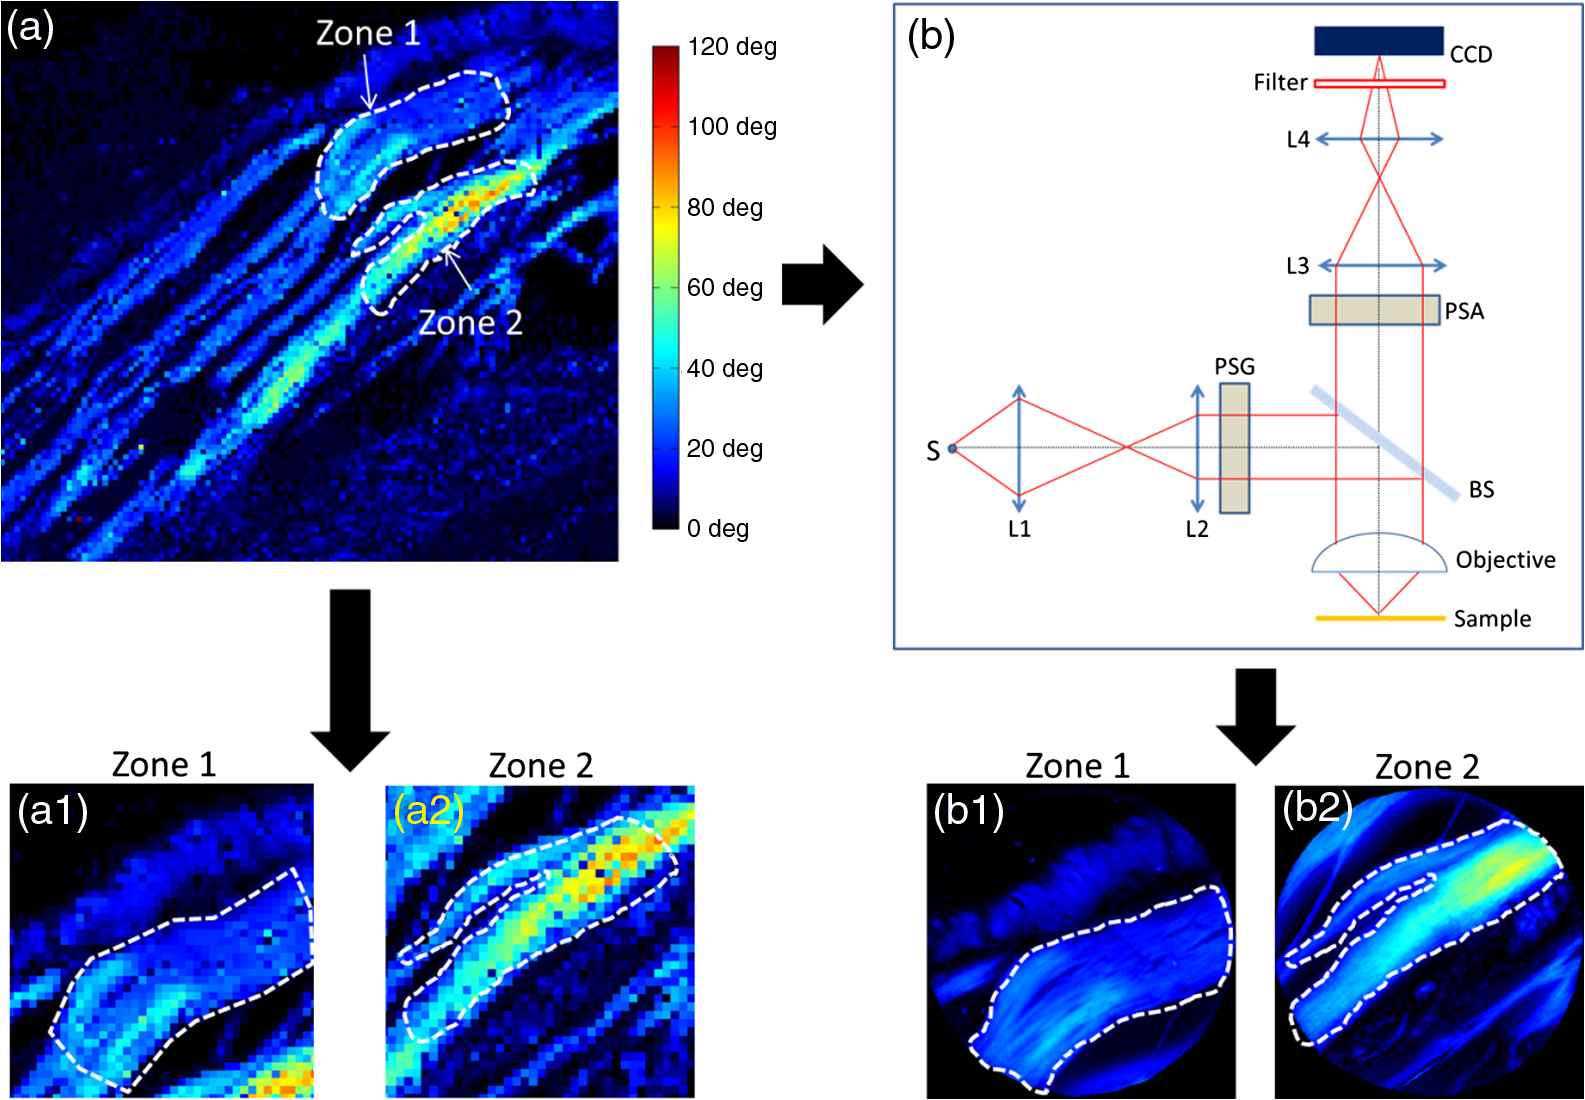 Images of linear retardance in zones 1 and 2 of Fig. 7(a), achieved by means of the Mueller microscope, are displayed in Fig. 7(b1) and 7(b2), respectively. Corresponding images with the two-wavelength differential technique are shown in Figs. 7(a1) and 7(a2). Strong pixelization can be observed in these last images as they are obtained by zooming in the selected zones (white dashed lines) on the larger image of Fig. 7(a), which has been realized with a low resolution (). Obvious similarity between the images realized by the two techniques, in each zone, can be noticed. For better comparison, the mean value and standard deviation of the retardance were calculated for each zone, from measurements achieved by both techniques. The results are reported in Table 2. In zone 1, the similarity between both mean retardance and standard deviation measured by the two techniques is particularly satisfactory, as the discrepancy between the mean values of retardance is only 0.4 deg, whereas it is concerning the standard deviation. The mean retardance is found to be significantly higher in zone 2 ( instead of measured in zone 1), but the results obtained with the two techniques remain in very good agreement (discrepancy ). A more significant difference is noticed concerning the standard deviation (). This can be attributed to the fact that the delimitation of zone 2 in Figs. 7(a2) and 7(b2) is not exactly the same. In addition, due to the low resolution of images provided by the scanning device of our endoscopic polarimeter (), the number of pixels constituting zone 2 in Fig. 7(a2) is critically small () compared to those () contained in zone 2 of the image achieved by Mueller microscope shown in Fig. 7(b2). Table 2Mean value and standard deviation of the retardance in zones 1 and 2, from measurements performed with the proposed endoscopic technique and with the free space Mueller microscope.
4.Discussion and ConclusionIn this paper, we have presented a novel technique allowing full Mueller matrix measurements through a 2 m long single-mode optical fiber, based on a two-wavelength differential technique. The first wavelength is used to characterize the fiber, while the second wavelength is used for characterizing the assembly of fiber plus sample. By means of a suitable mathematical treatment, the Mueller matrix of the sample is extracted. For a proof of principle, different sets of calibrated optical components were characterized. Combined polarimetric effects, such as linear retardance, linear and circular diattenuation, were measured with high accuracy, the highest discrepancy between our measurements and the nominal values being (0.4%) for linear retardance and 0.02 (2%) for linear diattenuation. Furthermore, relative orientation of linear retardance eigenaxis was also measured with this method. After getting satisfactory results from the calibrated samples, the proposed technique has been tested on a specimen of human colon. The measured Mueller matrix image of this sample is very similar to that obtained with a previously demonstrated technique involving an MSM at the distal end of the fiber. One of the key advantages of the proposed technique compared to the previous one is that it does not require any moving part, making it suitable for integration in a miniaturized scanning probe for in vivo in situ applications. Another advantage is that the two necessary measurements are achieved simultaneously, instead of successively in the previous one, leading to reduced measuring time. Other measurements on selected regions of this sample have also been performed with a free space Mueller microscope. In each region, the mean value and the standard deviation of the pixels showing the linear retardance are in very good agreement with those calculated from the image measured with the endoscopic Mueller polarimeter. This agreement between measurements taken with independent systems confirms that the optical effects induced by the fiber are well taken into account and they do not introduce noticeable systematic errors (drifts) in the measured values. The results presented and discussed in this study constitute a crucial step toward the realization of a fully functional and practical flexible Mueller polarimetric endoscope for in vivo in situ medical diagnosis. The next step will be devoted to addressing the issue of the measurement time of the Mueller matrices, which remains far too long in the view of operational implementation of the method (32 ms for a single pixel). This measurement time is due to the fact that, in the current configuration of the device, we perform 10 data acquisitions at 5 kHz () for each combination of PSG and PSA. For data processing, we must take into account the response time of the ferroelectric crystals composing the PSG and PSA used to modulate the polarization of light, which is of .23 Thus, the first and last two acquisitions are dropped as they occur during the switching time of crystals and the six remaining ones are averaged. Finally, the 16 successive measurements for the 16 combinations of PSG and PSA require . To reduce the measurement time, liquid crystal cells should be replaced by faster devices. The modulation may be performed with a fast electro-optic24 or photo-elastic modulator,25 at the price of increased complexity in instrumentation and signal processing. Polarimeters based on photo-elastic modulators have recently shown the ability to perform Mueller matrix in the millisecond range,26 i.e., an improvement by a factor of 30 compared to our device. However, this improvement is not sufficient. Furthermore, characterizing the sample with a stop at each pixel is time-consuming for the scanning device. Thus, a more effective strategy should be considered for data acquisition. For a given combination of PSG and PSA settings, the sample should be scanned at high speed and data for each pixel of the image should be registered. Then, the PSG and/or PSA should be tuned to their next settings after each scan so that all the required data should be registered after 16 successive scans. For example, a quick resonant repeatable microscanner similar to that reported in Ref. 27 could be used. Frame rates higher than should be reasonably reached with such existing devices. Another solution involving a fiber bundle and scanning at the proximal side should also be considered.28,29 However, this solution seems technically difficult to implement because several drastic conditions must be fulfilled, such as (1) draconian spatial filtering of light from the excited fiber only, prior to the detection and (2) for each fiber of the bundle, same excitation efficiency along the 16 successive scans. Another way for improving polarimetric characterization of tissues should be to achieve simultaneous measurements in different ranges of wavelengths (green and red typically), as the penetration depth of light into the tissue significantly depends on the wavelength.6,11 For this, pairs of close wavelengths should be used and highly selective wavelength filters should be implemented both at the proximal side and at the distal side of the fiber. The most critical issue consists in separating wavelengths of each pair at the distal side since the filters should be included in the microscanner. A solution should be the use of fiber Bragg gratings photowritten at the distal end of the fiber, each reflecting one wavelength of one pair. Due to their isotropic structure, such components should be insensitive to the incident polarization. This point is currently under investigation in our laboratory. AcknowledgmentsThis study was conducted under the supervision of the French Agence National de la Recherche (ANR), in the frame of the Imagerie de Mueller Endoscopique (IMULE) project, Grant No. 2011-BSV5 015-01. ANR was the institutional oversight that guaranteed that the internationally accepted principles and practices related to the ethical conduct of research involving the use of human subjects or animals were observed in this study. The authors are grateful to the French ANR for its financial support through the IMULE project. The authors would like to thank Pavel Bulkin for making of the aluminum coating on histological glass plates and Patricia Kermabon for preparing biological samples and for technical support. The authors are also particularly grateful to Stanislas Deby and Jean-Charles Vanel for their contribution in the realization of the Mueller polarimeters. ReferencesN. Ghosh and I. A. Vitkin,
“Tissue polarimetry: concepts, challenges, applications, and outlook,”
J. Biomed. Opt., 16
(11), 110801
(2011). http://dx.doi.org/10.1117/1.3652896 JBOPFO 1083-3668 Google Scholar
S. Bancelin et al.,
“Determination of collagen fiber orientation in histological slides using Mueller microscopy and validation by second harmonic generation imaging,”
Opt. Express, 22 22561
–22574
(2014). http://dx.doi.org/10.1364/OE.22.022561 OPEXFF 1094-4087 Google Scholar
S.-L. Jacques, J. C. Ramella-Roman and K. Lee,
“Imaging skin pathology with polarized light,”
J. Biomed. Opt., 7
(3), 329
–340
(2002). http://dx.doi.org/10.1117/1.1484498 JBOPFO 1083-3668 Google Scholar
M. Anastasiadou et al.,
“Polarimetric imaging for the diagnosis of cervical cancer,”
Phys. Status Solidi, 5 1423
–1426
(2008). http://dx.doi.org/10.1002/pssc.200777805 Google Scholar
M.-R. Antonelli et al.,
“Mueller matrix imaging of human colon tissue for cancer diagnostics: how Monte Carlo modeling can help in the interpretation of experimental data,”
Opt. Express, 18 10200
–10208
(2010). http://dx.doi.org/10.1364/OE.18.010200 OPEXFF 1094-4087 Google Scholar
A. Pierangelo et al.,
“Ex-vivo characterization of human colon cancer by Mueller polarimetric imaging,”
Opt. Express, 19 1582
–1593
(2011). http://dx.doi.org/10.1364/OE.19.001582 OPEXFF 1094-4087 Google Scholar
M. Dubreuil et al.,
“Mueller matrix polarimetry for improved liver fibrosis diagnosis,”
Opt. Lett., 37 1061
–1063
(2012). http://dx.doi.org/10.1364/OL.37.001061 OPLEDP 0146-9592 Google Scholar
J. Jagtap et al.,
“Quantitative Mueller matrix fluorescence spectroscopy for precancer detection,”
Opt. Lett., 39 243
–246
(2014). http://dx.doi.org/10.1364/OL.39.000243 OPLEDP 0146-9592 Google Scholar
D. Goldstein, Polarized Light, Revised and Expanded, CRC Press, Boca Raton
(2003). Google Scholar
A. Rogers, Polarization in Optical Fibers, Artech House Inc., Boston
(2008). Google Scholar
J. Qi et al.,
“Narrow band Mueller polarimetric endoscopy,”
Biomed. Opt. Express, 4 2433
–2449
(2013). http://dx.doi.org/10.1364/BOE.4.002433 BOEICL 2156-7085 Google Scholar
J. Desroches et al.,
“Fiber-optic device for endoscopic polarization imaging,”
Opt. Lett., 34 3409
–3411
(2009). http://dx.doi.org/10.1364/OL.34.003409 OPLEDP 0146-9592 Google Scholar
J. Fade and M. Alouini,
“Depolarization remote sensing by orthogonality breaking,”
Phys. Rev. Lett., 109 043901
(2012). http://dx.doi.org/10.1103/PhysRevLett.109.043901 PRLTAO 0031-9007 Google Scholar
J. Vizet et al.,
“One shot endoscopic polarization measurement device based on a spectrally encoded polarization states generator,”
Opt. Express, 23 16439
–16448
(2015). http://dx.doi.org/10.1364/OE.23.016439 OPEXFF 1094-4087 Google Scholar
Z. Ding et al.,
“Quantitative single-mode fiber based PS-OCT with single input polarization state using Mueller matrix,”
Biomed. Opt. Express, 6 1828
–1843
(2015). http://dx.doi.org/10.1364/BOE.6.001828 BOEICL 2156-7085 Google Scholar
S. Rivet, A. Bradu and A. Podoleanu,
“70 kHz full Mueller polarimeter and simultaneous fiber calibration for endoscopic applications,”
Opt. Express, 23 23768
–23786
(2015). http://dx.doi.org/10.1364/OE.23.023768 OPEXFF 1094-4087 Google Scholar
S. Manhas et al.,
“Demonstration of full Mueller polarimetry through an optical fiber for endoscopic applications,”
Opt. Express, 23 3047
–3054
(2015). http://dx.doi.org/10.1364/OE.23.003047 OPEXFF 1094-4087 Google Scholar
E. Garcia-Caurel et al.,
“Application of spectroscopic ellipsometry and Mueller ellipsometry to optical characterization,”
Appl. Spectrosc., 67 1
–21
(2013). http://dx.doi.org/10.1366/12-06883 APSPA4 0003-7028 Google Scholar
E. Compain, S. Poirier and B. Drevillon,
“General and self-consistent method for the calibration of polarization modulators, polarimeters, and Mueller-matrix ellipsometers,”
Appl. Opt., 38 3490
–3502
(1999). http://dx.doi.org/10.1364/AO.38.003490 APOPAI 0003-6935 Google Scholar
C. Macias-Romero and P. Török,
“Eigenvalue calibration methods for polarimetry,”
J. Eur. Opt. Soc. Rapid Publ., 7 12004
(2012). http://dx.doi.org/10.2971/jeos.2012.12004 Google Scholar
S.-Y. Lu and R. A. Chipman,
“Interpretation of Mueller matrices based on polar decomposition,”
JOSA A, 13 1106
–1113
(1996). http://dx.doi.org/10.1364/JOSAA.13.001106 Google Scholar
S. Ben Hatit et al.,
“Angle-resolved Mueller polarimeter using a microscope objective,”
Phys. Status Solidi A, 205 743
–747
(2008). http://dx.doi.org/10.1002/pssa.200777806 Google Scholar
L. M. S. Aas et al.,
“Dynamic response of a near infra-red Mueller matrix ellipsometer,”
J. Mod. Opt., 57 1603
–1610
(2010). http://dx.doi.org/10.1080/09500340.2010.515750 Google Scholar
E. Compain and B. Drévillon,
“Complete high-frequency measurement of Mueller matrices based on a new coupled-phase modulator,”
Rev. Sci. Instrum., 68 2671
–2680
(1997). http://dx.doi.org/10.1063/1.1148178 Google Scholar
E. Compain and B. Drévillon,
“High-frequency modulation of the four states of polarization of light with a single-phase modulator,”
Rev. Sci. Instrum., 69 1574
–1580
(1998). http://dx.doi.org/10.1063/1.1148811 Google Scholar
S. Alali and I. A. Vitkin,
“Optimization of rapid Mueller matrix imaging of turbid media using four photoelastic modulators without mechanically moving parts,”
Opt. Eng., 52 103114
(2013). http://dx.doi.org/10.1117/1.OE.52.10.103114 Google Scholar
P. Leclerc et al.,
“Development of a versatile multiphoton microendoscope for in vivo deep-tissue label-free biomedical imaging,”
2015). Google Scholar
J. M. Jabbour et al.,
“Confocal endomicroscopy: instrumentation and medical applications,”
Ann. Biomed. Eng., 40 378
–397
(2012). http://dx.doi.org/10.1007/s10439-011-0426-y Google Scholar
A. Osdoit et al.,
“To see the unseeable: confocal miniprobes for routine microscopic imaging during endoscopy,”
Proc. SPIE, 6432 64320F
(2007). http://dx.doi.org/10.1117/12.701004 PSISDG 0277-786X Google Scholar
|
||||||||||||||||||||||||||||