|
|
1.IntroductionA majority of the people suffering from diabetes mellitus will eventually develop diabetic retinopathy (DR). At the final stage of DR, sufferers may lose their eyesight. DR is one of the leading causes of blindness and can be controlled if detected early. But for population-based assessment, the task of grading each retinal fundus image is both time consuming and labor intensive. With the advent of digital fundus photograph technology and the availability of fast computers, systems are being designed to detect DR automatically. Microaneurysms (MAs), which are basically the saccular enlargement of the venous ends of retinal capillaries, are said to be the first sign of DR. MAs appear and disappear during the early course of retinopathy.1,2 The MA count and turnover in digital color fundus images are important measures of DR progression.3,4 Therefore, accurately detecting MA is not only important for DR detection, but also it may assist in monitoring DR progression. The MAs have diameters between 10 and , are round in shape, and their color is similar to blood vessels (BVs) (red),5,6 as shown in Fig. 1. Detection of MAs is challenging due to the variation in MA size, low and varying contrast, uneven illumination, and variation in fundus image background. MA detection is not a new topic; many researchers have worked on it since the early 1980s.7,8 Though the performance of the automatic system in digitized fluorescein angiograms is somewhat on par with a human grader,9 it is considered to be an invasive method, as fluorescein sodium dye is injected into the eye. The associated risk of complication or adverse reaction can include transient nausea, occasional vomiting, and so on, and in very rare cases can cause death. Thus most of the current research is moving toward color fundus photography, which is a noninvasive imaging method. In the absence of contrast enhancing agent, color fundus images inevitably suffer from low contrast. The performance of the fundus image-based system is, as expected, limited and remains as an open issue in retinal image analysis. Fig. 1Example of MA, where row 1 shows the MA in (a) full-color RGB and (b) a close-up view; row 2 is (c) in green band and (d) with a close-up view. 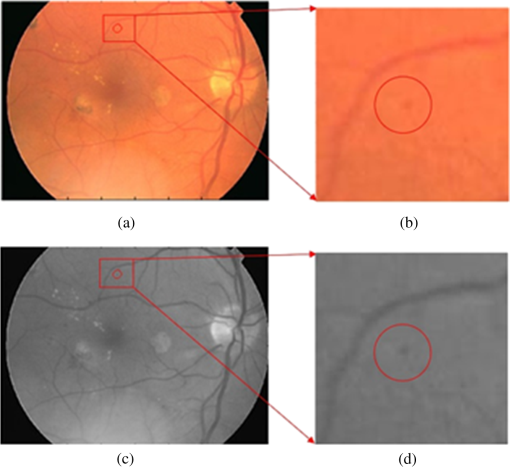 Some of the well-known approaches used in MA detection include template matching in wavelet domain, scale-adapted blob analysis with semisupervised learning scheme, ensemble-based system, double-ring filter, local rotating cross-section profile analysis, multiscale correlation coefficients, and pixel classification technique.10–16 In this work, we propose to use curvelet transform (CT) for MA detection as it can detect curve singularities. Our preliminary work indicated promising results (Shah et al.17 IOVS 2015;56: ARVO E-Abstract 5266). 2.Materials and Methods2.1.Data DescriptionWe tested our system using a publicly available Retinopathy Online Challenge (ROC) dataset.18 The dataset consists of 50 images with ground truth at different resolutions mimicking the real-world scenario. The MAs were annotated by four eye specialists at the Department of Ophthalmology, University of Iowa. The ROC dataset is challenging due to the presence of noise, compression artifacts, and the general image quality. These are in common to the image quality found in mass screening projects. The images were acquired using different types of camera and at different resolutions, which makes it more difficult to detect MAs in such images. The fundus cameras used were Topcon NW 100, a Topcon NW200, and a Canon CR5-45NM. Niemeijer selected them from 150,000 photographs collected in a DR screening program to form the ROC dataset.19 Table 1 describes the different image types.18 Table 1Types of images used in the proposed approach.
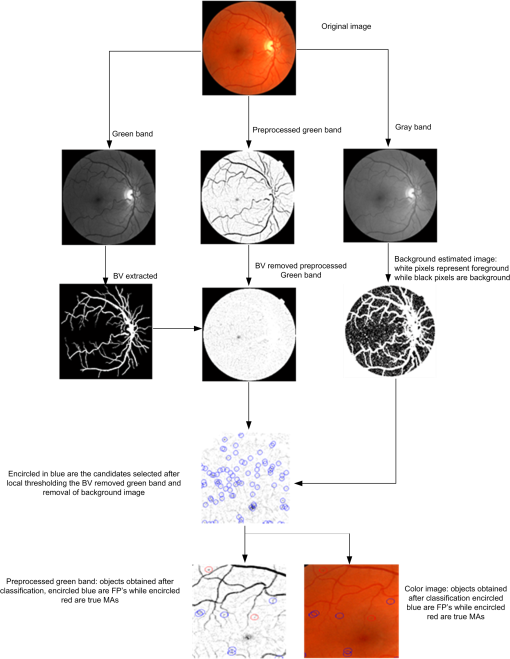
2.2.Automated Microaneurysm Detection SystemFigure 2 depicts the complete procedure of the proposed MA detection system which consists of the following steps:
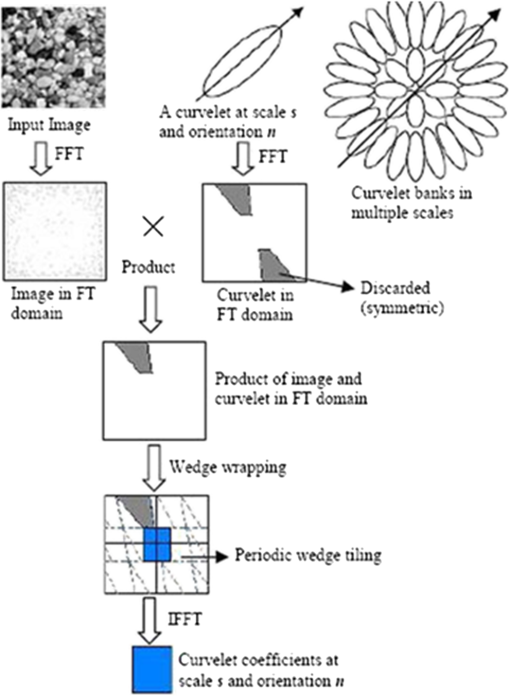
2.3.Candidate Feature ExtractionIn general, MAs are red in color and have round shape. Based on their morphology and intensity, we used three feature sets to describe the MAs, namely color-based, Hessian matrix-based, and curvelet coefficients-based features. The color features include (a) standard deviation and mean intensity values in red and green bands, and (b) the histogram of S and V bands in HSV color space. The BVs and other linear objects can be detected based on the eigenvalues of Hessian matrix.22 The features we used based on Hessian matrix are thus the eigenvalues, their product, and their ratio. The basic concept of curvelets23 is to represent a curve as a superposition of multiple functions of various lengths and widths obeying the scaling law . CT has a highly redundant dictionary, which can provide sparse representation of signals that have edges along regular curve. It is localized in angular orientation in addition to localization in spatial and frequency domains—a very important feature missing in the classic wavelet transform. Initial construction of curvelets has been redesigned and was reintroduced as fast digital CT.24 Curvelets are used in many medical image analysis applications like computed tomography,25 breast cancer diagnosis in digital mammogram,26 ulcer detection,27 retinal image analysis,28 and so on. Most natural images/signals exhibit line-like edges, i.e., discontinuities across curves (so-called line or curve singularities). Traditional wavelets perform well only at representing point singularities, since they ignore the geometric properties of structures and do not exploit the regularity of edges.29 The solution to this problem and some other limitations of the wavelet was provided by CT.23 Unlike the isotropic elements of wavelets, the needle-shaped elements of this transform possess very high directional sensitivity and anisotropy.29 The algorithm of CT is shown in Fig. 3. It is based on two windows, namely scale window and radial window , and consists of four steps: (a) compute the 2-D Fourier transform of the original image, and (b) for each scale and orientation , estimate frequency window as a product of the scale and radial windows, (c) wrap this product around the origin, and (d) compute a 2-D inverse fast Fourier transform to derive the curvelet coefficients. More details can be found in Candes’ paper.24 In digital implementation of the CT, the two main parameters are at the coarsest level. We found in our case that 2 scales and 16 orientations work well. Based on curvelet coefficients, we calculated aspect ratio, circulatory, mean energy, and standard deviation of energy. 2.4.Candidate ClassificationA simple rule-based classifier was designed to classify the candidates into MA and non-MA. The classification was done in three sequential stages. In stage one, using color features we removed the FPs. In stage two, using Hessian matrix-based features we removed those candidates that were from traces of BVs and other elongated objects. While in stage three, we utilized the curvelet coefficients-based features to remove noncircular objects. 3.Results and DiscussionOut of the 50 images, only 37 images contain MAs, while the remaining 13 images do not contain any MA. The total number of MAs in these 37 images is 336. The results of the proposed system and those previously reported in literature are shown in Table 2. Out of the 336 MAs, the proposed approach was able to detect 162 MAs, achieving a sensitivity of 48.21% with 65 FPs per image (FPPI). This result is favorably comparable with the state-of-the-arts, although only simple rule-based classifier was implemented. Unlike the method by Adal et al. that employed four supervised classifiers and 87 features in total to select an optimum classifier–feature pairing to remove FPs, the computation of the proposed system is simpler and faster albeit at the expense of higher FPPI. In this work, we aimed to achieve high sensitivity in MA detection, i.e., to detect as many MAs as possible from fundus images. We used local thresholding technique in identifying MA candidates and kept the threshold to a low value as our approach to achieve maximum possible sensitivity, at the cost of hundreds of FPPI. These FPs at this initial stage were mainly due to background of the fundus images and BVs. We used statistical features to estimate the background and remove those candidates that are from background. In addition, during the BV extraction stage, we kept the threshold to a low value so that only true BVs are extracted. This helps us in detecting MAs near the BV and ultimately improving the sensitivity. However, this resulted in introducing many FPs as there were many traces of BVs. To eliminate those BVs, we used the Hessian matrix-based features. Thus, the proposed system can detect MA near the BVs with reasonably good specificity. Figure 4 illustrates the examples of MA detected in close vicinity to BVs. Table 2Result comparison of different MA detection methods.
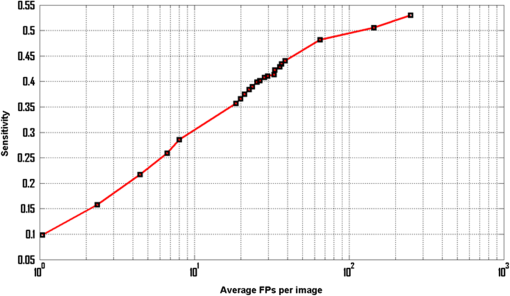
Fig. 4Examples of MA that are very close to the BVs but detected by the proposed system: (a)–(d) full-color images and (e)–(h) in green band. 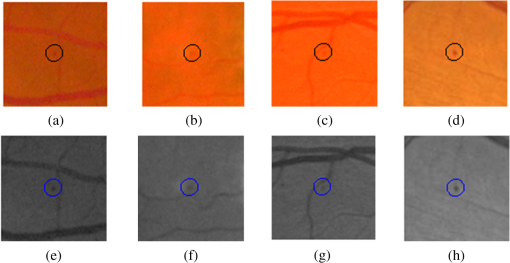 As previously mentioned, our objectives are different, in that we have targeted for better sensitivity whereas they focused on specificity. As the “good” MAs (clear circular dark red spots) form only a fraction of all the MAs in this dataset, this has a significant impact on how robust one approach can be optimized in coping with the variance of MA features. Using larger number of features and more complex classifiers, Adal et al. were successful in achieving very good specificity. Increasing its sensitivity (i.e., accepting MAs with larger variance) may however not be straightforward. Figure 5 shows the free-response receiver operating characteristic (FROC) curve of the proposed system. Based on local thresholding alone, the proposed system would have hundreds of FPPI. More than 42% of those FPs could however be removed using color features, with only 2.3% of the MAs being lost. We started with 178 MAs detected out of possible 336 (with 250 FPPI), after local thresholding. The results were improved to 170 MAs with 144 FPPI, after MA candidate selection based on color features. However, to achieve very high specificity (), additional features are required to differentiate the actual MAs and the FPs. In this case, we optimized the results using Hessian and curvelet features simultaneously. To our best knowledge, CT is used for the first time in MA detection. CT is fast and robust at detecting objects with curved singularities. We used features including shape parameters based on curvelet coefficients to discriminate between MAs and non-MAs. The results indicate that curvelets are very effective at detecting round objects such as MAs. Table 2 further shows our approach achieves the higher sensitivity than other reported approaches. Admittedly, the FPPI is higher than Adal’s but a simpler solution is perhaps better, as the Occam’s razor principle suggests. The ROC dataset is a very challenging dataset. It has been observed that general image quality, noise, and low and varying contrast make it difficult to detect MAs in this dataset. Figure 6 depicts some of the MA candidates detected by the proposed system. The FPs are mostly from BVs and hemorrhages (large red lesions). Some of the images are very dark, hence in those images the background has also contributed to the FPs. Factors such as variation in fundus image background, low and varying contrast, and artifact are found to further limit the MA detection rate. The cases where the proposed system failed to detect MAs are shown in Fig. 7 and can be summarized into three categories:
Fig. 6Objects encircled in black are true positives, encircled in white are false negatives, whereas objects inside the white squares are FPs: (a) full-color image while (b) in green band. 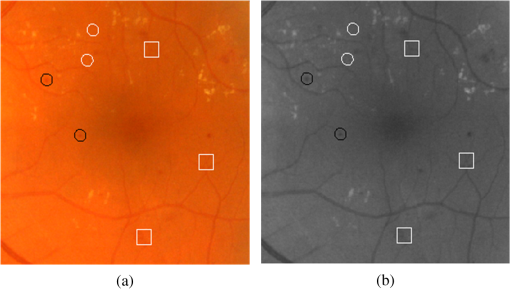 Fig. 7Different cases where the proposed system was unable to detect the MAs: (a)–(d) examples of missed MA because the center pixel does not have the minimum intensity, (e)–(h) examples of missed MA because their colors are very faint, and (i)–(l) examples of missed MA due to abnormal shape. 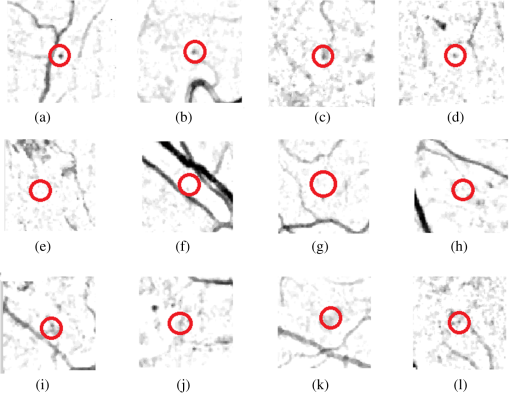 One possible approach to improve the sensitivity and specificity of the proposed MA detection system is the utilization of multispectral imaging (MSI) approach. Applications of MSI have shown promising results in different areas of biomedical image analysis ranging from human forearm imaging to skin chromophore mapping,34–38 with several applied to retinal image analysis.39–42 A recent study on retinal vein occlusion demonstrated that MSI was able to define vascular abnormalities at a comparable performance as fundus photography, fundus fluorescein angiography, and optical coherence tomography.43 In MSI, image data are captured at specific nonoverlapping frequency bands. Thus, certain features within the field of view can be highlighted. If applied in MA detection, we expect better BV extraction and background separation may be achieved. These will result in less stringent requirement at the classifier stage, and hence improvement in sensitivity. 4.ConclusionWe have explored a new technique for MA detection. We observed that the main sources/contributors of FPs in automated MA detection such as proposed one are image background and BVs while hemorrhages are the third category of FPs although with fewer in numbers. The proposed system has a high sensitivity and is able to detect MAs near the BVs. Our future work includes investigation of a means to detect hemorrhages and fine BVs to further improve the specificity of our proposed MA detection system. AcknowledgmentsThe project was supported by National Healthcare Group Singapore (Grant No. NHG/CSCS/12006). S. A. A. Shah was a recipient of Universiti Teknologi PETRONAS graduate assistantship scheme. ReferencesT. Hellstedt and I. Immonen,
“Disappearance and formation rates of microaneurysms in early diabetic retinopathy,”
Br. J. Ophthalmol., 80
(2), 135
–139
(1996). http://dx.doi.org/10.1136/bjo.80.2.135 Google Scholar
E. Kohner et al.,
“Microaneurysms in the development of diabetic retinopathy (UKPDS 42),”
Diabetologia, 42
(9), 1107
–1112
(1999). http://dx.doi.org/10.1007/s001250051278 DBTGAJ 0012-186X Google Scholar
R. Klein et al.,
“Retinal microaneurysm counts and 10-year progression of diabetic retinopathy,”
Arch. Ophthalmol., 113
(11), 1386
–1391
(1995). http://dx.doi.org/10.1001/archopht.1995.01100110046024 Google Scholar
L. Ribeiro, S. Nunes and J. Cunha-Vaz,
“Microaneurysm turnover in the macula is a biomarker for development of clinically significant macular edema in type 2 diabetes,”
Curr. Biomarker Find., 3 11
–15
(2013). http://dx.doi.org/10.2147/CBF.S32587 Google Scholar
T. Walter, J.-C. Klein,
“Automatic detection of microaneurysms in color fundus images of the human retina by means of the bounding box closing,”
Medical Data Analysis, 210
–220 Springer, Berlin-Heidelberg, Germany
(2002). Google Scholar
A. W. Fryczkowski et al.,
“Scanning electron microscopic study of microaneurysms in the diabetic retina,”
Ann. Ophthalmol., 23
(4), 130
–136
(1991). Google Scholar
B. Lay, C. Baudoin and J.-C. Klein,
“Automatic detection of microaneurysms in retinopathy fluoro-angiogram,”
in 27th Annual Technical Symp.,
165
–173
(1984). Google Scholar
C. Baudoin, B. Lay and J. Klein,
“Automatic detection of microaneurysms in diabetic fluorescein angiography,”
Rev. Epidemiol. Sante Publique, 32
(3–4), 254
–261
(1984). Google Scholar
J. V. Forrester,
“A fully automated comparative microaneurysm digital detection system,”
Eye, 11 622
–628
(1997). http://dx.doi.org/10.1038/eye.1997.45 12ZYAS 0950-222X Google Scholar
G. Quellec et al.,
“Optimal wavelet transform for the detection of microaneurysms in retina photographs,”
IEEE Trans. Med. Imaging, 27
(9), 1230
–1241
(2008). http://dx.doi.org/10.1109/TMI.2008.920619 Google Scholar
K. M. Adal et al.,
“Automated detection of microaneurysms using scale-adapted blob analysis and semi-supervised learning,”
Comput. Methods Programs Biomed., 114
(1), 1
–10
(2014). http://dx.doi.org/10.1016/j.cmpb.2013.12.009 Google Scholar
B. Antal and A. Hajdu,
“An ensemble-based system for microaneurysm detection and diabetic retinopathy grading,”
IEEE Trans. Biomed. Eng., 59
(6), 1720
–1726
(2012). http://dx.doi.org/10.1109/TBME.2012.2193126 Google Scholar
A. Mizutani et al.,
“Automated microaneurysm detection method based on double ring filter in retinal fundus images,”
Proc. SPIE, 7260 72601N
(2009). http://dx.doi.org/10.1117/12.813468 PSISDG 0277-786X Google Scholar
I. Lazar and A. Hajdu,
“Retinal microaneurysm detection through local rotating cross-section profile analysis,”
IEEE Trans. Med. Imaging, 32
(2), 400
–407
(2013). http://dx.doi.org/10.1109/TMI.2012.2228665 Google Scholar
B. Zhang et al.,
“Detection of microaneurysms using multi-scale correlation coefficients,”
Pattern Recognit., 43
(6), 2237
–2248
(2010). http://dx.doi.org/10.1016/j.patcog.2009.12.017 Google Scholar
M. Niemeijer et al.,
“Automatic detection of red lesions in digital color fundus photographs,”
IEEE Trans. Med. Imaging, 24
(5), 584
–592
(2005). http://dx.doi.org/10.1109/TMI.2005.843738 Google Scholar
A. S. Syed et al.,
“Automated detection of microaneurysms using curvelet transform,”
Invest. Ophthal. Vis. Sci., 56
(7), 5266
(2015). Google Scholar
M. Niemeijer et al.,
“Retinopathy online challenge: automatic detection of microaneurysms in digital color fundus photographs,”
IEEE Trans. Med. Imaging, 29
(1), 185
–195
(2010). http://dx.doi.org/10.1109/TMI.2009.2033909 Google Scholar
M. D. Abramoff and M. S. Suttorp-Schulten,
“Web-based screening for diabetic retinopathy in a primary care population: the EyeCheck project,”
Telemed. J. E Health, 11
(6), 668
–674
(2005). http://dx.doi.org/10.1089/tmj.2005.11.668 Google Scholar
J. V. Soares et al.,
“Retinal vessel segmentation using the 2-D Gabor wavelet and supervised classification,”
IEEE Trans. Med. Imaging, 25
(9), 1214
–1222
(2006). http://dx.doi.org/10.1109/TMI.2006.879967 Google Scholar
S. S. A. Ali et al.,
“Making every microaneurysm count: a hybrid approach to monitor progression of diabetic retinopathy,”
in 5th Int. Conf. on Intelligent and Advanced Systems (ICIAS),
1
–4
(2014). Google Scholar
A. F. Frangi et al.,
“Multiscale vessel enhancement filtering,”
130
–137 Springer(1998). Google Scholar
E. J. Candes and D. L. Donoho,
“Curvelets: a surprisingly effective nonadaptive representation for objects with edges,”
(2000). Google Scholar
E. Candes et al.,
“Fast discrete curvelet transforms,”
Multiscale Model. Simul., 5
(3), 861
–899
(2006). http://dx.doi.org/10.1137/05064182X Google Scholar
L. Dettori and L. Semler,
“A comparison of wavelet, ridgelet, and curvelet-based texture classification algorithms in computed tomography,”
Comput. Biol. Med., 37
(4), 486
–498
(2007). http://dx.doi.org/10.1016/j.compbiomed.2006.08.002 Google Scholar
M. M. Eltoukhy, I. Faye and B. B. Samir,
“Breast cancer diagnosis in digital mammogram using multiscale curvelet transform,”
Comput. Med. Imaging Graphics, 34
(4), 269
–276
(2010). http://dx.doi.org/10.1016/j.compmedimag.2009.11.002 Google Scholar
B. Li and M. Q.-H. Meng,
“Texture analysis for ulcer detection in capsule endoscopy images,”
Image Vision Comput., 27
(9), 1336
–1342
(2009). http://dx.doi.org/10.1016/j.imavis.2008.12.003 Google Scholar
M. S. Miri and A. Mahloojifar,
“Retinal image analysis using curvelet transform and multistructure elements morphology by reconstruction,”
IEEE Trans. Biomed. Eng., 58
(5), 1183
–1192
(2011). http://dx.doi.org/10.1109/TBME.2010.2097599 Google Scholar
J. Ma and G. Plonka,
“The curvelet transform,”
IEEE Signal Process. Mag., 27
(2), 118
–133
(2010). http://dx.doi.org/10.1109/MSP.2009.935453 Google Scholar
T. Spencer et al.,
“Automated detection and quantification of microaneurysms in fluorescein angiograms,”
Graefe’s Arch. Clin. Exp. Ophthalmol., 230
(1), 36
–41
(1992). http://dx.doi.org/10.1007/BF00166760 Google Scholar
S. Abdelazeem,
“Micro-aneurysm detection using vessels removal and circular Hough transform,”
in Proc. of the Nineteenth National Radio Science Conf. (NRSC 2002),
421
–426
(2002). Google Scholar
T. Walter et al.,
“Automatic detection of microaneurysms in color fundus images,”
Med. Image Anal., 11
(6), 555
–566
(2007). http://dx.doi.org/10.1016/j.media.2007.05.001 Google Scholar
I. Lazar, A. Hajdu and R. J. Quareshi,
“Retinal microaneurysm detection based on intensity profile analysis,”
in 8th Int. Conf. on Applied Informatics,
157
–165
(2010). Google Scholar
M. Ehler,
“Modifications of iterative schemes used for curvature correction in noninvasive biomedical imaging,”
J. Biomed. Opt., 18
(10), 100503
(2013). http://dx.doi.org/10.1117/1.JBO.18.10.100503 Google Scholar
A. R. Rouse and A. F. Gmitro,
“Multispectral imaging with a confocal microendoscope,”
Opt. Lett., 25
(23), 1708
–1710
(2000). http://dx.doi.org/10.1364/OL.25.001708 Google Scholar
C. Yuan et al.,
“In vivo accuracy of multispectral magnetic resonance imaging for identifying lipid-rich necrotic cores and intraplaque hemorrhage in advanced human carotid plaques,”
Circulation, 104
(17), 2051
–2056
(2001). http://dx.doi.org/10.1161/hc4201.097839 CIRCAZ 0009-7322 Google Scholar
I. Kuzmina et al.,
“Towards noncontact skin melanoma selection by multispectral imaging analysis,”
J. Biomed. Opt., 16
(6), 060502
(2011). http://dx.doi.org/10.1117/1.3584846 JBOPFO 1083-3668 Google Scholar
J. M. Kainerstorfer et al.,
“Principal component model of multispectral data for near real-time skin chromophore mapping,”
J. Biomed. Opt., 15
(4), 046007
(2010). http://dx.doi.org/10.1117/1.3463010 JBOPFO 1083-3668 Google Scholar
M. Ehler et al.,
“Modeling photo-bleaching kinetics to create high resolution maps of rod rhodopsin in the human retina,”
PLoS One, 10
(7), e0131881
(2015). http://dx.doi.org/10.1371/journal.pone.0131881 POLNCL 1932-6203 Google Scholar
I. Styles et al.,
“Quantitative analysis of multi-spectral fundus images,”
Med. Image Anal., 10
(4), 578
–597
(2006). http://dx.doi.org/10.1016/j.media.2006.05.007 Google Scholar
C. Zimmer et al.,
“Innovation in diagnostic retinal imaging: multispectral imaging,”
Retina Today, 9
(7), 94
–99
(2014). Google Scholar
W. Czaja and M. Ehler,
“Schödinger eigenmaps for the analysis of bio-medical data,”
IEEE Trans. Pattern Anal. Mach. Intell., 35
(5), 1274
–1280
(2013). http://dx.doi.org/10.1109/TPAMI.2012.270 ITPIDJ 0162-8828 Google Scholar
Y. Xu et al.,
“A light-emitting diode (LED)-based multispectral imaging system in evaluating retinal vein occlusion,”
Lasers Surg. Med., 47
(7), 549
–558
(2015). http://dx.doi.org/10.1002/lsm.22392 Google Scholar
BiographySyed Ayaz Ali Shah received his master degree in electrical engineering from NWFP University of Engineering and Technology Peshawar, Pakistan, in 2007. He is currently working toward the PhD degree at the Center of Intelligent Signal and Imaging Research (CISIR), Department of Electrical and Electronic Engineering, Universiti Teknologi PETRONAS, Malaysia. He is the recipient of PETRONAS graduate assistantship scheme. His research interest includes medical image analysis, image processing, pattern recognition and computer vision. Augustinus Laude is head, research and a senior consultant of Ophthalmology in the National Healthcare Group Eye Institute at Tan Tock Seng Hospital. He received his MBChB degree from the University of Edinburgh, and completed his fellowship with the Royal College of Surgeon in Edinburgh and the Academy of Medicine Singapore. He is an adjunct assistant professor at Nanyang Technical University and Adjunct Clinician Scientist at Singapore Eye Research Institute. His clinical and research interests include cataract surgery, macula diseases and low vision. Ibrahima Faye is an associate professor at Universiti Teknologi PETRONAS. His BSc, MSc and PhD degrees in mathematics are from University of Toulouse, France, while his MS degree in engineering of Medical and Biotechnological data is from Ecole Centrale Paris, France. His research interests include Engineering Mathematics, Signal and Image Processing, Pattern Recognition, and Dynamical Systems. Tong Boon Tang is an associate professor of electrical & electronic engineering at the Universiti Teknologi PETRONAS. He received his PhD and BEng(Hons) degrees both from the University of Edinburgh. He is a recipient of IET Nanobiotechnology Premium Award and Lab on Chip Award. His research interests are in biomedical instrumentation, from device and measurement to data fusion. He is an associate editor of Journal of Medical Imaging and Health Informatics. |

