
|
|
1.IntroductionHigh-resolution visualization of the retinal morphology can assist ophthalmologists to better understand the pathogenesis of retinal diseases. In glaucoma, for example, studies on nonhuman primates have indicated that morphological changes in the lamina cribrosa may precede the degeneration of retinal ganglion cell axons.1–3 Similarly, changes in the density of the photoreceptor mosaic are associated with functional vision loss and retinal degeneration.4,5 Optical coherence tomography (OCT) provides cross-sectional images of the retina with exquisite axial resolution, and is commonly used in ophthalmology. In OCT, the axial resolution is determined by the source spectrum, whereas the lateral resolution is determined by the numerical aperture (NA) of the sample arm. For retinal OCT imaging, the cornea and lens act as the imaging objective, so the beam diameter at the pupil determines the NA and hence the focused spot size at the retina. Clinical OCT systems operating at an 830-nm center wavelength commonly use a beam diameter of at the cornea, corresponding to a lateral resolution on the order of at the retina. This resolution is approximately one order of magnitude worse than the theoretical best axial OCT resolution, which is on the order of to . By increasing the probe beam diameter at the cornea, the lateral resolution can be (in principle) improved, but this approach reduces the depth-of-focus as a trade-off. Since imaging through the entire thickness of the retina and structures of the optic nerve head (ONH) is desirable, high lateral resolution with short depth-of-focus may not be suitable in the clinical environment. Therefore, an extended depth-of-focus imaging system capable of maintaining high lateral resolution within the layers of interest is important. Many methods have been proposed in the literature to overcome this axial depth limitation. These methods include mechanical motion of the sample arm,6 the addition of focus-modulating elements, such as acousto-optic tunable lenses and axicon lenses, and adaptive optics.7–10 Multibeam systems have also been reported.11 Computational approaches such as interferometric synthetic aperture microscopy12,13 and the Gabor-based fusion technique with dynamic focus using liquid lens14 have also been successfully used to correct for defocus in postprocessing and provide axial focus extension. In this paper, we describe an autofocus and high-speed swept-source (SS) OCT imaging system for acquiring in vivo high-resolution images of the entire retinal structure and ONH using a focus-stacking method. Since recent developments in SS-OCT engines have resulted in longer imaging depths as compared with spectral domain-OCT (SD-OCT) systems,15 the entire thickness of the retina can be visualized even with a high-NA sample arm. However, a tightly focused spot reduces the intensity in the regions outside the focal depth. Similarly, high lateral resolution imaging is limited to the depth-of-focus. In order to overcome these limitations, in this study, a commercially available variable-focus liquid lens was incorporated into an SS-OCT system, and controlled by a graphics processing unit (GPU)-based data acquisition platform. In the GPU-based real-time autofocus processing algorithm/pipeline, focus optimization was performed at a user-specified layer and facilitated by real-time axial tracking to extract the same retinal layer throughout the optimization process. Following the optimization, multiple volumes at different focal depths in the retina were successively acquired. In order to achieve high lateral resolution throughout the imaging depth, Gaussian-weighted averaging was applied to the focus-stacked volumes, permitting visualization of the retina along the entire axial extent with high resolution. We demonstrated imaging of the entire three-dimensional (3-D) morphology of the ONH in vivo, from which we can study the morphological changes in the nerve fiber layer (NFL) and lamina cribrosa due to diseases such as glaucoma.16–21 The system is compact in size and capable of imaging the human retina with sufficiently large field of view, which complements our on-going clinical studies.17,22 The remainder of this report is organized as follows: we first describe the optical design of our SS-OCT acquisition system. We next describe our custom-written GPU-accelerated retinal tracking and focus optimization algorithm that provided real-time en face visualization. The retinal tracking was combined with a simple but rapid segmentation algorithm that provided the metric for layer-specific focusing during optimization, as well as real-time feedback during the optimization process to the user. Last, we describe the acquisition and processing steps used to generate a focus-stacked dataset, and present images acquired from human volunteers. 2.MethodsIn order to demonstrate the clinical utility of the system, the posterior eye chamber of human volunteers without any remarkable retinal disorder were imaged. All protocols for measurement were approved by the Office for Research Ethics at Simon Fraser University. Written and informed consent was obtained prior to imaging. Figure 1 shows the schematic of our custom-built 1060-nm swept-source OCT system. A wavelength swept laser (Axsun Technologies, Massachusetts) with a scanning frequency of 100 kHz, a center wavelength of 1060 nm and a full width half maximum (FWHM) of 85 nm was used as a light source. The swept laser had a duty cycle of around 66% and hence has a dead time between the wavelength scans of approximately . In order to increase the A-scan rate from 100 kHz to 200 kHz, we implemented a “double-buffered configuration.”23 The swept-source output was split into original and buffered fiber paths by a 60:40 fiber coupler, with 60% of the optical power route to the buffered path. A single-mode fiber spool of (HI1060, Corning, New York) was placed in the buffered path to create a delay of between the two paths. The original and buffered paths were recombined using a fast optical switch (Nanona Optical Switch, Boston Applied Technologies, Inc., Massachusetts) that had a switch time of and a maximum cross-talk suppression of 26 dB.24 The switch output was split , with 90% of the power going to the OCT system, and the other 10% going to the k-clock calibration signal. The switch was controlled using a 100-kHz square wave signal that was generated using the data acquisition card (National Instruments, Texas) and synchronized to the A-scan trigger provided by the swept-source laser. The duty cycle of the swept-source engine was over 50%; however, by tuning the timing of the square wave signal, we were able to preserve the portion of the spectrum with the greatest intensity. The double-buffered spectrum had a reduced FWHM bandwidth of 75 nm, corresponding to an estimated coherence length of ~6.6 μm (in air). A Fiber-Bragg grating (FBG, OE Land, Quebec, Canada, , , ) was connected to the other port of the switch to generate the A-scan trigger. This FBG was designed to reflect a narrow wavelength band located near the beginning of the spectrum, outside of the 3-dB bandwidth. In Fig. 1, a schematic of the double-buffered source and its connections to the A-scan trigger, k-clock, and OCT system is presented. Fig. 1Schematic of double-buffered 200-kHz SS-OCT system, including the A-scan trigger (TRIG), sampling clock (CLK), and OCT system (OCT). A variable-focus liquid lens (VL) was included in the sample arm to provide dynamic focus adjustment. The sample arm consisted of two telescopes that relayed the conjugate plane from the VL to the scanning mirror and pupil. DC: dispersion compensation; BPD: balanced photo-diode detector; FBG: Fiber-Bragg grating; GM: galvanometer-scanning mirror; : collimating lens. 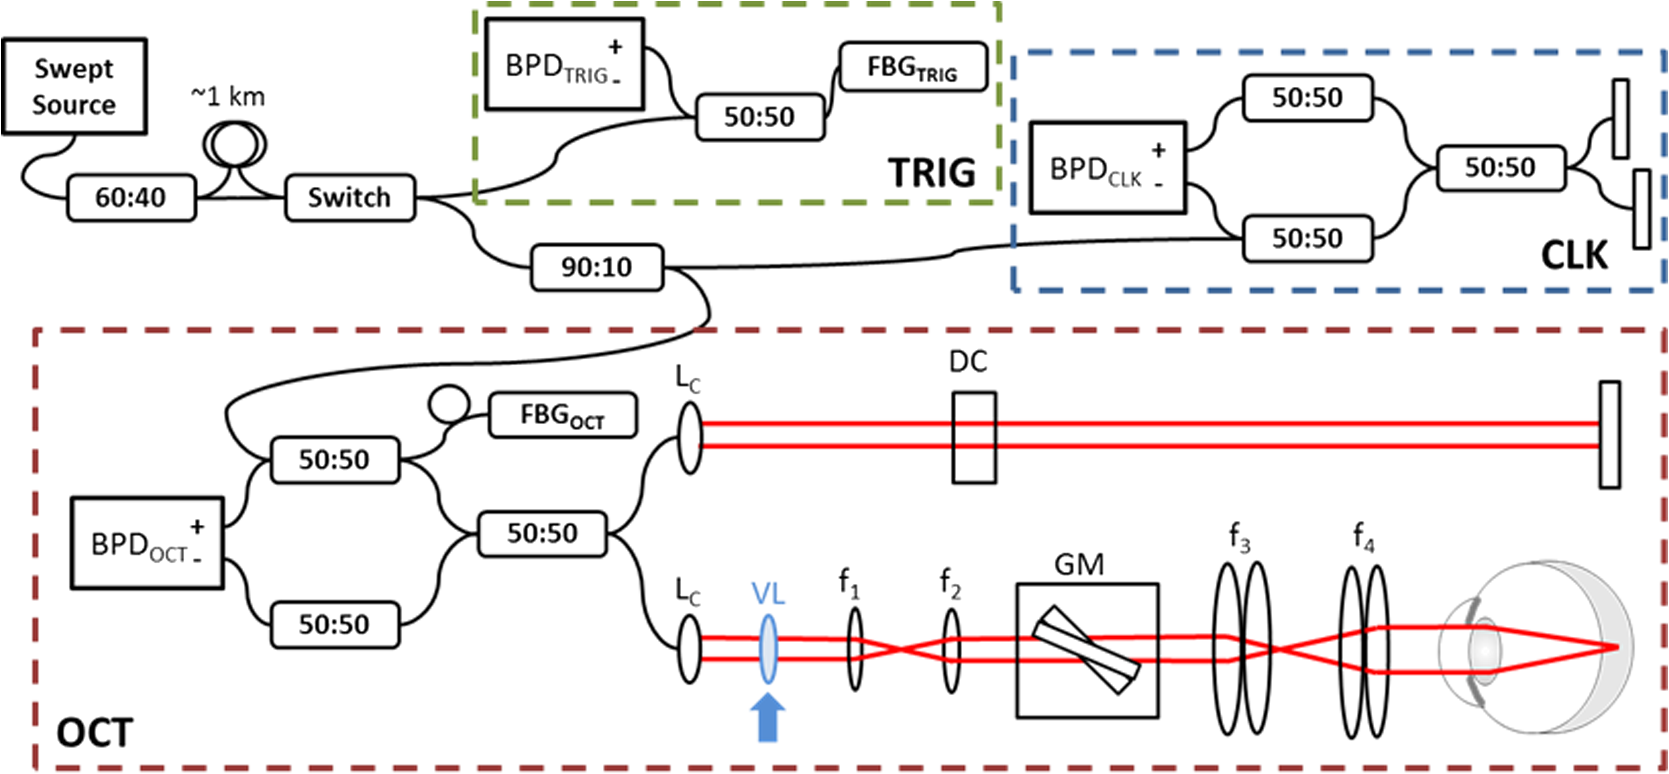 The OCT interferometer consisted of three wavelength-flattened couplers in a balanced configuration. A variable-focus lens (VL; ARCTIC 316-AR850, Lyon, France) was added to dynamically adjust the focus of the OCT beam to a user-selected retinal layer. The VL had a dynamic range of 18 diopters ( to ), which resulted in an ocular diopter shift of 29 D ( to 20 D). Two telescopes were placed between the VL and ocular pupil to relay the VL, galvanometer-scanning mirrors, and pupil on conjugate planes. The sample arm delivered a 3.0-mm ( diameter) beam to the pupil, resulting in a calculated spot size (FWHM) with depth-of-focus (calculated as twice the Rayleigh range) at the retina. 2.1.Optical Coherence Tomography Image Acquisition, Segmentation, A-scan Alignment, and OptimizationFigure 2 shows two different scanning protocols used for the volume acquisition. For the conventional approach shown in Fig. 2(a), we used a raster scan pattern with 80% duty cycle. Each acquired volume consisted of A-scans, which resulted in an acquisition rate of . A radial scan approach [Fig. 2(b)] was adopted for regions that exhibited centro-symmetry, such as the ONH. In these regions, dense sampling was desirable near the center, whereas sparser-sampling was acceptable near the periphery. For radially acquired data, 180 to 300 B-scans per volume were acquired evenly spaced in angle, with 600 A-scans per B-scan. Each volume took 0.8 to 1.2 s to acquire. Fig. 2(a) Raster and (b) radial scanning protocols. Radial scan was adopted for regions that exhibited radial symmetry, and required denser sampling in the center relative to the periphery.  Our open-sourced GPU-accelerated FD-OCT acquisition code was modified for this project.25–27 For this work, the GPU used was a GeForce GTX Titan (NVIDIA, Santa Clara, California) that provided a 1024-pt A-scan processing rate of 4 MHz, which is significantly faster than the data acquisition rate, and thus permitting computational bandwidth for additional processing. The phase instability caused by fluctuations in the synchronization between the wavelength sweep of the light source and digitizer trigger signal resulted in undesirable horizontal-line artifacts in the B-scans, which degraded the image quality and potentially interfered with the retinal axial tracking algorithm. Figure 3 shows the B-scan OCT image before (a) and after (b) stabilizing the phase of OCT signal. In the stabilization process, the artifacts appearing as horizontal lines in Fig. 3(a) were removed in real-time on the GPU by aligning each A-scan to a reference wave number that was provided by the FBG (OE Land, QC, Canada, , , ) in the OCT interferometer (Fig. 1).28 Fig. 3DC line artifacts due to A-scan misalignments. (a) The DC line artifact is shown with an arrow before the alignment. (b) Alignment of A-scans removed the artifact. Scale bars denote .  A simple segmentation algorithm was implemented in the GPU processing platform to provide real-time axial tracking of the retinal position, which changed due to patient motion, and display of en face images from specific layers during acquisition (Fig. 4). The algorithm tracked the relative position of the brightest layer in the retina to remove the effects of axial motion from the en face image. The user selected the thickness of the en face layer of interest (indicated by red lines), as well as two reference A-scan positions on the retina (indicated by yellow lines) to be used for tracking [Fig. 4(a)]. At each reference position, the algorithm determined the pixel with the maximum intensity (indicated by the short blue lines), and used the coordinates to determine the degree of retinal tilt (if present) as shown in Figs. 4(b) and 4(c). During acquisition, the user could dynamically adjust the axial offset between the selected layer and brightest layer to display different retinal layers in en face projection view shown in Fig. 4(d). Fig. 4Simple segmentation algorithm for real-time axial tracking and en face visualization. (a) The user manually selected the thickness of en face layer (red lines) and two a-scans for segmentation (yellow lines). (b) The algorithm detected the maximum-intensity pixel at each location (blue bars). (c) The location of the brightest layer in the retina (green line) was interpolated from the two maximum-intensity pixels (blue bars). This location was then used to determine the tilt in the other en face layers. (d) The en face image was generated by summing up the pixels within the two red lines. The image was taken at an eccentricity of from the fovea. Scale bars denote .  An optimization algorithm was also developed to provide automated focusing on specific layers. The optimization had a multipass approach, starting with a large search range, and then fine-tuning the search range in successive passes. The brightness of the selected layer was used as the metric for optimization. In the first pass, the optimization algorithm applied seven different ocular diopter values within a 5-D to 7-D range and recorded the resultant brightness at the specified layer. In the subsequent passes, the algorithm tested a narrower range around the diopter value that gave the maximum intensity in the previous round. For each diopter shift, 10 stationary B-scans/volumes were acquired and used to determine the summed intensity within the selected en face region. Thus, we had an optimization rate of , and the entire optimization process took approximately 1 s. 2.2.Focus-Stacking AlgorithmHigh-resolution images of the ONH structures were acquired by merging a set of focus-shifted volumes acquired using the radial scanning protocol. First, we automatically optimized the focus at the NFL and lamina cribrosa, respectively, to determine the range of diopter shifts required during acquisition. A set of 3 to 5 volumes were then acquired, with the focus shifted axially between acquisitions. The optimization algorithm steps, which included tracking, segmentation, autofocus, and tilt measurement, were performed on the same B-scan location in each volume. This pipeline was also applicable for the raster scanning acquisition protocol. Eye motion artifacts were mitigated by using a double-buffered swept source OCT for rapid volume acquisition. However, even small motion artifacts would cause the structures in the focus-stack volumes to mismatch. In order to compensate for the mismatches, motion correction was performed in postprocessing after completing the multivolume acquisition. The relative translation between B-scans was assessed using phase correlation, and B-scan to B-scan motion registration was performed. After the two-dimensional (2-D) motion registration and conversion to Cartesian coordinates, volumetric registration was performed using the three-dimensional (3-D) rigid registration toolbox in Amira (FEI, Oregon), followed by 3-D nonrigid registration using the medical image registration toolbox.29,30 For the 3-D registration, each volume in the focus-stacked dataset was registered to the previously acquired volume to maximize the amount of information overlap during the registration. After the volume registration, the A-scans within each volume were summed to determine the position of the best focus within the volume, since the depth at which the volume is focused will have greater intensity than the out-of-focus regions. From the comparison of the A-scans, the peak intensity locations are approximated so that the separations between the peaks are evenly spaced. A set of Gaussian masks were automatically generated at the approximated focus locations and normalized to perform weighted averaging, which resulted in a high-resolution volume of the entire ONH.31 3.ResultsFigure 5 shows the en face views generated using our segmentation and en face display code, as presented in real-time during acquisition. The B-scans were also included to show the results of the segmentation, and the thickness and location of the en face layer. In the en face image generated from the segmented B-scans, the nerve fiber bundles are clearly visualized. In comparison, without segmentation, artifacts from retinal tilt and axial motion degrade the en face image, and the resultant en face view is not from a single layer, but is instead a contribution from multiple layers. Fig. 5Real-time en face visualization (a) without and (b) with retinal tracking and anatomically based segmentation on a volume acquired using a raster scanning method. Scale bar denotes .  Figure 6 shows representative en face images of the NFL (b) and the outer plexiform layer (OPL) (c), with the focus automatically optimized at the corresponding layer marked by red-dashed lines in the B-scan OCT image (a). The high resolution of the system permitted visualization of the nerve fiber bundles in the retinal NFL, and the capillary network of the OPL with high contrast. Fig. 6En face images acquired using a raster scanning method with (a) focus on the (b) NFL and (c) microvasculature of the OPL. Scale bar denotes . 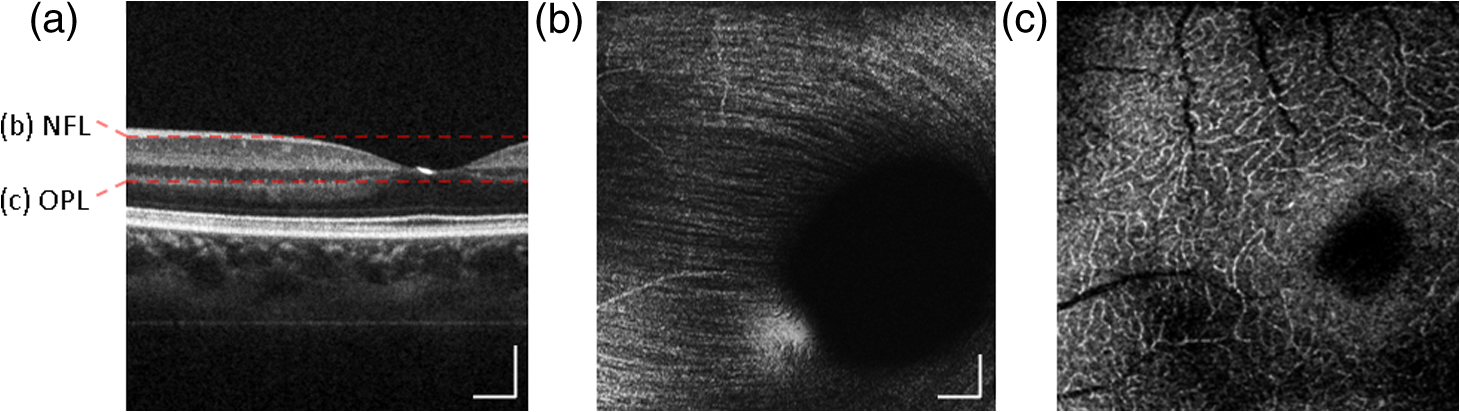 Figure 7 shows the focus-stacking result with a representative data set acquired at the ONH. In the representative B-scan OCT images shown in Figs. 7(a)–7(c), focus was set at: (a) the retinal surface, (b) the bottom of the cup, and (c) the lamina cribrosa. The summation result of A-scans within each volume set and the corresponding Gaussian masks are also shown in Figs. 7(d) and 7(e). Figures 7(f) and 7(g) are the stitched result of three different focus-stacked B-scans and the en face view of the focus-stacked dataset, respectively. In addition, as shown in Fig. 8, depth-resolved images of the lamina cribrosa microarchitecture can also be visualized from the focus-stacked data set. Fig. 7Focus-stacking processing and results, acquired using a radial scanning method. (a)–(c) A set of volumes focused at different depths, from the NFL (a) to the lamina cribrosa (c) were acquired. (d) The summed A-scans from each volume are compared to determine the focused depth of each volume. For a given volume, the position of best focus will correspond to the depth at which the summed intensity is at maximum in comparison to the other volumes. (e) From the comparison of the summed A-scans, a set of Gaussian masks are generated to perform weighted-averaging of the volumes. (f) Each B-scan from (a)–(c) is stitched together. Representative B-scan from the focus-stacked volume shows uniformly high resolution across the entire extent. (g) The stitched results showing the focus-stacked dataset. The entire ONH region is in focus, in comparison to the originally acquired data sets. Scale bars denote .  4.DiscussionWe have demonstrated a focus-stacking OCT imaging system with real-time image-based axial retinal tracking and focus optimization. Using the system, we were able to image the ONH with high resolution throughout the axial extent of the structure, from which we could clearly visualize the lamina cribrosa microarchitecture as well as the inner retinal layers. Both of these parameters are important in better identifying factors that precede vision loss in glaucoma.1,17,22,32,33 We also demonstrated the capability of the system in visualizing the macular microvasculature in the OPL and the pattern of nerve fiber bundles emanating from the ONH toward the macula. The ability to visualize and quantify the appearance of nerve fiber bundles traversing the retinal surface has potential as a sensitive early diagnostic biomarker.16,34,35 Furthermore, we employed two scanning protocols, raster and radial scanning. Figure 9 shows a comparison between the raster (left column) and radial scan (right column) methods at the ONH. The radial scan had a reduced overall number of sampling points compared to the raster scan pattern, effectively reducing the acquisition time by . The radial scan pattern provided more densely spaced samples at the lamina cribrosa located at the center of the imaging field, whereas the outer region of the scan was under-sampled. The missing data points were reconstructed using a 2-D cubic interpolation, permitting measurements of peripapillary NFL thickness.36 These centro-symmetrical high sampling characteristics make the radial scanning method more efficient in the case of imaging the ONH. Fig. 9Comparison of (a) raster scanning () and (b) radial scanning () methods focused at the lamina cribrosa. Similar regions (i)–(ii) and (iii)–(iv) are selected from (a) and (b), respectively, and averaged in axial directions. The corresponding en face images are displayed in (i)–(iv). Scale bar denotes .  A key component of our imaging system was the GPU-accelerated real-time retinal tracking and focus optimization algorithm, which allowed real-time en face visualization of a user-selected retinal layer for feedback during acquisition as well as layer-specific optimization. By performing the relevant preprocessing steps in real time, such as A-scan alignment for timing jitter removal and interframe averaging for noise reduction, we were able to successfully track the axial position of the retina using a relatively simple segmentation algorithm, permitting visualization of en face retinal images with meaningful correspondence to the cellular layer physiology. The real-time image-based axial tracking and segmentation also allowed us to fine-tune our optimization to focus on specific retinal layers instead of optimizing for the brightness along the entire retina. However, there are several limitations in our study. First, although the focus optimization time was reduced down to 1 s by using a GPU-based processing platform, it is still not fast enough to avoid accommodation of the eye, which could affect the optimization result and reduce the image quality. Second, the retinal tracking method based on a simple segmentation algorithm would not properly work in cases where edema, drusen, intra- or subretinal fluid distorted the shape of retina. With higher-end GPUs and/or multi-GPU configurations, more sophisticated retinal layer segmentation algorithms will be realizable in real time. The development of higher speed focus optimization algorithms and more sophisticated segmentation algorithms for robust tracking of the retina in nonideal conditions is the focus of a future study. Last, because of the limited dynamic range of the variable-focus liquid lens, as described in Sec. 2, our current system has limited capabilities in highly myopic subjects. The diameter of the imaging beam at the subject’s pupil was limited to . With this imaging beam diameter, the dominant aberrations in a normal population of young subjects were defocus and astigmatism.37 In this work, we demonstrated the ability to track and optimize the image quality based on defocus; however, these techniques are equally applicable to astigmatism. Liquid lenses capable of correcting both defocus and astigmatism are approaching commercial availability, but a prototype was not available for demonstration at the time of this work. We have selected the 3-mm imaging beam diameter because it permits an optical design of the sample arm that provides high resolution over a clinically valuable wide field of view. Recently, we demonstrated a wavefront sensorless adaptive optics spectral domain OCT (WSAO-SD-OCT) system for in vivo human retinal imaging.17,22 With the GPU-based data acquisition and processing, real-time cellular retinal structure imaging was performed with high lateral resolution achieved by the modal-based wavefront sensorless algorithm. The WSAO-SD-OCT was capable of optimizing up to 12 Zernike modes, thereby allowing resolution of which was sufficient for resolving the cone mosaic in the human retina, even at small angles of eccentricity in nonmydriatic pupils. However, the narrow field of view and long optimization time (around 6 to 12 s) limited the system’s suitability for clinical applications. In this work, we introduced real-time retinal tracking implemented on a GPU. Tracking the axial position of the retina in real time adds robustness to the image-based merit function, and is essential for clinical imaging. The development of hardware-based axial eye tracking has been reported by Pircher et al.38 In this work, we utilize high-speed B-scan image acquisition and real-time processing to achieve retinal tracking in a software solution. The goal of our system was to build a clinically friendly imaging system that was capable of providing high-resolution information to complement existing retinal imaging systems and glaucoma studies.17,22 Thus, although our system resolution of was lower than the lateral resolution achievable from the previous reported WSAO-SD-OCT, we were able to acquire volumes across a relatively larger field of view with sufficiently high resolution and high speed to visualize the microarchitecture of the entire ONH. The inclusion of both high resolution and wide field of view is important for visualizing the pathological changes due to glaucoma in the ONH and in the NFL. For example, visualization of the circumpapillary nerve fibers in combination with the measurement of retinal NFL thickness has the potential to improve sensitivity and specificity in detecting glaucoma.16 We demonstrated human retinal imaging with a VL for defocus correction and dynamic focus adjustment. The lateral resolution in the retina could be further improved through the correction of low-order aberrations, such as astigmatism, in addition to defocus. Although the pupil diameter of the imaging beam used in this system is larger than that in common commercial OCT instruments in the 830-nm wavelength range, the ocular aberrations from the small sample size of subjects imaged (five people with normal eye health, and mild myopia) did not noticeably detract from the image quality. We anticipate replacing the VL element with a more sophisticated adaptive lens to build a compact system that can correct for higher-order optical aberrations using image-driven optimization.39,40 For example, Liebertraut et al.41 reported a flexible elastomer based tunable microlens capable of tuning astigmatism as well as defocus. Alternatively, integrating the multiactuator adaptive lens42 into the OCT system presented in this report to correct for low-order aberrations (astigmatism) would allow for a compact and simple retinal imaging system that would be suitable for translation to the clinic. 5.ConclusionEn face view of OCT stacks provides important and complementing visualizations of the retina and ONH investigating biomarkers of glaucoma preceding vision loss. We demonstrated the combination of high-performance massively parallel processing of SS-OCT volumetric data for real-time axial tracking and display. In combination with an electrically controllable VL, we demonstrated acquisition of focus-stacked OCT volumes with high resolution throughout an extended depth range. AcknowledgmentsThe authors would like to acknowledge funding support from the Canadian Institutes of Health Research (CIHR), Natural Sciences and Engineering Research Council of Canada (NSERC), and the Michael Smith Foundation for Health Research (MSFHR). ReferencesA. J. Bellaza et al.,
“Deformation of the lamina cribrosa and anterior scleral canal wall in early experimental glaucoma,”
Invest. Ophthalmol. Vis. Sci., 44
(2), 623
–637
(2003). http://dx.doi.org/10.1167/iovs.01-1282 IOVSDA 0146-0404 Google Scholar
J. Crawford Downs, M. D. Roberts and I. A. Sigal,
“Glaucomatous cupping of the lamina cribrosa: a review of the evidence for active progressive remodeling as a mechanism,”
Exp. Eye Res., 93
(2), 133
–140
(2011). http://dx.doi.org/10.1016/j.exer.2010.08.004 EXERA6 0014-4835 Google Scholar
B. Wang et al.,
“In vivo lamina cribrosa micro-architecture in healthy and glaucomatous eyes as assessed by optical coherence tomography,”
Invest. Ophthalmol. Vis. Sci., 54
(13), 8270
–8274
(2013). http://dx.doi.org/10.1167/iovs.13-13109 IOVSDA 0146-0404 Google Scholar
C. A. Curcio,
“Photoreceptor topography in ageing and age-related maculopathy,”
Eye, 15
(Pt 3), 376
–383
(2001). http://dx.doi.org/10.1038/eye.2001.140 Google Scholar
S. S. Choi et al.,
“In vivo imaging of the photoreceptor mosaic in retinal dystrophies and correlations with visual function,”
Invest. Ophthalmol. Vis. Sci., 47
(5), 2080
–2092
(2006). http://dx.doi.org/10.1167/iovs.05-0997 IOVSDA 0146-0404 Google Scholar
M. Pircher, E. Götzinger and C. K. Hitzenberger,
“Dynamic focus in optical coherence tomography for retinal imaging,”
J. Biomed. Opt., 11
(5), 054013
(2006). http://dx.doi.org/10.1117/1.2358960 JBOPFO 1083-3668 Google Scholar
I. Grulkowski, K. Szulzycki and M. Wojtkowski,
“Microscopic OCT imaging with focus extension by ultrahigh-speed acousto-optic tunable lens and stroboscopic illumination,”
Opt. Express, 22
(26), 31746
(2014). http://dx.doi.org/10.1364/OE.22.031746 OPEXFF 1094-4087 Google Scholar
R. A. Leitgeb et al.,
“Extended focus depth for Fourier domain optical coherence microscopy,”
Opt. Lett., 31
(16), 2450
(2006). http://dx.doi.org/10.1364/OL.31.002450 OPLEDP 0146-9592 Google Scholar
C. Blatter et al.,
“Extended focus high-speed swept source OCT with self-reconstructive illumination,”
Opt. Express, 19
(13), 12141
–12155
(2011). http://dx.doi.org/10.1364/OE.19.012141 OPEXFF 1094-4087 Google Scholar
K. Sasaki et al.,
“Extended depth of focus adaptive optics spectral domain optical coherence tomography,”
Biomed. Opt. Express, 3
(10), 2353
–2370
(2012). http://dx.doi.org/10.1364/BOE.3.002353 BOEICL 2156-7085 Google Scholar
J. Holmes,
“Theory and applications of multi-beam OCT,”
Proc. SPIE, 7139 713908
(2008). http://dx.doi.org/10.1117/12.821006 PSISDG 0277-786X Google Scholar
S. G. Adie et al.,
“Computational adaptive optics for broadband optical interferometric tomography of biological tissue,”
Proc. Natl. Acad. Sci. U. S. A., 109
(19), 7175
–7180
(2012). http://dx.doi.org/10.1073/pnas.1121193109 Google Scholar
Y. Z. Liu et al.,
“Computed optical interferometric tomography for high-speed volumetric cellular imaging,”
Biomed. Opt. Express, 5
(9), 2988
–3000
(2014). http://dx.doi.org/10.1364/BOE.5.002988 BOEICL 2156-7085 Google Scholar
J. P. Rolland et al.,
“Gabor-based fusion technique for optical coherence microscopy,”
Opt. Express, 18
(4), 3632
–3642
(2010). http://dx.doi.org/10.1364/OE.18.003632 OPEXFF 1094-4087 Google Scholar
B. Potsaid et al.,
“Ultrahigh speed 1050 nm swept source/Fourier domain OCT retinal and anterior segment imaging at 100,000 to 400,000 axial scans per second,”
Opt. Express, 18
(19), 20029
–20048
(2010). http://dx.doi.org/10.1364/OE.18.020029 OPEXFF 1094-4087 Google Scholar
D. C. Hood et al.,
“Confocal adaptive optics imaging of peripapillary nerve fiber bundles: implications for glaucomatous damage seen on circumpapillary OCT scans,”
Transl. Vis. Sci. Technol., 4
(2), 12
(2015). http://dx.doi.org/10.1167/tvst.4.2.12 Google Scholar
S. Lee et al.,
“Optic nerve head and peripapillary morphometrics in myopic glaucoma,”
Invest. Ophthalmol. Vis. Sci., 55
(7), 4378
–4393
(2014). http://dx.doi.org/10.1167/iovs.14-14227 IOVSDA 0146-0404 Google Scholar
R. J. Zawadzki et al.,
“Adaptive optics-optical coherence tomography: optimizing visualization of microscopic retinal structures in three dimensions,”
J. Opt. Soc. Am. A, 24
(5), 1373
–1383
(2007). http://dx.doi.org/10.1364/JOSAA.24.001373 Google Scholar
O. P. Kocaoglu et al.,
“Adaptive optics optical coherence tomography at 1 MHz,”
Biomed. Opt. Express, 5
(12), 4186
–4200
(2014). http://dx.doi.org/10.1364/BOE.5.004186 BOEICL 2156-7085 Google Scholar
Z. Nadler et al.,
“In vivo three-dimensional characterization of the healthy human lamina cribrosa with adaptive optics spectral-domain optical coherence tomography,”
Invest. Ophthalmol. Vis. Sci., 55
(10), 6459
–6466
(2014). http://dx.doi.org/10.1167/iovs.14-15177 IOVSDA 0146-0404 Google Scholar
N. Sredar et al.,
“3D modeling to characterize lamina cribrosa surface and pore geometries using in vivo images from normal and glaucomatous eyes,”
Biomed. Opt. Express, 4
(7), 1153
–1165
(2013). http://dx.doi.org/10.1364/BOE.4.001153 BOEICL 2156-7085 Google Scholar
M. Young et al.,
“Comparison of the clinical disc margin seen in stereo disc photographs with neural canal opening seen in optical coherence tomography images,”
J. Glaucoma, 23
(6), 360
–367
(2014). http://dx.doi.org/10.1097/IJG.0b013e31829484a4 JOGLES Google Scholar
B. Potsaid et al.,
“Ultrahigh speed 1050 nm swept source/Fourier domain OCT retinal and anterior segment imaging at 100,000 to 400,000 axial scans per second,”
Opt. Express, 18
(19), 20029
–20048
(2010). http://dx.doi.org/10.1364/OE.18.020029 OPEXFF 1094-4087 Google Scholar
A. H. Dhalla, K. Shia and J. A. Izatt,
“Efficient sweep buffering in swept source optical coherence tomography using a fast optical switch,”
Biomed. Opt. Express, 3
(12), 3054
–3066
(2012). http://dx.doi.org/10.1364/BOE.3.003054 BOEICL 2156-7085 Google Scholar
Y. Jian, K. Wong and M. V. Sarunic,
“GPU accelerated OCT processing at megahertz axial scan rate and high resolution video rate volumetric rendering,”
Proc. SPIE, 8571 85710Z
(2013). http://dx.doi.org/10.1117/12.2006670 PSISDG 0277-786X Google Scholar
Y. Jian, K. Wong and M. V. Sarunic,
“Graphics processing unit accelerated optical coherence tomography processing at megahertz axial scan rate and high resolution video rate volumetric rendering,”
J. Biomed. Opt., 18
(2), 026002
(2013). http://dx.doi.org/10.1117/1.JBO.18.2.026002 JBOPFO 1083-3668 Google Scholar
J. Xu et al.,
“Real-time acquisition and display of flow contrast using speckle variance optical coherence tomography in a graphics processing unit,”
J. Biomed. Opt., 19
(2), 026001
(2014). http://dx.doi.org/10.1117/1.JBO.19.2.026001 JBOPFO 1083-3668 Google Scholar
R. Poddar et al.,
“Three-dimensional anterior segment imaging in patients with type 1 Boston Keratoprosthesis with switchable full depth range swept source optical coherence tomography,”
J. Biomed. Opt., 18
(8), 086002
(2013). http://dx.doi.org/10.1117/1.JBO.18.8.086002 JBOPFO 1083-3668 Google Scholar
E. Gibson et al.,
“Optic nerve head registration via hemispherical surface and volume registration,”
IEEE Trans. Biomed. Eng., 57
(10), 2592
–2595
(2010). http://dx.doi.org/10.1109/TBME.2010.2060337 IEBEAX 0018-9294 Google Scholar
S. Lee et al.,
“Exact surface registration of retinal surfaces from 3-D optical coherence tomography images,”
IEEE Trans. Biomed. Eng., 62
(2), 609
–617
(2015). http://dx.doi.org/10.1109/TBME.2014.2361778 IEBEAX 0018-9294 Google Scholar
M. Cua et al.,
“Morphological phenotyping of mouse hearts using optical coherence tomography,”
J. Biomed. Opt., 19
(11), 116007
(2014). http://dx.doi.org/10.1117/1.JBO.19.11.116007 JBOPFO 1083-3668 Google Scholar
T. W. Kim et al.,
“Imaging of the lamina cribrosa in glaucoma: perspectives of pathogenesis and clinical applications,”
Curr. Eye Res., 38
(9), 903
–909
(2013). http://dx.doi.org/10.3109/02713683.2013.800888 CEYRDM 0271-3683 Google Scholar
C. W. Spraul et al.,
“Morphometric changes of the choriocapillaris and the choroidal vasculature in eyes with advanced glaucomatous changes,”
Vision Res., 42
(7), 923
–932
(2002). http://dx.doi.org/10.1016/S0042-6989(02)00022-6 VISRAM 0042-6989 Google Scholar
M. F. Chen et al.,
“Adaptive optics imaging of healthy and abnormal regions of retinal nerve fiber bundles of patients with glaucoma,”
Invest. Ophthalmol. Vis. Sci., 56
(1), 674
–681
(2015). http://dx.doi.org/10.1167/iovs.14-15936 IOVSDA 0146-0404 Google Scholar
C. K. Leung et al.,
“Evaluation of retinal nerve fiber layer progression in glaucoma: a study on optical coherence tomography guided progression analysis,”
Invest. Ophthalmol. Vis. Sci., 51
(1), 217
–222
(2010). http://dx.doi.org/10.1167/iovs.09-3468 IOVSDA 0146-0404 Google Scholar
G. Kampougeris et al.,
“Peripapillary retinal nerve fibre layer thickness measurement with SD-OCT in normal and glaucomatous eyes: distribution and correlation with age,”
Int. J. Ophthalmol., 6
(5), 662
–665
(2013). http://dx.doi.org/10.3980/j.issn.2222-3959.2013.05.21 Google Scholar
J. F. Castejón-Mochón et al.,
“Ocular wave-front aberration statistics in a normal young population,”
Vision Res., 42
(13), 1611
–1617
(2002). http://dx.doi.org/10.1016/S0042-6989(02)00085-8 VISRAM 0042-6989 Google Scholar
M. Pircher et al.,
“In vivo investigation of human cone photoreceptors with SLO/OCT in combination with 3D motion correction on a cellular level,”
Opt. Express, 18
(13), 13935
–13944
(2010). http://dx.doi.org/10.1364/OE.18.013935 OPEXFF 1094-4087 Google Scholar
Y. Jian et al.,
“Wavefront sensorless adaptive optics optical coherence tomography for in vivo retinal imaging in mice,”
Biomed. Opt. Express, 5
(2), 547
–559
(2014). http://dx.doi.org/10.1364/BOE.5.000547 BOEICL 2156-7085 Google Scholar
K. S. K. Wong et al.,
“In vivo imaging of human photoreceptor mosaic with wavefront sensorless adaptive optics optical coherence tomography,”
Biomed. Opt. Express, 6
(2), 580
(2015). http://dx.doi.org/10.1364/BOE.6.000580 BOEICL 2156-7085 Google Scholar
P. Liebetraut et al.,
“Elastomeric lenses with tunable astigmatism,”
Light Sci. Appl., 2
(9), e98
(2013). http://dx.doi.org/10.1038/lsa.2013.54 Google Scholar
S. Bonora et al.,
“Wavefront correction and high-resolution in vivo OCT imaging with an objective integrated multi-actuator adaptive lens,”
Opt. Express, 23
(17), 21931
(2015). http://dx.doi.org/10.1364/OE.23.021931 OPEXFF 1094-4087 Google Scholar
|


