
|
|
|
In the cardiovascular system, arteries transport red blood cells (RBCs) containing oxygenated hemoglobin to capillaries, where oxygen is extracted to cells. Next, the oxygen-unloaded RBCs flow to veins. In a healthy circulation system, the concentration of oxygenated hemoglobin in arteries is much higher than that in veins and is reflected in a higher value of oxygen saturation of hemoglobin (). In contrast, as a cancerous tumor grows in tissue, angiogenesis causes vessel remodeling to supply the tumor tissue with oxygen and nutrition.1 This process may lead to the development of arteriovenous (AV) shunts—abnormal vessels that directly connect arteries with veins. In the tumor microvasculature, AV shunts result in high in veins. The resultant dysfunctional microcirculation2 alters the drug delivery efficiency.3 Recently, controlling tumor growth by normalizing the tumor circulation has attracted increasing interests, either by using antiangiogenic drugs alone4 or by combining antiangiogenic drugs and chemotherapy.3 However, early detection of the AV shunt effect in tumor development remains a challenge. The AV shunt effect has been studied with several imaging modalities.5–11 For example, intravital microscopy (IVM) has been used to quantify the hemodynamic changes in the AV shunt.7,11 However, IVM is invasive because it generally requires surgical preparation to observe capillaries. Other imaging modalities, such as large-field gamma imaging, sidestream dark-field imaging, x-ray imaging, and two-photon microscopy, have been adopted for studying the effect.5–10 However, these techniques either lack sufficient spatial resolution or need exogenous contrast agents. More importantly, none of the techniques mentioned above can detect AV shunting by monitoring . In comparison, optical-resolution photoacoustic microscopy (OR-PAM)12,13 can overcome the above limitations. OR-PAM uses endogenous optical absorption contrast to achieve label-free, high-resolution, noninvasive imaging of microvasculature.14,15 In addition to structural imaging, OR-PAM also enables measuring functional hemodynamic parameters including the concentration of hemoglobin and ,14 blood flow velocity,16,17 and the metabolic rate of oxygen.14 Moreover, OR-PAM has been applied to the study of metabolism in tumors and has demonstrated its capability to longitudinally monitor tumor growth.14,18 However, so far, the AV shunt effect has not been studied by OR-PAM in detail. In this letter, we hypothesize that the AV shunt effect can be detected downstream of a tumor by its abnormal value. Specifically, we are interested in the spatial and temporal distributions of in veins draining from normal and abnormal regions. To validate our hypothesis, we first conducted a phantom experiment to study the spatial distribution due to both oxygen and hemoglobin diffusions. Then we investigated confluence vessels in a tumor in vivo. By imaging the AV shunts, we can trace the abnormal vessel back to the tumor. Our OR-PAM system (Fig. 1) uses a nanosecond-pulsed solid-state laser (INNOSLAB, Edgewave, 532- and 559-nm wavelengths; 30-kHz pulse repetition rate).19 The laser beam first passes through an iris (ID25SS, Thorlabs; 2-mm aperture). Then a spatial filtering stage consisting of a condenser lens (LA1131, Thorlabs) and a pinhole (P50C, Thorlabs) filters the laser beam. The spatially filtered beam is coupled into a single-mode photonic crystal fiber (LMA-10, NKT Photonics) by an objective lens (, , Leica). A beam sampler (BSF10-A, Thorlabs) and a homemade photodiode detector are placed before the fiber to monitor the laser intensity fluctuation. The output beam from the fiber is collimated by an objective lens (, Thorlabs) and then focused by another identical objective lens onto the target. The theoretical diffraction-limited optical focal diameter is . The sample absorbs the nanosecond pulse, which induces a local temperature rise. Subsequently, the increased temperature results in thermoelastic expansion that generates photoacoustic waves. The photoacoustic waves are reflected by an intervening layer of silicone oil between two prisms (Fig. 1) and then detected by an ultrasonic transducer (V214-BB-RM, Olympus-NDT). The detected photoacoustic signal is amplified by two electrical amplifiers in series (ZFL 500LN and Mini-Circuits) followed by digitization (ATS9350, Alazar Tech Inc.). Fig. 1Schematic of OR-PAM. BS, beam splitter; ConL, condenser lens; CorL, correction lens; FC, fiber coupler; ND, neutral density; PD, photodiode; RAP, right-angle prism; RhP, rhomboid prism; SMF, single-mode fiber; SO, silicone oil; and US, ultrasonic transducer.  To simulate the distribution at the confluence of an abnormal vein and a normal vein, we made a polycarbonate bifurcation tube phantom [Fig. 2(a)], which consisted of two identical smaller-diameter tubes (ID , OD ; CTPC187-250, Paradigm Optics) and a larger-diameter tube (ID , OD ; CTPC500-750, Paradigm Optics) to model the upstream daughter veins and the downstream parent vein, respectively. The junction of the three tubes was sealed by glue. The other ends of the two smaller-diameter tubes were connected to two individual syringes, each driven by a syringe pump (NE-300, Pump Systems, Inc.). We used blood with high (0.90) and low (0.54) in the two smaller-diameter tubes, from where the blood was pumped into the confluence tube. Fig. 2OR-PAM of AV shunt effect in phantom. (a) Schematic of phantom. Two smaller-diameter tubes (ID , OD ) are inserted into one larger-diameter tube (ID , OD ). One small tube was injected with oxygenated blood and the other with deoxygenated blood. The blood flow was controlled by a syringe pump for each small tube. The dashed box indicates the imaging region of interest. (b) Measured distributions at equivalent time points of 1.7, 4.2, 8.5, 42.0, 53.0, and 424.0 s. (c) averaged along versus at equivalent time points of 1.7, 4.2, 8.5, 42.0, 53.0, and 424.0 s. (d) Measured slopes along the direction at the center of the tube versus time and fit based on a diffusion model.  Given the blood flow speed, we can potentially obtain the time course of the distribution by scanning a large region of the confluence vessel. However, the limited field of view () of the OR-PAM system imposes a limited time window. Instead, we varied the upstream blood flow speed () from to and scanned an area of interest on the tube [ step size; image size, marked by the dashed box in Fig. 2(a)], located at a constant distance () from the confluence point. This approach allowed us to obtain the distribution at various effective time points () spread over a sufficiently large range. The experimental results at multiple time points (1.7, 4.2, 8.5, 42.0, 53.0, and 424.0 s) are shown in Fig. 2(b). To analytically study the distribution along the cross section of the confluence vessel [the -axis in Fig. 2(a)], we established a simple model based on Fick’s law of diffusion:20,21 where , , and denote the total flux of oxygen along the -axis, the effective oxygen diffusion coefficient, and bound oxygen concentration, respectively. Here, we assume that diffusion is governed by both free oxygen diffusion and RBC diffusion.22 The effective diffusion coefficient can be approximately estimated by where , , and , respectively, denote the solubility of oxygen, the slope of the quasilinear portion of the oxygen dissociation curve (i.e., the portion between and ), and the maximum concentration of oxygen carried by RBCs. Based on the thin-film solution,23 the distribution along the cross section of the confluence vessel can be expressed as where denotes the diameter of the tube.The measured values at each time point [Fig. 2(b)] were averaged along the -axis [Fig. 2(c)]. Then we chose the maximum slope of each curve with respect to to quantify the diffusion speed, to which the flux of oxygen is proportional according to Eq. (1). As shown in Fig. 2(d), the PAM-measured slopes were fitted with an effective diffusion coefficient () according to Eq. (3). The fitted effective diffusion coefficient is larger than the RBC diffusion coefficient () but smaller than the free oxygen diffusion coefficient () reported in the literature.22,24 This observation is likely due to that most oxygen (98.5%) is carried by RBCs, and only a small amount of free oxygen (1.5%) is dissolved in the blood. From Eq. (2), we obtain , which is comparable with the fitted value. These results predict that when the initial concentration difference is 0.36, a distinguishable boundary can persist for in a -diameter vessel. Note that the boundary corresponded to the point with the maximum slope with respect to of each averaged curve in Fig. 2(b). Moreover, the noise level was quantified by averaging the standard deviations over the undiffused high and low areas [dashed boxes in Fig. 2(b)]. The boundary is considered distinguishable if the difference in between these two areas is three times greater than the noise level. As the normal venous blood flow speed in mice is ,14 this boundary should be able to last for as long as 500 mm. To study the AV shunt effect in vivo, we imaged O-786 xenograft tumor in the mouse ear. The Animal Studies Committee of Washington University in St. Louis approved all animal care and experimental procedures. OR-PAM imaged the distribution of four mice, once per week for 6 weeks. All of them showed similar landscapes. As an example, Fig. 3 presents the map of a mouse ear at three different time points: the baseline before, 3 weeks after, and 5 weeks after tumor xenograft. First, we monitored the region enclosing the first bifurcation of the main vessel pair. For the baseline image, our measured values at the trunk vessel region in a healthy mouse ear were for arteries and for veins [Fig. 3(a), left], which agreed well with the literature.14 At week 3, an abnormal distribution was found, and portions of the veins expressed much higher values than expected [Fig. 3(a), middle]. Finally, the tumor at week 5 was fully established and affected the whole imaged region [Fig. 3(a), right]. In addition, the flow speed and diameter of the confluence vein (V3) were quantified to be and , respectively. According to Eq. (2), it should take 185 s for the high and low blood to mix in the confluence vessel, corresponding to distance at the given blood flow speed. In the week 3 image [Fig. 3(a), middle], the in vein V2 has a higher value than that for the baseline image. The abnormally high vein values were caused by an AV shunt. As a result, blood entering the confluence vessel (V3) was drained from one normal vein (V1) and one abnormal vein (V2). By analyzing the distribution, we found a clear boundary in the confluence vein (V3), and this boundary was maintained in the entire imaged vessel ( long). Fig. 3OR-PAM of AV shunt effect in a mouse ear in vivo. (a) images of a mouse ear acquired before (baseline), 3 weeks after, and 5 weeks after injection of the xenotransplanted O-786 cells. The blue dashed box encloses a highlighted region. V1, normal vessel; V2, week 3 abnormal vessel; V3, confluence vessel of V1 and V2; and V4, week 3 high vein. (b) Tiled image of the map in a mouse ear using a 3-D arbitrary trajectory scan (the corresponding movie is Video 1). The yellow dashed line bounds the predicted tumor region. F3 and F4, flow directions of veins V3 and V4. (c) Whole-ear map imaged by raster scan. The yellow dashed line region encloses the tumor region. . (Video 1, MOV, 237 kb) [URL: http://dx.doi.org/10.1117/1.JBO.21.2.020501.1]. 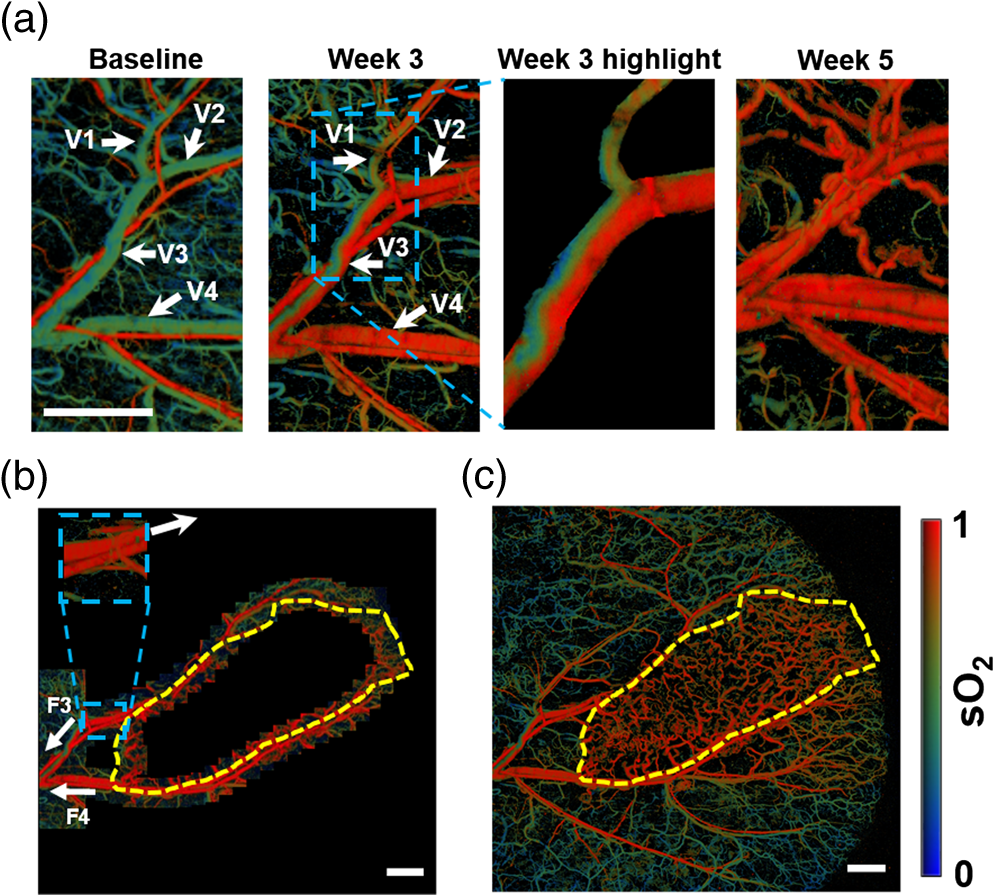 These measurements uncovered a new way to detect abnormal vessels in the shunted region—detecting the boundary at a spot far away from the tumor region and tracing these vessels back to the tumor region. To verify our approach, we first performed a raster scan and imaged a small region () of the trunk vessel. We identified the abnormal trunk vessels (V3 and V4) at week 3 in Fig. 3(a) and marked the direction of these blood flows (F3 and F4) in Fig. 3(b). Then we implemented a three-dimensional (3-D) arbitrary trajectory scan,19 which allowed 3-D position adjustment to trace the targeted vessels. By tracing these abnormal vessels against the flow direction to the bifurcation point, we identified the healthy region and the abnormal region based on values: the threshold value for an abnormal vein is defined as the mean of the values for a normal artery and vein. Next, we moved the scanning region by a small step (0.35 mm) based on the tangential direction of the targeted vessel in the abnormal region and repeated the procedures above. Here, the tangential direction of the vessel is calculated from the segment on the vein at the upstream side of the small window [inset in Fig. 3(b)]. Finally, all images were stitched together to form Fig. 3(b), and a corresponding movie is provided in Video 1. Based on the trace, we predicted the tumor region (yellow dashed circle) by enclosing the region with an abnormal value. To validate our prediction, we performed a whole ear raster scan [Fig. 3(c)] to identify the tumor region [yellow dashed circle in Fig. 3(c)], which is distinguished by vessels with abnormally high values and high density.14 By comparing with Fig. 3(b), we confirmed that the predicted tumor region agreed well with the tumor region. Here, the unique hemodynamic characteristic of the AV shunt, plus the low diffusion rate of hemoglobin, suggests that -based tracking can potentially be used as a new technique for early tumor detection. In summary, functional OR-PAM can noninvasively provide information with high spatial resolution and detect the AV shunt effect by mapping the distribution of a confluence vein near an early tumor region. The theoretical study and phantom experiments showed that the boundary induced by the AV shunt can persist for around 900 mm at the vessel parameters in the in vivo experiments. By using the distribution, we successfully traced an early tumor in a mouse ear in vivo. Our study suggests that the abnormal distribution induced by the AV shunt can potentially be used as a functional technique for early cancer detection. In the future, the penetration depth of functional OR-PAM can be improved by using near-infrared light for excitation, which is more weakly optically scattered than visible light.25 We also plan to apply our approach with photoacoustic computed tomography (PACT), which has a penetration depth of up to 8 cm.12 Although it is difficult to compensate for the unknown local fluence in PACT, a calibration-free method can be employed to achieve absolute measurement.26 By exploiting the ability to image the shunt effect, which identifies an abnormal vessel and its source, we may be able to trace early tumor growth in humans. AcknowledgmentsThe authors appreciate the close reading of the manuscript by Professor James Ballard. We also thank Cheng Ma, Pengfei Hai, and Hsun-Chia Hsu for helpful discussions. This work was sponsored by the National Institutes of Health under Grants DP1 EB016986 (NIH Director’s Pioneer Award), R01 CA186567 (NIH Director’s Transformative Research Award), and R01 CA159959. Competing financial interests: L.V.W. has financial interests in Microphotoacoustics, Inc. and Endra, Inc., neither of which supported this work. ReferencesA. Birbrair et al.,
“Type-2 pericytes participate in normal and tumoral angiogenesis,”
Am. J. Physiol.: Cell Physiol., 307
(1), C25
–C38
(2014). http://dx.doi.org/10.1152/ajpcell.00084.2014 Google Scholar
A. R. Pries et al.,
“The shunt problem: control of functional shunting in normal and tumour vasculature,”
Nat. Rev. Cancer, 10 587
(2010). http://dx.doi.org/10.1038/nrc2895 Google Scholar
R. K. Jain,
“Normalization of tumor vasculature: an emerging concept in antiangiogenic therapy,”
Science, 307
(5706), 58
(2005). http://dx.doi.org/10.1126/science.1104819 SCIEAS 0036-8075 Google Scholar
R. K. Jain,
“Lessons from multidisciplinary translational trials on anti-angiogenic therapy of cancer,”
Nat. Rev. Cancer, 8 309
(2008). http://dx.doi.org/10.1038/nrc2346 Google Scholar
R. H. Wheeler et al.,
“Tumor blood flow and systemic shunting in patients receiving intraarterial chemotherapy for head and neck cancer,”
Cancer Res., 46
(8), 4200
(1986). CNREA8 0008-5472 Google Scholar
C. Ince,
“The microcirculation is the motor of sepsis,”
Crit. Care, 9
(4), S13
(2005). http://dx.doi.org/10.1186/cc3753 Google Scholar
M. Lauterbach et al.,
“Shunting of the microcirculation after mesenteric ischemia and reperfusion is a function of ischemia time and increases mortality,”
Microcirculation, 13
(5), 411
(2006). http://dx.doi.org/10.1080/10739680600746032 MCCRD8 0275-4177 Google Scholar
L. An, J. Qin and R. K. Wang,
“Ultrahigh sensitive optical microangiography for in vivo imaging of microcirculations within human skin tissue beds,”
Opt. Express, 18
(8), 8220
(2010). http://dx.doi.org/10.1364/OE.18.008220 OPEXFF 1094-4087 Google Scholar
A. Y. Shih et al.,
“Two-photon microscopy as a tool to study blood flow and neurovascular coupling in the rodent brain,”
J. Cereb. Blood Flow Metab., 32
(7), 1277
(2012). http://dx.doi.org/10.1038/jcbfm.2011.196 Google Scholar
R. L. de Saunders and M. A. Bell,
“X-ray microscopy and histochemistry of the human cerebral blood vessels,”
J. Neurosurg., 35
(2), 128
(1971). http://dx.doi.org/10.3171/jns.1971.35.2.0128 JONSAC 0022-3085 Google Scholar
S. Brem, R. Cotran and J. Folkman,
“Tumor angiogenesis: a quantitative method for histologic grading,”
J. Natl. Cancer Inst., 48 347
(1972). http://dx.doi.org/10.1093/jnci/48.2.347 JNCIEQ Google Scholar
L. V. Wang and S. Hu,
“Photoacoustic tomography: in vivo imaging from organelles to organs,”
Science, 335
(6075), 1458
(2012). http://dx.doi.org/10.1126/science.1216210 SCIEAS 0036-8075 Google Scholar
J. Liang et al.,
“Spatially Fourier-encoded photoacoustic microscopy using a digital micromirror device,”
Opt. Lett., 39
(3), 430
(2014). http://dx.doi.org/10.1364/OL.39.000430 OPLEDP 0146-9592 Google Scholar
J. Yao et al.,
“Label-free oxygen-metabolic photoacoustic microscopy in vivo,”
J. Biomed. Opt., 16
(7), 076003
(2011). http://dx.doi.org/10.1117/1.3594786 JBOPFO 1083-3668 Google Scholar
C. Yeh et al.,
“Photoacoustic microscopy of blood pulse wave,”
J. Biomed. Opt., 17
(7), 070504
(2012). http://dx.doi.org/10.1117/1.JBO.17.7.070504 JBOPFO 1083-3668 Google Scholar
Y. Zhou et al.,
“Calibration-free in vivo transverse blood flowmetry based on cross correlation of slow time profiles from photoacoustic microscopy,”
Opt. Lett., 38
(19), 3882
(2013). http://dx.doi.org/10.1364/OL.38.003882 OPLEDP 0146-9592 Google Scholar
B. Ning et al.,
“Simultaneous photoacoustic microscopy of microvascular anatomy, oxygen saturation, and blood flow,”
Opt. Lett., 40
(6), 910
(2015). http://dx.doi.org/10.1364/OL.40.000910 OPLEDP 0146-9592 Google Scholar
C. Yeh et al.,
“Optical-resolution photoacoustic microscopy of the metabolic rate of oxygen in a mouse renal tumor model,”
Proc. SPIE, 9323 93233H
(2015). http://dx.doi.org/10.1117/12.2082948 Google Scholar
C. Yeh et al.,
“Three-dimensional arbitrary trajectory scanning photoacoustic microscopy,”
J. Biophotonics, 8
(4), 303
(2014). http://dx.doi.org/10.1002/jbio.201400055 Google Scholar
E. L. Cussler, Diffusion: Mass Transfer in Fluid Systems, Cambridge University Press, Cambridge, United Kingdom
(2009). Google Scholar
D. E. Laughlin et al., Polycrystalline Metal and Magnetic Thin Films,
(1999). Google Scholar
R. N. Pittman, Colloquium Series on Integrated Systems Physiology: From Molecule to Function, 3 1
–100 Morgan & Claypool Life Sciences, San Rafael, California
(2011). Google Scholar
P. F. Green, Kinetics, Transport, and Structure in Hard and Soft Materials, CRC Press, Boca Raton, Florida
(2005). Google Scholar
L. R. Adams and I. Fatt,
“The diffusion coefficient of human hemoglobin at high concentrations,”
Respir. Physiol., 2
(3), 293
(1967). http://dx.doi.org/10.1016/0034-5687(67)90034-5 RSPYAK 0034-5687 Google Scholar
P. Hai et al.,
“Near-infrared optical-resolution photoacoustic microscopy,”
Opt. Lett., 39
(17), 5192
(2014). http://dx.doi.org/10.1364/OL.39.005192 OPLEDP 0146-9592 Google Scholar
J. Xia et al.,
“Calibration-free quantification of absolute oxygen saturation based on the dynamics of photoacoustic signals,”
Opt. Lett., 38
(15), 2800
(2013). http://dx.doi.org/10.1364/OL.38.002800 OPLEDP 0146-9592 Google Scholar
|


