

|
|
1.IntroductionMany methods have been used to simultaneously measure blood flow and blood oxygenation changes. Dual-wavelength laser speckle contrast imaging (DW-LSCI) has shown to provide superficial blood oxygenation and flow changes, including using an optical chopper and a transistor-transistor logic modulated camera to monitor cerebral ischemia,1 and a color camera to obtain blood oxygenation information.2 Synchronized DW-LSCI was introduced with two coregistered, synchronized cameras to achieve faster acquisition rate, and has been applied to monitor blood flow and oxygenation changes in a stroke mouse model3 and a nerve-stimulation rat model.4 In order to acquire deep tissue blood flow and oxygenation measurements, combined diffuse correlation spectroscopy (DCS) and near-infrared spectroscopy (NIRS) systems have been used. Combined DCS–NIRS systems were used to monitor the cerebral hemodynamics of neonates with congenital heart defects,5 stroke patients,6 and critically brain-injured adults.7 Contact and noncontact dual-wavelength DCS systems have also been validated8–10 and used in such applications as monitoring muscle hemodynamics during electrical stimulation,11 head and neck tumors during radiation therapy,12 cerebral ischemia,13 and muscle revascularization.14 However, DCS can be costly because it requires a correlator board to calculate the intensity autocorrelation function.9,15 Diffuse speckle contrast analysis (DSCA) allows for deep tissue blood flow measurements and utilizes a point-source illumination, like DCS, but with the pixel analysis of speckle contrast, like laser speckle contrast analysis (LASCA).16 DCS, LASCA, and DSCA are all based on the temporal autocorrelation function,17 but DSCA has advantages in its expansion into imaging and tomography due to its nature of multiple source and detector without much modifications.18,19 Spatial DSCA observes the speckle contrast (), defined as20,21 for diffused photons from a continuous wave (CW) source with a long temporal coherence length, where is the spatial standard deviation and represents the mean intensity. It has been demonstrated that is linearly proportional to blood flow measurements within the physiologically relevant flow range.16,20 The range of the linearity may be affected by such factors as the camera exposure time22 and the number of pixels covering one speckle.23Because DSCA uses near-infrared light to obtain deep tissue blood flow, CW NIRS measurements can be made with another laser source, to observe intensity fluctuations from two wavelengths. CW NIRS relates to optical density (OD), or the logarithmic ratio of baseline intensity and transient intensity values, to concentration changes of oxyhemoglobin (OHb) and deoxyhemoglobin (RHb) from two wavelengths24,25 where is the source–detector separation, DPF is the differential path length factor, is the extinction coefficient, and is equivalent to OD (transient)—OD (baseline).In this study, we propose an expansion of the DSCA system by modulating between two laser sources to acquire NIRS measurements. The mean intensity value of the speckle contrast calculation window was used as transient intensity value to calculate the NIRS data. The proposed DSCA–NIRS system requires just two different analysis methods of the speckle image to simultaneously observe deep tissue blood flow and blood oxygenation changes. 2.System DevelopmentFigure 1 shows the schematic of the combined DSCA–NIRS system. A optical switch (SW , Sercalo, Switzerland) was used to alternate between two CW laser sources (temporal coherence ) for 785 and 852 nm wavelengths (DL785-100-SO/DL852-100-SO, , CrystaLaser Technology). The optical switch was synchronized with the detecting CCD camera (CoolSNAP MYO CCD Camera, Photometrics) by trigger pulses generated by a data acquisition board (NI USB-6229 BNC, National Instruments). The operation of the CCD camera limited the optical switch operation to a temporal frequency of 2 Hz. The power emitted to the sample was approximately 8 mW for 785 nm and 10 mW for 852 nm. A fiber splitter ( PLC fiber splitter, Fiberpia, Republic of Korea) was used to reduce the source’s power for safe use and one fiber propagated light into the sample. All the fibers were multimode fibers with a core diameter of . The detecting CCD camera was fixed with a biconvex lens (LB-1811-B, , Thorlabs Inc.) to focus the image. A magnification of allowed for an imaging width of 26 mm from the sample surface. Fig. 1Schematic of combined DSCA–NIRS system that alternates between the wavelengths of 785 and 852 nm to produce changes in OD and speckle contrast. 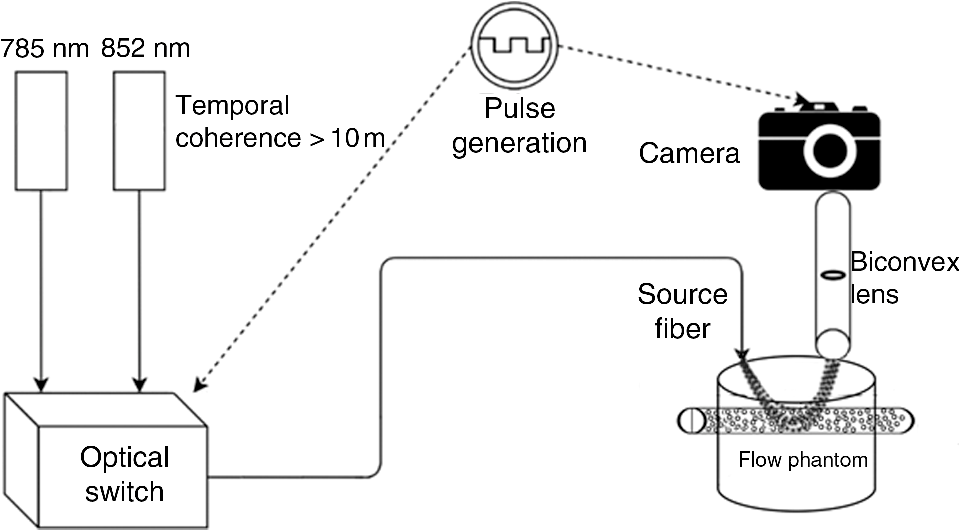 An in-house built LabVIEW Program (LabVIEW™ 2012, National Instruments) started the trigger signal to synchronize the optical switch and camera, acquire the image, and also controlled the exposure time, region of interest window, and gain. Speckle contrast and OD calculations were done in a MATLAB R2010b (MathWorks Inc., Natick, Massachusetts). The experiments were run with a 15-mm source–detector separation and processed with a window to increase the signal-to-noise ratio.26 3.Phantom PreparationA flow phantom (, for 650 nm) was constructed similar to previous reports.15,16,20 A silicone (Sylgard 184 silicone elastomer kit, Dow Corning) was mixed with India ink drops (Pro Art) and powder (Junsei Chemical Co., Japan) for the desired optical properties. A transparent tube with an inner diameter of was placed at a depth of 7.5 mm and filled with transparent beads to randomize the flow.15,16,20 A single syringe pump (Harvard Apparatus) flowed 0.06% diluted15,16,20 intravenous fat emulsion (Lipision 20%, JW Pharm., Republic of Korea) into the tube at flow rates from 0.02 to . Assuming that capillary velocity is approximately ,17 the phantom flow rates cover the physiologically relevant velocities. 4.ResultsFigure 2 shows the average value for the flow rates in increments of for 30 s. Exposure times of 0.5, 1, and 3 ms were tested to show the linear relationship between flow detection and camera exposure time.22 Figure 2 shows that the value response becomes more linear with a shorter exposure time. The inlet graph also indicates a difference in values for 3 ms exposure, within a closer range. These phantom flow results agree with LASCA findings,27 which show that the sensitivity is lost to faster flow rates with longer exposure time, but for slower flow rates, which are more relevant to the approximate physiological range,17 there is larger difference in values for all exposure times. Fig. 2Average values (with standard error) for various flow rates at the exposure of 0.5 ms (blue triangle), 1 ms (red circle), and 3 ms (black square) for flow phantom test. The inlet graph shows a closer view of 3 ms exposure phantom results. 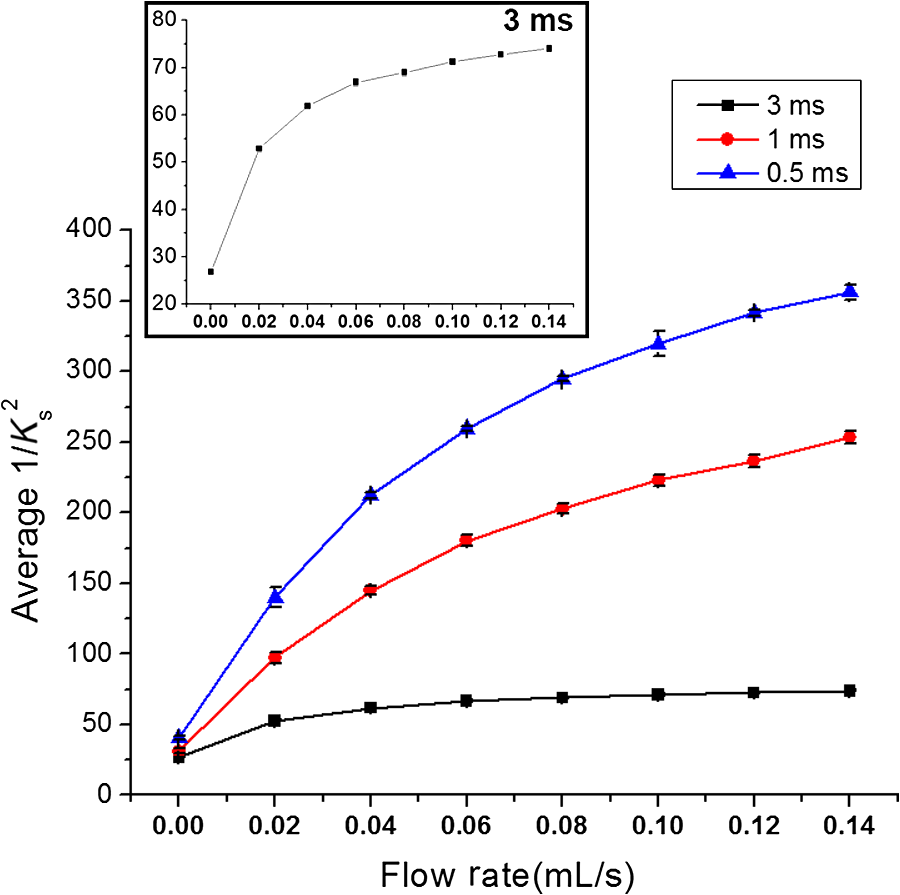 An arm occlusion protocol was also tested with the system, reviewed and approved by Gwangju Institute of Science and Technology’s Institutional Review Board (IRB 20140319-HR-10-01-02). The lens tube of the camera was placed on the forearm of the subjects and arterial occlusion was applied with an arm cuff inflated to 220 mm Hg of pressure on the bicep. Total hemoglobin (THb), as shown in Figs. 3Fig. 4–5, is the summation of OHb and RHb and is proportional to blood volume.28 The calculated values were filtered with a moving average (). Fig. 3Relative OHb (solid red line), RHb (dotted blue line), THb (thick green line) concentration changes (left column) and values (right column) for 785 nm (thick black line) and 852 nm (purple line) for arterial occlusion for in one subject at (a) 0.5 ms exposure and (b) 1 ms exposure.  Despite showing a more linear response at 0.5 ms exposure, we were unable to obtain consistent NIRS response at shorter exposure times (0.5 and 1 ms) for the arm occlusion protocol. Figure 3 shows an example of the issues—taken from one subject, for obtaining NIRS signal during arterial occlusion. This includes an underestimation of blood oxygenation changes at 0.5 ms and an unstable NIRS signal at 1 ms exposure time. However, the NIRS results were highly inconsistent between subjects and trials. There is an approximately 50% drop in values for 1-ms exposure and 66% drop at 0.5-ms exposure. Both 0.5- and 1-ms exposure times show a recovery of approximately 150% of baseline values. The drop and recovery are similar to spatial DSCA.16 In contrast, 3 ms exposure gave us consistent blood oxygenation changes from four subjects for NIRS and measured changes during arterial occlusion. Figure 4 shows the average arterial occlusion oxygenation and flow changes from four subjects (male, ages 24 to 25 years old). Since the speckle contrast values were different between subjects, the values were converted to percentage changes and then averaged to display. During arterial occlusion, we observed an approximate equivalent rise of RHb (maximum concentration change of ) and fall of OHb (minimum concentration change of ), which follow trends similar to other studies.29 For 3 ms exposure, the values dropped to an average of compared to baseline values, during the occlusion period, which is similar to that reported in temporal DSCA,20 and the average recovery of values after occlusion was , much less than the value from shorter exposure times. For one subject, venous occlusion was ran to observe blood oxygenation and blood flow for different occlusion types (Fig. 5). Venous occlusion was achieved with 50 mm Hg of pressure. In contrast to arterial occlusion, venous occlusion showed a rise of just OHb during occlusion, with a slight drop in blood flow.30 These results show the sensitivity of our system to differentiate between arterial and venous occlusion in terms of both blood oxygenation and blood flow measurements. Fig. 4(a) Relative OHb (solid red line), RHb (dotted blue line), THb (thick green line) concentration changes and (b) percentage change of values for 785 nm (thick black line) and 852 nm (purple line) averaged from four subjects at 3 ms exposure, with standard error included for each graph. The occlusion period is marked by a gray bar in each of the graphs.  Fig. 5Relative OHb (solid red line), RHb (dotted blue line), THb (thick green line) concentration changes (left axis) and values for 785 nm (thick black line) and 852 nm (purple line) (right axis) for venous occlusion for one subject at 3 ms exposure time. The occlusion period is marked by a gray bar.  Figures 3–5 report values from both wavelengths, 785 and 852 nm. There is not a large difference in measured values between the two wavelengths. This finding gives us a confidence that alternating wavelengths for NIRS calculations does not affect DSCA calculations. 5.Discussion and ConclusionThe proposed combined DSCA–NIRS system shows the capability to simultaneously measure qualitative blood flow and blood oxygenation by modulating between two laser sources and performing DSCA and NIRS analysis on light intensity fluctuations. However, the system still has limitations like the underestimation of blood flow drop (approximately 20% decrease from baseline) during the arterial occlusion compared to DCS results (50% or more of blood flow drop).8,9,15,16 Therefore, the proposed combined DSCA–NIRS system may not suitable for quantitative measurements, yet is still applicable for investigating hemodynamic trends for physiological changes. The detector geometry (i.e., in DCS theory16,20) and camera’s exposure time22 needs to be optimized in order to increase the sensitivity of the system. Sensitive blood flow response with shorter exposure times and consistent blood oxygenation response at longer exposure times may be an inherent tradeoff for a combined DSCA–NIRS system. Whereas NIRS calculations depend on adequate mean intensity at the detector, DSCA requires sufficient speckle contrast to improve the sensitivity to flow rates. One solution to this tradeoff may be a multiexposure technique as it has already shown to offer quantitative information of the blood flow change31 and may be more sensitive in its NIRS measurements. Moreover, the current system must be validated by the concurrent measurements with validated techniques such as DCS to investigate the underestimation of blood flow change during the occlusion protocol and phantom experiments.8,9,15,16,20 AcknowledgmentsThis work was partially supported by the Basic Science Research Program (NRF-2013R1A1A2013625 and NRF-2015R1D1A1A02062382) and Global Ph.D. Fellowship Program (NRF-2015H1A2A1032268) through the National Research Foundation of Korea (NRF) funded by the Ministry of Education, the Traditional Korean Medicine R&D Program funded by the Ministry of Health and Welfare through the Korea Health Industry Development Institute (HI15C0190), Institute of Medical System Engineering in the Gwangju Institute of Science and Technology (GIST), and Daegu Gyeongbuk Institute of Science and Technology (DGIST), Republic of Korea, under the Practical Research and Development support program supervised by GIST–DGIST, and the DGIST MIREBraiN Program (2015010026). ReferencesZ. Luo et al.,
“Simultaneous imaging of cortical hemodynamics and blood oxygenation change during cerebral ischemia using dual-wavelength laser speckle contrast imaging,”
Opt. Lett., 34
(9), 1480
–1482
(2009). http://dx.doi.org/10.1364/OL.34.001480 OPLEDP 0146-9592 Google Scholar
J. Wang et al.,
“Dual-wavelength laser speckle imaging to simultaneously access blood flow, blood volume, and oxygenation using a color CCD camera,”
Opt. Lett., 38
(18), 3690
–3692
(2013). http://dx.doi.org/10.1364/OL.38.003690 OPLEDP 0146-9592 Google Scholar
J. Qin et al.,
“Fast synchronized dual-wavelength laser speckle imaging system for monitoring hemodynamic changes in a stroke mouse model,”
Opt. Lett., 37
(19), 4005
–4007
(2012). http://dx.doi.org/10.1364/OL.37.004005 OPLEDP 0146-9592 Google Scholar
N. Yokoi et al.,
“Imaging of blood flow and blood concentration change in a frame rate using laser speckle: methods for image analysis,”
Opt. Laser Technol., 64 352
–362
(2014). http://dx.doi.org/10.1016/j.optlastec.2014.06.007 OLTCAS 0030-3992 Google Scholar
T. Durduran et al.,
“Optical measurement of cerebral hemodynamics and oxygen metabolism in neonates with congenital heart defects,”
J. Biomed. Opt., 15
(3), 037004
(2010). http://dx.doi.org/10.1117/1.3425884 JBOPFO 1083-3668 Google Scholar
T. Durduran et al.,
“Transcranial optical monitoring of cerebrovascular hemodynamics in acute stroke patients,”
Opt. Express, 17
(5), 3884
–3902
(2009). http://dx.doi.org/10.1364/OE.17.003884 OPEXFF 1094-4087 Google Scholar
M. N. Kim et al.,
“Noninvasive measurement of cerebral blood flow and blood oxygenation using near-infrared and diffuse correlation spectroscopies in critically brain-injured adults,”
Neurocrit. Care, 12
(2), 173
–180
(2010). http://dx.doi.org/10.1007/s12028-009-9305-x Google Scholar
T. Li et al.,
“Simultaneous measurement of deep tissue blood flow and oxygenation using noncontact diffuse correlation spectroscopy flow-oximeter,”
Sci. Rep., 3 1358
(2013). http://dx.doi.org/10.1038/srep01358 SRCEC3 2045-2322 Google Scholar
Y. Shang et al.,
“Portable optical tissue flow oximeter based on diffuse correlation spectroscopy,”
Opt. Lett., 34
(22), 3556
–3558
(2009). http://dx.doi.org/10.1364/OL.34.003556 OPLEDP 0146-9592 Google Scholar
L. He et al.,
“Using optical fibers with different modes to improve the signal-to-noise ratio of diffuse correlation spectroscopy flow-oximeter measurements,”
J. Biomed. Opt., 18
(3), 037001
(2013). http://dx.doi.org/10.1117/1.JBO.18.3.037001 JBOPFO 1083-3668 Google Scholar
Y. Shang et al.,
“Noninvasive evaluation of electrical stimulation impacts on muscle hemodynamics via integrating diffuse optical spectroscopies with muscle stimulator,”
J. Biomed. Opt., 18
(10), 105002
(2013). http://dx.doi.org/10.1117/1.JBO.18.10.105002 JBOPFO 1083-3668 Google Scholar
L. Dong et al.,
“Noninvasive diffuse optical monitoring of head and neck tumor blood flow and oxygenation during radiation delivery,”
Biomed. Opt. Express, 3
(2), 259
–272
(2012). http://dx.doi.org/10.1364/BOE.3.000259 BOEICL 2156-7085 Google Scholar
Y. Shang et al.,
“Diffuse optical monitoring of repeated cerebral ischemia in mice,”
Opt. Express, 19
(21), 20301
–20315
(2011). http://dx.doi.org/10.1364/OE.19.020301 OPEXFF 1094-4087 Google Scholar
G. Yu et al.,
“Intraoperative evaluation of revascularization effect on ischemic muscle hemodynamics using near-infrared diffuse optical spectroscopies,”
J. Biomed. Opt., 16
(2), 027004
(2011). http://dx.doi.org/10.1117/1.3533320 JBOPFO 1083-3668 Google Scholar
J. Dong et al.,
“Diffuse correlation spectroscopy with a fast Fourier transform-based software autocorrelator,”
J. Biomed. Opt., 17
(9), 097004
(2012). http://dx.doi.org/10.1117/1.JBO.17.9.097004 JBOPFO 1083-3668 Google Scholar
R. Bi, J. Dong and K. Lee,
“Deep tissue flowmetry based on diffuse speckle contrast analysis,”
Opt. Lett., 38
(9), 1401
–1403
(2013). http://dx.doi.org/10.1364/OL.38.001401 OPLEDP 0146-9592 Google Scholar
R. Bi et al.,
“Optical methods for blood perfusion measurement—theoretical comparison among four different modalities,”
J. Opt. Soc. Am., 32
(5), 860
(2015). http://dx.doi.org/10.1364/JOSAA.32.000860 JOSAAH 0030-3941 Google Scholar
C. Huang et al.,
“Speckle contrast diffuse correlation tomography of complex turbid medium flow,”
Med. Phys., 42
(7), 4000
–4006
(2015). http://dx.doi.org/10.1118/1.4922206 MPHYA6 0094-2405 Google Scholar
H. M. Varma et al.,
“Speckle contrast optical tomography: a new method for deep tissue three-dimensional tomography of blood flow,”
Biomed. Opt. Express, 5
(4), 1275
–1289
(2014). http://dx.doi.org/10.1364/BOE.5.001275 BOEICL 2156-7085 Google Scholar
R. Bi, J. Dong and K. Lee,
“Multi-channel deep tissue flowmetry based on temporal diffuse speckle contrast analysis,”
Opt. Express, 21
(19), 22854
–22861
(2013). http://dx.doi.org/10.1364/OE.21.022854 OPEXFF 1094-4087 Google Scholar
J. D. Briers, G. Richards and X. W. He,
“Capillary blood flow monitoring using laser speckle contrast analysis (LASCA),”
J. Biomed. Opt., 4
(1), 164
–175
(1999). http://dx.doi.org/10.1117/1.429903 JBOPFO 1083-3668 Google Scholar
B. Choi et al.,
“Linear response range characterization and in vivo application of laser speckle imaging of blood flow dynamics,”
J. Biomed. Opt., 11
(4), 041129
(2006). http://dx.doi.org/10.1117/1.2341196 JBOPFO 1083-3668 Google Scholar
J. C. Ramirez-San-Juan et al.,
“Effects of speckle/pixel size ratio on temporal and spatial speckle-contrast analysis of dynamic scattering systems: implications for measurements of blood-flow dynamics,”
Biomed. Opt. Express, 4
(10), 1883
–1889
(2013). http://dx.doi.org/10.1364/BOE.4.001883 BOEICL 2156-7085 Google Scholar
H. Liu et al.,
“Noninvasive investigation of blood oxygenation dynamics of tumors by near-infrared spectroscopy,”
Appl. Opt., 39
(28), 5231
–5243
(2000). http://dx.doi.org/10.1364/AO.39.005231 APOPAI 0003-6935 Google Scholar
J. G. Kim and H. Liu,
“Variation of haemoglobin extinction coefficients can cause errors in the determination of haemoglobin concentration measured by near-infrared spectroscopy,”
Phys. Med. Biol., 52
(20), 6295
–6322
(2007). http://dx.doi.org/10.1088/0031-9155/52/20/014 PHMBA7 0031-9155 Google Scholar
S. E. Skipetrov et al.,
“Noise in laser speckle correlation and imaging techniques,”
Opt. Express, 18
(14), 14519
–14534
(2010). http://dx.doi.org/10.1364/OE.18.014519 OPEXFF 1094-4087 Google Scholar
S. Yuan et al.,
“Determination of optimal exposure time for imaging of blood flow changes with laser speckle contrast imaging,”
Appl. Opt., 44
(10), 1823
–1830
(2005). http://dx.doi.org/10.1364/AO.44.001823 APOPAI 0003-6935 Google Scholar
M. Suh et al.,
“Blood volume and hemoglobin oxygenation response following electrical stimulation of human cortex,”
NeuroImage, 31
(1), 66
–75
(2006). http://dx.doi.org/10.1016/j.neuroimage.2005.11.030 NEIMEF 1053-8119 Google Scholar
S. Nioka et al.,
“A novel method to measure regional muscle blood flow continuously using NIRS kinetics information,”
Dyn. Med., 5 5
(2006). http://dx.doi.org/10.1186/1476-5918-5-5 Google Scholar
C. W. Yoxall and A. M. Weindling,
“Measurement of venous oxyhaemoglobin saturation in the adult human forearm by near infrared spectroscopy with venous occlusion,”
Med. Biol. Eng. Comput., 35
(4), 331
–336
(1997). http://dx.doi.org/10.1007/BF02534086 MBECDY 0140-0118 Google Scholar
J. Liu et al.,
“Quantitatively assessing flow velocity by the slope of the inverse square of the contrast values versus camera exposure time,”
Opt. Express, 22
(16), 19327
–19336
(2014). http://dx.doi.org/10.1364/OE.22.019327 OPEXFF 1094-4087 Google Scholar
|


