
|
|
1.IntroductionElastic light scattering is ubiquitous in an almost unlimited number of both animate and inanimate media, and therefore strongly influences our visual perception of most objects. The common feature for all of these media is the presence of internal refractive index variations, which give rise to light diffraction that is macroscopically denoted as light scattering. A very important example of turbid media is human tissue. Thus, there is a potential biomedical benefit to the study of light scattering in tissue. By looking closely at light backscattering from tissue, it is possible to study its microstructure which is encoded in the subdiffusive scattering intensities. Our study aims at simplifying the decoding of these subdiffusive backscattering intensities. The propagation of light in turbid, i.e., elastically scattering, media can be envisioned by a narrow beam of nonpolarized light vertically incident on the flat surface of a scattering medium with isotropic light propagation. In such a medium, the scattering coefficient is direction independent unlike for fibrous media. The envisioned beam of light will give rise to a spatially resolved reflectance (SRR) signal with radial symmetry and an intensity decline with increasing source detector separation (SDS) . The slope of the decline as well as the overall backscattering intensities are dependent on the macroscopic scattering and absorption properties. See Fig. 1(a) for a large number of such SRR curves. Fig. 1Analytical forward calculations of (a) SRR and (b) SFDR for 1000 different scattering phase functions (see Table 1). The model calculations assume (a) a vertically incident Gaussian beam or (b) a spatially modulated projection, and a numerical detection aperture of one (see insets). The color for each of the 1000 curves relates to the value of the underlying phase function. The parameter will be introduced in Sec. 3. The vertical dashed lines indicate and values further considered in Figs. 2, 3, and 6.  On average, the further away photons are detected from the incident beam, the deeper they have penetrated into the turbid medium. In consequence, backscattering (i.e., reflectance) intensities directly adjacent to a narrow beam of incident light correspond on average to the most shallow penetration depth. These proximal reflectance intensities consist of both, deeply penetrating light with a large number of scattering interactions and shallow photons with superficial propagation paths. We denote the former contribution as diffusive background. Shallow photons which undergo a smaller number of scattering interactions will be referred to as subdiffusive light. It is the ambition of this work to enhance both the understanding and the accurate quantification of this subdiffusive light. In particular, we are interested in how subdiffusive reflectance intensities relate to the nature of single scattering events and thus to the scattering phase function of scattering particles. The latter quantifies the probability distribution for light to be redirected into different scattering angles in each scattering interaction. To most accurately predict subdiffusive light propagation in turbid media, Maxwell’s equations need to be solved requiring the precise microscopic and complex-valued refractive index distribution inside the media.1 In most cases, like for biological tissue, this very detailed information is not available nor is it possible to computationally solve Maxwell’s equations for sections in the range of a cubic millimeter in a timely manner. Fortunately, the accuracy related to the solution of Maxwell’s equations is often not required for larger-sized turbid media, especially when near-field effects and dependent scattering of neighboring scattering particles are negligibly small. In this study, we make use of the radiative transfer model1 that states an advanced yet empirical and well-approved approximation to Maxwell’s theory. It treats light propagation in scattering media as a succession of independent and localized scattering and absorption events, rather than as the propagation of electromagnetic waves in a medium with continuous and complex refractive index variations. In order to solve the radiative transfer equation (RTE), a scattering phase function specifying single scattering events is required. For some scattering particles like spheres, ellipsoids or cylinders, this scattering phase function may be computed analytically using Mie theory or similar solutions to Maxwell’s theory. In most practical cases, scattering particles have a rather complex and mostly irregular shape with only roughly known refractive index distributions. This is especially true for cellular scattering in tissue, where each cell and cellular organelle varies in size and structure and would give rise to a different scattering phase function. This problem can be dealt with by averaging over an ensemble of single scatterers through numerical simulations or by goniometric phase function experiments on highly diluted scatterers. Subdiffusive light is ultimately affected by the nature of single scattering events based on the small number of scattering interactions. Therefore, experimental quantification of subdiffusive reflectance offers the great opportunity to derive meaningful microstructural properties of a turbid medium. This is in contrast to the diffusive background and reflectance at larger SDSs which are both only weakly influenced by the scattering phase function. The benefit of experimentally quantifying subdiffusive light relies on the availability of a disambiguate correspondence between the nature of single scattering and subdiffusive light intensities. Such a correspondence allows meaningful conclusions about a media’s microstructure based on its subdiffusive light intensities. Bevilacqua and Depeursinge2 have reported on the scattering phase function parameter as a quantifier for subdiffusive reflectance. This parameter employs and constituting the first and second Legendre moment of the scattering phase function, respectively. Since its introduction, the parameter was adopted in a great number of experimental and theoretical studies.3–11 The number of reports does not only prove the usefulness of the parameter, but also the general interest and attributed benefit toward quantification of subdiffusive backscattering. In two recent studies, we have focused on subdiffusive light in the spatial frequency regime.10,11 In these studies, we demonstrated the obtainable microstructural contrast through quantification of 11 and revealed major ambiguities related to .10 We have reported that false or imprecise assumptions on a model phase function can lead to considerable uncertainties in the derived -values.10 This states a major limitation to the significance of derived values as the actual scattering phase function of a turbid medium needs to be known for proper selection of a model phase function. In Sec. 2, we will review the current approach for quantification of subdiffusive backscattering. In this context, we will demonstrate the inability of the scattering asymmetry parameter to independently predict subdiffusive backscattering and review the uncertainties related to the established parameter . In Sec. 3, we will build upon making use of higher-order similarity relations and introduce a new subdiffusive quantifier. In doing so, we overcome some of the uncertainties related to and demonstrate the accuracy of the new quantifier in Sec. 4. We finally conclude on the benefits and consequences of our work for the experimental study of subdiffusive backscattering in Sec. 5. 2.Asymmetry and Phase Function ParameterWe start our analysis on subdiffusive backscattering by presenting a large number of analytical forward calculations. Figure 1(a) exemplifies SRR computed for a large number of scattering phase functions assuming a Gaussian beam of light with FWHM of vertically incident on an ideally flat, semi-infinite and homogeneously scattering medium. The curves illustrate the backscattering intensity integrated over the entire detection half-sphere versus SDS from the point of incidence [see inset of Fig. 1(a)]. For all forward computations, the assumed reduced scattering intensity is and the absorption value was set to with mean refractive indices and inside and outside of the turbid medium, respectively. The large number of curves in Fig. 1(a) makes individual curves indistinguishable. Different coloring of the curves however clearly reveals the large phase function influence both at very small, but also at intermediate SDSs. We find backscattering intensities at the point of incidence () to vary by more than a factor of ten, and even at intensities are found to differ by up to 10% (not shown). At a SDS of , we observe a local minimum of the phase function influence on SRR which has previously been reported by Calabro and Bigio.12 For Fig. 1(a), 1000 different phase functions were successively assumed and the details of the selected phase functions are stated in Table 1. The emphasis of the phase function selection lies at modeling of biological tissue while we deliberately added more diversity through Mie functions with high-refractive index mismatch and other more exotic phase function models. The same phase function selection presented in Table 1 will be used throughout this study. Please note that some of the outer refractive index values in the Mie function models are meant to roughly match that of water and do not equal the assumed mean refractive index value of the medium of . Table 1Employed phase functions and corresponding parameter ranges for RTE-based analytical forward calculations presented throughout our study.
Similar to Fig. 1(a), Fig. 1(b) depicts the phase function influence on reflectance intensities in the spatial frequency domain for the same phase function range. The point source is in this case replaced by a spatially extended and laterally structured sinusoidal projection pattern [see inset of Fig. 1(b)].15 The plotted spatial frequency domain reflectance (SFDR) in Fig. 1(b) is a direct measure of the unitless amplitude retention in the backscattering signal. The advantage of SFDR over SRR is the ability to limit the light propagation depth through selection of a spatial frequency. High-spatial frequencies are more surface sensitive and thus the relative influence of scattering phase functions on SFDR can be observed to increase with spatial frequency [see Fig. 1(b)]. Our forward calculations are based on analytical solutions to the RTE derived by Liemert and Kienle.16,17 These models assume semi-infinite and homogeneously scattering media with ideally flat surfaces neglecting roughness induced surface scattering or specular reflections. All analytical solutions are verified by Monte Carlo (MC) simulations and within noise limits provide identical yet much faster and noise-free computation of reflectance patterns. In consideration of computation time, the computation order for calculation of SRR and SFDR was set to and , respectively. The ambition in the search for subdiffusive quantifiers is a maximum reduction of the complexity of a scattering particle’s phase function without loosing the information that is relevant to subdiffusive light. We denote as a function of the polar angle omitting the dependence on the azimuthal angle . This states a frequent approximation that is especially valid for orientation randomized scatterers. For nonpolarized light scattering on homogeneous spheres, is independent of . Given the complexity of a real scattering phase function, it is impossible to exactly describe subdiffusive backscattering with only a single generalized parameter. However, a study by Turzhitsky et al.18 using principal component analysis could demonstrate accurate modeling of subdiffusive backscattering intensities for biologically relevant phase functions by very few principal components. Several analytical studies have derived equations for computation of effective scattering functions corresponding to the angular light distribution after two or more scattering interactions.19–22 These reports demonstrate not only the complexity in deriving such effective scattering functions, but give illustrative conclusions on how oscillatory features or strong forward peaks in get canceled through multiple scattering. While these analytical models help to calculate and predict subdiffusive light intensities,23 they do not hint at simple quantifiers for subdiffusive backscattering. The notion of phase function dependent light propagation through independent scattering interactions is based on the radiative transfer model. This model is often applied through the use of MC simulations. Analytical solutions to the RTE express the scattering phase function in terms of Legendre moments , with is the ’th order Legendre polynomial. Based on this Legendre moment decomposition, it seems natural to probe the significance of as quantifiers for subdiffusive backscattering. For an ’th order approximation to the RTE solution, such Legendre moments are required. Diffusion theory thus relates to a first order () approximation to the RTE and requires the Legendre moments and . While states the normalization constraint, is usually expressed in terms of the reduced scattering coefficient , with scattering coefficient . This has led to a widely spread belief, that the asymmetry parameter states a reasonable first order approximation to the phase function influence on backscattering.Even though has strong influence on the effective light scattering intensities in the diffusion regime through modification of the parameter , we find that it has almost no relevance as an independent subdiffusive parameter. Mourant et al.24 have already demonstrated through MC analysis that large differences in subdiffusive backscattering exist for Mie and Henyey-Greenstein phase functions with equal asymmetries . We seek to provide a more general conclusion on the relevance of as an independent parameter for subdiffusive backscattering. To this end we reuse the reflectance data presented in Fig. 1. Figures 2(a) and 2(b) depict both SRR and SFDR for all 1000 phase functions against their corresponding asymmetry values . SRR in Fig. 2(a) is given for the four SDSs and 3 mm and Fig. 2(b) provides reflectance intensities for four spatial frequency values with and (see dashed lines in Fig. 1). Every data point in Fig. 2 thus corresponds to reflectance at a certain radius (a) or frequency (b) for forward computations using one of the 1000 different scattering phase functions of Table 1. Fig. 2Analysis of subdiffusive reflectance intensities (a) for four different SDSs and (b) for four spatial frequencies versus the phase function asymmetry value . The data equal that of the forward calculations presented in Fig. 1. Every data point corresponds to a different phase function listed in Table 1. The observable patterns in each point cloud relate to the different phase function models and their parameterization. Small correlation is found in either graph with respect to . As a guide to the eye for noncolored print, data symbols in (b) for frequency are slightly enlarged.  Both SRR and SFDR data in Fig. 2 clearly demonstrate the inability of to quantify subdiffusive reflectance at any of the investigated SDSs (a) or spatial frequencies (b). This observation is based on the very weak correlation of each point cloud comprising 1000 data points with respect to the parameter . Indeed, different phase functions, which deviate in their values by more than 0.8, are shown to produce similar reflectance intensities. In spite of the demonstrated inability of to describe SRR and SFDR, it is worth mentioning that experimental quantification of has been shown to be possible in a backscattering geometry. Samatham and Jacques25,26 have demonstrated sensitivity toward the asymmetry parameter using a reflectance mode confocal microscopy setup. The -sensitivity of their system is achieved by the added depth control for detection owing to the confocality of their system. The phase function parameter was derived by use of similarity relations,2 which is a concept that has been introduced by van de Hulst27 and that was further developed by Wyman et al.28 thereafter. The similarity relations are constraints for two sets of optical parameters (i.e., two sets of , and ) to produce the identical radiance in an unbounded medium within the context of a computational order . In consequence, the exact solution (i.e., ) requires an infinite number of similarity relations to be fulfilled, essentially forcing the first and second set of parameters to be identical. This provides the important insight that every phase function gives rise to its unique light propagation. In first order approximation (), the two similarity relations are given by2 where the asterisk marks the second set of optical parameters. For higher computation orders () the additional similarity relations can be written as For , both sides of Eq. (4) correspond to the parameter . Thus two sets of optical properties with equal and values and equal parameter give rise to the same reflectance intensities for computational order . It has been shown by Kienle et al.29 that the use of as an additional fit parameter for SRR can considerably decrease the phase function related errors in the determination of and .Figure 3 plots our previously calculated SRR and SFDR data versus and demonstrates its general significance in describing subdiffusive backscattering. For the three larger values in Fig. 3(a) strong correlation of SRR with can be found. At , this correlation is strongly reduced. In the spatial frequency domain [Fig. 3(b)], we find the -reflectance point clouds to be much less correlated for all four spatial frequencies. However, a comparison of Figs. 2 and 3 clearly reveals the superiority of over in describing subdiffusive backscattering. Nevertheless, the strong dispersion of data points, especially in the spatial frequency domain [Fig. 3(b)], states a considerable drawback for the experimental quantification of subdiffusive reflectance. Fig. 3SRR for four different (a) SDSs and (b) SFDR for four spatial frequencies versus the phase function parameter . Both graphs rely on the data already presented in Figs. 1 and 2. Every data point corresponds to one of the phase functions listed in Table 1. shows decent correlation with (a) SRR for three out of the four presented values while large uncertainties exists in the quantification of (b) SFDR for all four frequencies.  3.Introducing the Subdiffusive QuantifierIn trying to more precisely describe subdiffusive backscattering, it appears as a natural step to make use of higher-order similarity relations. However, not only does a higher number of similarity parameters beyond [i.e., ] increase the overall complexity,30 but also do the added parameters carry little independent structural information. It is therefore our goal not to increase the number of subdiffusive parameters, but to combine all similarity parameters in a single yet less ambiguous quantifier to describe subdiffusive light propagation. We arrive at this goal by an empirical approach which builds upon the findings of Bevilacqua and Depeursinge and their established parameter . As a first step, it is instructive to study typical photon paths in the subdiffusive scattering regime. Figures 4(a)–4(c) each contain a two-dimensional projection of 20 photon paths for different light propagation constraints. In all three graphs, the given photon paths correspond to MC simulations in a semi-infinite scattering medium (, , and ). The simulation imitates tissue scattering by assuming a scattering phase function that corresponds to a fractal distribution of Mie scatterers with fractal dimension (asymmetry ). Light is obliquely incident from air in the –-plane at an angle of 15 deg with photons entering the turbid media at , as indicated by the arrows in Figs. 4(a)–4(c). To mimic typical experimental detection geometries, we show only photon trajectories that exit the medium within an aperture angle of 10 deg at a SDS smaller than a set radius . Fig. 4MC analysis of both subdiffusive and diffusive light propagation. The three columns in the upper part of the figure relate to MC simulations with different constraints for the detection radius and the allowed penetration depth . (a)–(c) 20 photon paths for each simulation exemplify the nature of each scattering regime. (d)–(f) Statistical evaluation of all scattering interactions of detected photons reveals (d)–(e) a strong bias toward high-angle scattering as compared to the expected angular scattering distribution. This bias is almost canceled in the diffusion regime [(c) and (f)]. (g) All simulated light propagation and detection constraints give rise to a more or less pronounced sensitivity toward subdiffusive and diffusive light. 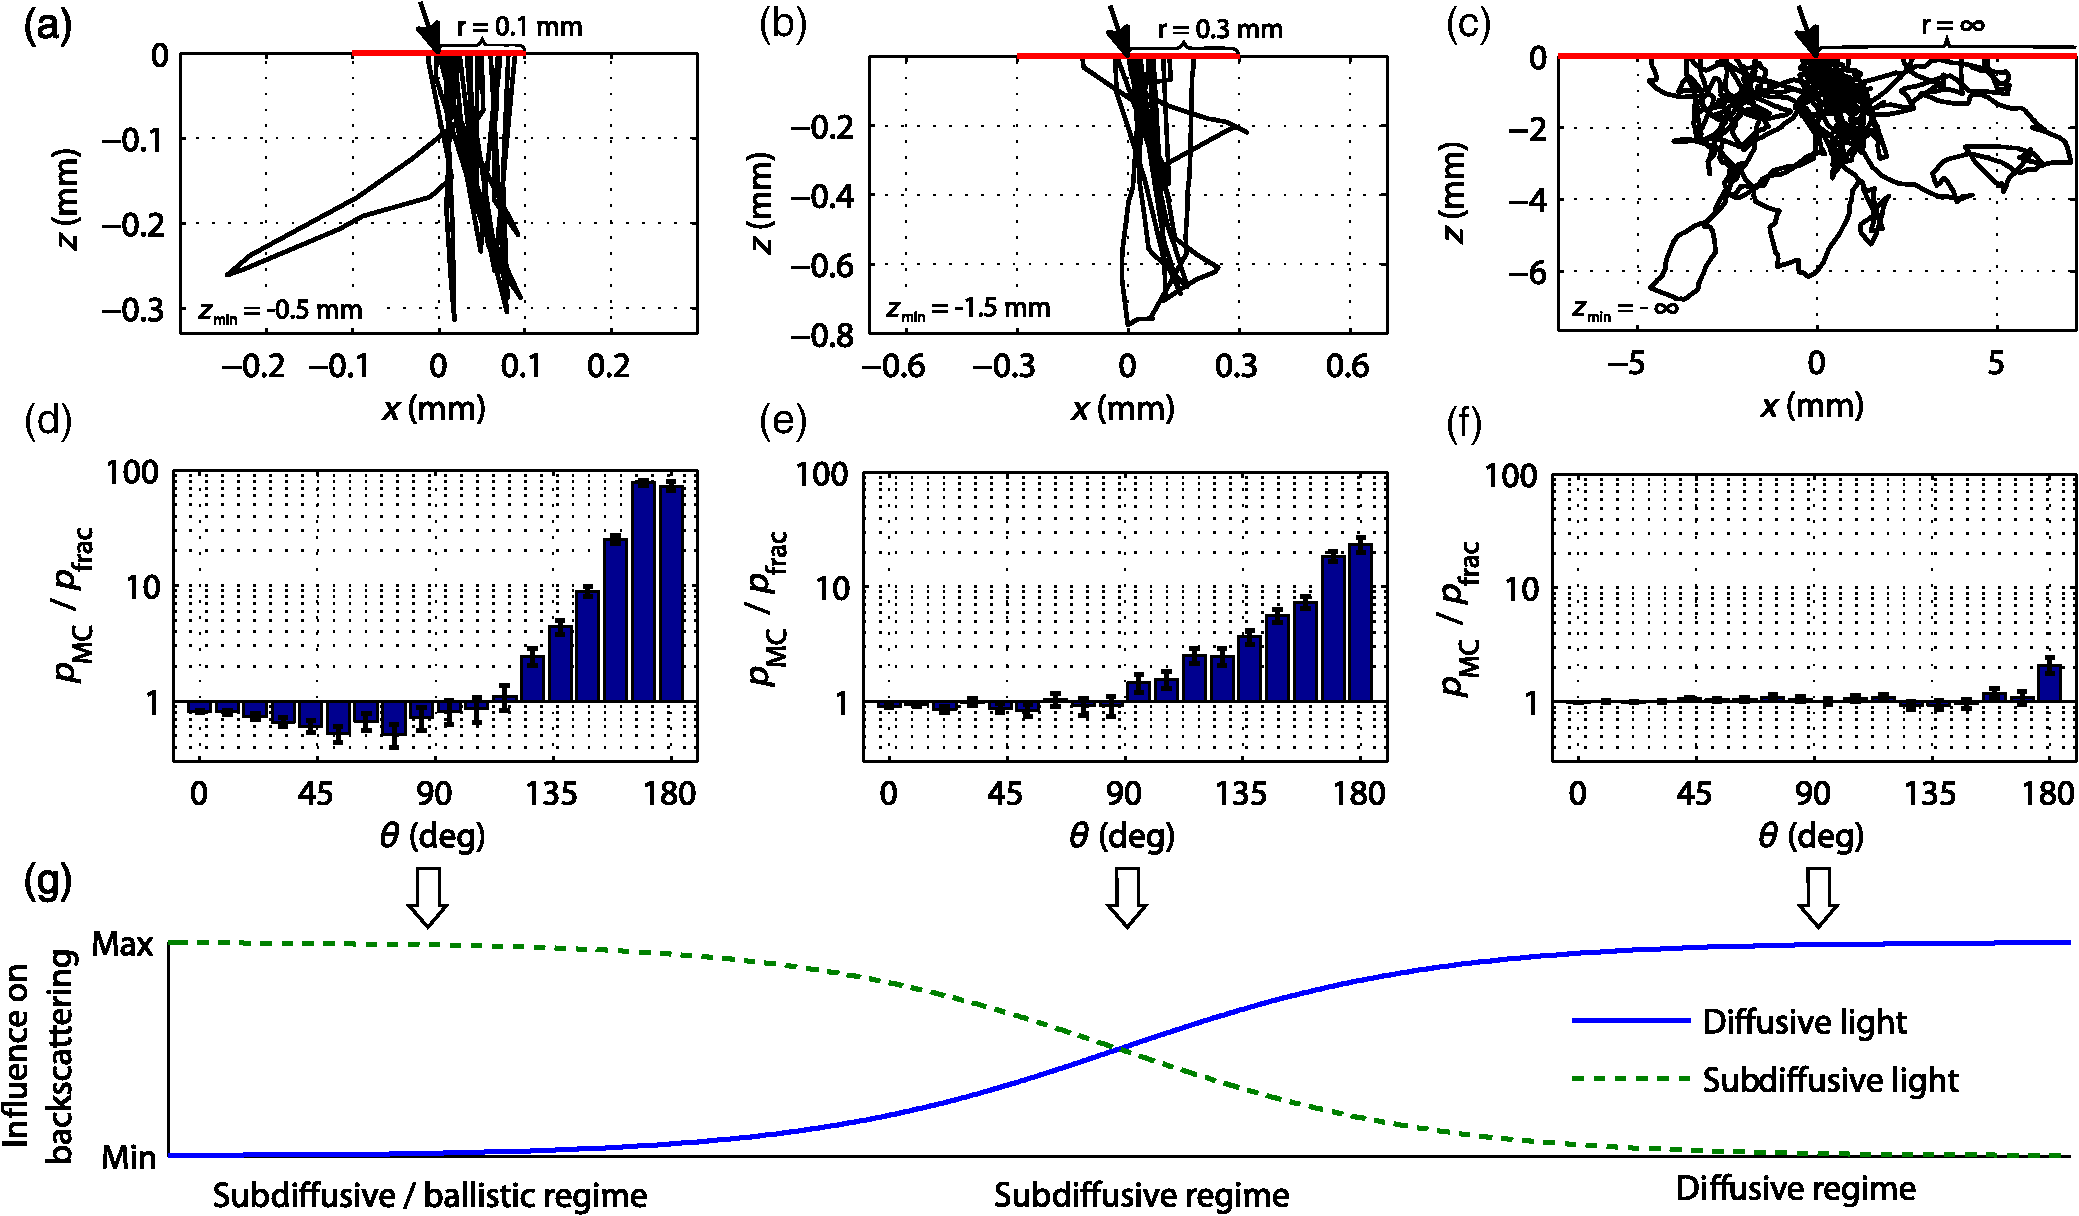 To specifically select photons corresponding to different scattering regimes, the detection radius as well as the allowed photon penetration depth differs among the three sets of photon paths. In Fig. 4(a), with depth constraint . In Fig. 4(b), photons are detected within and are allowed to travel to a depth of . Both dimensional constraints are lifted for the simulation corresponding to Fig. 4(c). Please note the different axes scaling of Figs. 4(a)–4(c). The three different MC simulations where designed to correspond to light propagation with a minimum (a), an intermediate (b), and a maximum (c) share of diffusive light content. By diffusive light we refer to the unbiased and randomized photon paths whose scattering angles statistically reflect the probability distribution of the scattering phase function. Correspondingly, the distinct feature of subdiffusive light lies in the directional bias of its photon paths. This bias can be well studied in Figs. 4(a) and 4(b) which contain photon trajectories with mostly forward and large angle backward scattering. As the diffusive influence increases [Figs. 4(b) and 4(c)], there is an increasing number of paths featuring also intermediate scattering angles. In Figs. 4(d)–4(f), we do a statistical analysis to confirm the visually perceived angular scattering bias. In this analysis we evaluate all scattering angles of detected photons for all three MC simulations. Figures 4(d) and 4(e) relate to the first two simulations and 4000 scattering interactions where evaluated each, corresponding to 970 and 395 detected photons, respectively. For Fig. 4(f), only 200 photon paths where evaluated corresponding to 46,250 scattering interactions in the unconstrained third simulation. In all three graphs, we display the ratio given by the number of encountered scattering angles for one of 20 angular bins divided by the expected occurrence of scattering events for each bin. corresponds to the angular scattering probability of the assumed fractal phase function scaled by the number of detected photons. The statistics in Fig. 4(d) clearly reveal over-proportional scattering at high-scattering angles for the most constrained MC simulation. Indeed, high-angle backscattering is found to occur one hundred times more frequent than statistically expected from the scattering phase function. At the same time, intermediate scattering angles are under-represented due to the unlikeliness for photons to reach the detector within the boundary constraints after more randomized scattering interactions. This directional bias is considerably decreased for the second simulation [Fig. 4(e)] due to a slightly stronger influence of more directionally randomized photon paths. In the last simulation with neither lateral detection nor axial propagation constraint, the angular scattering bias is almost completely lost [Fig. 4(f)]. The incidence and detection geometry nevertheless sustain a small bias toward very high-angle scattering by allowing subdiffusive light to still be part of the detection signal. Figure 4(g) sketches the relationship of the three MC simulations, indicating the difficulty to clearly distinguish between the diffusive and subdiffusive regime due to the smooth transition of the relative weight of biased and unbiased photon paths. Further MC analysis beyond that shown in Fig. 4 reveals that the studied angular scattering bias has some dependency on the source–detection geometry and is very sensitive to the implemented depth constraints. These constraints might seem as a random limitation but actually reflect the sampling characteristics in spatial frequency domain imaging. Deeply penetrating light is prevented from contributing to high-spatial frequency reflectance through a demodulation approach.15 Similar to Figs. 4(d)–4(f), we also observe a qualitatively comparable angular scattering bias for different scattering phase functions. However, we find the intensity of the angular scattering bias to scale with the phase function asymmetry . As a conclusion from this MC analysis, it seems reasonable that accurate quantification of subdiffusive backscattering should somehow account for the demonstrated high weight of scattering at large angles. We seek to use higher order Legendre moments for quantification of subdiffusive light. In this regard one needs to be aware of the change in sign of the Legendre polynomials at angles close to for subsequent orders (see inset of Fig. 5 for illustrations of , , and with positive function values represented by solid blue and negative values by dashed red curves). Correspondingly, we find through a large number of forward calculations using different scattering phase functions and different computational orders that the effect of subsequent similarity parameters (i.e., ) on backscattering is also inverted. Furthermore, increasingly high-Legendre moments correspond to the high-frequency oscillations of scattering phase functions and thus have a diminishing impact on the overall subdiffusive backscattering intensities. Fig. 5Angular weight curves for the expression defined in Eq. 5 for different values . The solid blue curve () corresponds to the angular weight assigned to and the solid black curve () to that of the newly defined subdiffusive quantifier . The inset depicts the Legendre polynomials , , and with their change in sign for angles close to 180 deg (solid blue curves for positive, and dashed red curves for negative function values). 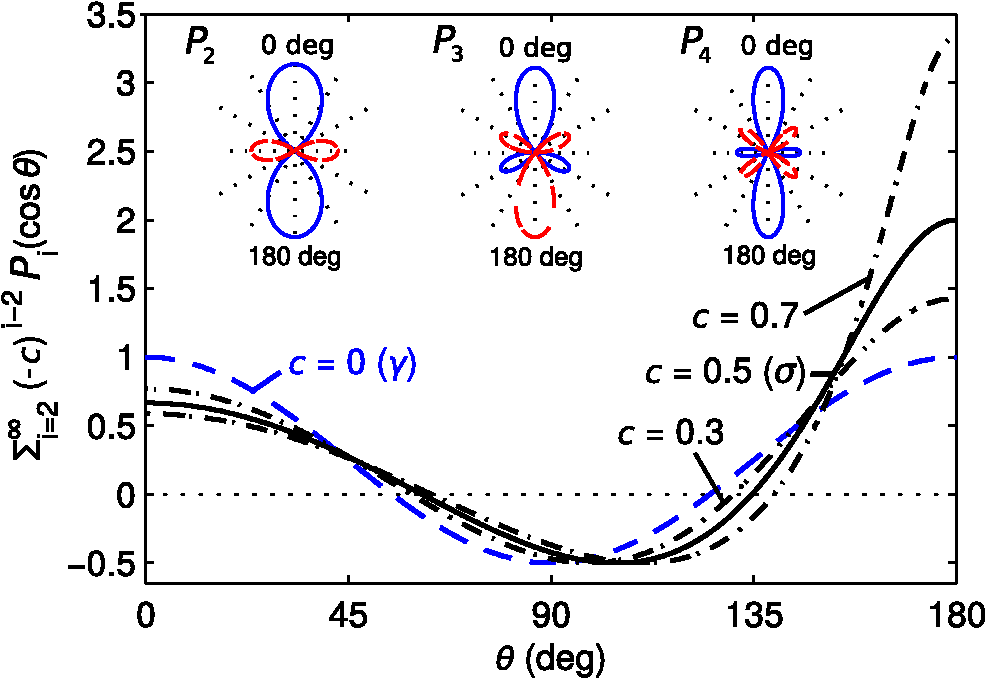 Based on these observations we propose the following formula to quantify subdiffusive backscattering The positive number with determines the decreasing weight of higher order similarity relations beyond .In order to understand the physical relevance of this empirical equation and to demonstrate its suitability, Eq. (5) can be rewritten as We are particularly interested in the quantity marked as “angular weight” in Eq. (7). This quantity provides some insight on the relative weight of the entire expression toward the different phase function angles. We seek to compare the angular weight of the presented formula with our previous statistical analysis on angular scattering bias. Figure 5 displays the formula’s weight for different constants . The blue colored dashed curve for corresponds to the angular weight of displaying equal emphasis on the forward and backward scattering direction. This does not quite correspond to the angular weights obtained through our statistical analysis in Fig. 4. However, as is increased, the backscattering direction progressively gains in angular weight. For , we compare the angular weight curves in Fig. 5 with the statistically found angular weight histograms in Figs. 4(d) and 4(e). Accordingly, the observed high-angular weight of large angle scattering is reflected by Eq. (7) which also attributes less weight to intermediate scattering angles as desired. For absolute comparison, the scaling factor and the offset of Eq. (7) have to be considered as well. While scales the overall weight intensities, reduces the weight at all angles and may thus reduce the displayed relative weight of forward scattering depending on the actual phase function. Consequently, by using Eq. (5) with one may establish a rather good correspondence with the actual angular weights found for subdiffusive light. Moreover, the formula’s built-in scaling property of the asymmetry value reflects the previous finding of our MC analysis. We have tested the significance of Eq. (5) on a large number of analytical16,17 forward calculations for different scattering phase functions and various source–detector geometries. Resulting from these calculations, we find on average best quantification of subdiffusive backscattering for and thus introduce the parameter with Based on the distinct angular weights attributed to a scattering phase function, this new parameter exceeds the precision of and thus more uniquely quantifies subdiffusive light propagation. In Sec. 4, we put to an extensive test and demonstrate the gain in accuracy over the established parameter .4.Verification and Accuracy ofAs a first step to demonstrate the significance of , we make use of the calculated SRR and SFDR data of Sec. 2 which was previously presented with respect to and in Figs. 2 and 3, respectively. The same data is now displayed versus in Fig. 6 showing both SRR (a) and SFDR (b). By comparing the dispersion of the 1000 data points for all four SDSs in Fig. 6(a) to those in Fig. 3(a), we observe that describes SRR intensities more uniquely for three out of the four displayed SDSs. At , SRR is well described by both and , yet data points are slightly more widespread in the graph versus . A noticeable gain in accuracy using is especially found for , but also for and . Fig. 6Analytical forward calculations of (a) SRR for four different SDSs and (b) SFDR for four spatial frequencies . The shown reflectance data is equal to that presented in Figs. 1–3 but is plotted against the new subdiffusive parameter this time. Every data point corresponds to a different scattering phase function. is observed to have a stronger correlation with subdiffusive SRR and SFDR than when compared to Fig. 3.  Improvements in quantifying subdiffusive backscattering are most evident in the spatial frequency domain [compare Figs. 3(b) and 6(b)]. For all four displayed spatial frequencies states a much more unambiguous quantifier than . In order to add some quantitation to the predictive ability of , , and , a fifth degree polynomial was fitted to all SRR and SFDR point clouds in Figs. 2, 3, and 6 (not shown). We then calculated the root mean square deviation (RMSD) for each subdiffusive quantifier with respect to this polynomial. A relative overall error metric is obtained for the spatial domain and spatial frequency domain by, respectively, averaging the RMSDs over the four SDSs or four frequencies and division by the parameter ranges in , or . Table 2 summarizes these averaged relative errors , , and . Accordingly, relative RMSDs in are found to be 1.5 and 3.5 times as large as that of for the spatial domain and spatial frequency domain, respectively. This error metric should, however, be considered solely as a rough indicator which is largely dependent on the phase function selection and the assumed source and detection geometry. Table 2Relative error metrics for g1, γ, and σ as averaged over the data of Figs. 2, 3, and 6.
To also demonstrate the significance of beyond both the four SDSs and the four frequency values analyzed in Fig. 6, all SRR and SFDR curves in Fig. 1 of the original data were colored according to their corresponding value (with darker curves corresponding to lower values). The perpendicular illumination and high-aperture detection assumed for the presented data in Fig. 6 have some similarity with the constraints found in reflected-light microscopy yet they do not represent typical diffuse optical imaging constraints. Oblique projection of light is a typical feature of experimental approaches toward SRR or SFDR. Detection is often camera based featuring a limited and mostly small detection aperture. In order to verify and thereby establish as a meaningful parameter relevant also to experimental geometries, we performed extensive forward calculations of subdiffusive reflectance for four different geometries of the source, the detection and the sample. The following computations were performed for SFDR, owing to the much higher-computation speed of analytical solutions in the spatial frequency domain. This allows to perform computations at a higher-computation order for better verification of . High-computation orders are especially required for narrow detection apertures and high-spatial frequencies where oscillatory phase function features start to have a meaningful influence on reflectance intensities. In our forward calculations we again set the macroscopic optical properties to and . The selected absorption value has little significance due to the in most cases negligible influence of absorption on subdiffusive light propagation.10 Through scaling of spatial frequencies, the computational results hold true also for higher or lower reduced scattering values and thus give a generally meaningful analysis for the subdiffusive regime. This is similarly true for the previously presented SRR data, where proper scaling of both and SRR corresponds to scaled values of and . In the following computations we consider the four spatial frequencies and for all phase functions listed in Table 1, as before. Figures 7(a), 7(d), 7(g), and 7(j) sketch the modeled geometries of source, detection and the sample. In the first forward modeling (first row of Fig. 7) we assume oblique incidence at an angle of 30 deg and a detection aperture of 0.34 [see Fig. 7(a)]. The second geometry has oblique incidence at 20 deg and a smaller aperture of 0.17 [Fig. 7(d)]. In the third row of Fig. 7 we assume a two-layer geometry where the scattering layer is only thick resting on a highly absorbing bottom layer with and . This geometry restricts light propagation to within the depth of leading to an almost pure ballistic (i.e., strongly subdiffusive) reflectance content. For this geometry, projection is at 20 deg and the detection aperture is set to 1 [Fig. 7(g)]. Finally, Fig. 7(j) shows the last forward modeling which assumes the same source–detection and sample geometry as in Fig. 7(g) with the bottom layer optical properties set to and . Fig. 7Results of RTE-based analytical forward calculations of SFDR to demonstrate the accuracy of the phase function parameter . The sketches in the left column depict the assumed geometries for source, detection and sample for the four different sets of forward calculations. For each model geometry, two plots are given in the central and right column showing the computed reflectance values with respect to and , respectively. Every data point corresponds to the forward calculation using one of the phase functions stated in Table 1 for one out of four spatial frequencies ( and ).  The second and third column of Fig. 7 display the computed reflectance values for all model geometries plotted versus and versus , respectively. Every data point again corresponds to a single forward calculation using one of the scattering phase functions listed in Table 1. The four point clouds in each graph thus correspond to the four different spatial frequencies. We always find the computed reflectance values in Fig. 7 to be more scattered when plotted versus (second column) as compared to the corresponding plots (third column). This is confirmed by the relative error and presented in and averaged over each graph. Thus, for all four model geometries states a more unambiguous parameter and shows stronger correlation with subdiffusive reflectance intensities. With decreasing detection aperture and increasing spatial frequency the uncertainties related to both parameters are shown to increase. This is caused by the increased sensitivity toward small angular phase function features such as Mie resonances. Indeed, the most deviating points in the data graphs of Fig. 7 correspond to scattering functions with a rather distinct or oscillatory peak in backward direction. Such phase function behavior is unlikely to be found for biological tissue but observable for single Mie scatterers or “modified powers of cosines”2 phase functions. The third model geometry corresponds to the reflectance from a very thin slice of turbid medium and reveals an almost linear relationship of reflectance intensities versus . The small layer thickness states an even stronger constraint to the light propagation depth than the selected spatial frequencies and thus reflectance intensities are almost identical for all frequency values. We therefore show SFDR for only a single spatial frequency () in Figs. 7(h) and 7(i) representative for all four frequency values. The rather unnatural bottom layer optical properties in the layered forward models [Fig. 7(g) and 7(j)] are meant to demonstrate general applicability of for layered sample geometries with unmatched optical properties. All source geometries in Fig. 7 feature oblique projection of spatial frequencies which induces phase shifts in the reflectance pattern. In spite of not illustrating these phase shifts we included them in our computational analysis. Similar to the depicted reflectance amplitudes, we observe that relates to a much more unambiguous description of the phase than for all studied geometries and frequencies. The correctness of the presented analytical data is ensured by numerous verifications using MC simulations with phase function look-up tables. In addition, we ensure numerical stability of all data points by repeated forward computations at different computational orders. 5.ConclusionWe demonstrated that the use of the asymmetry parameter as an independent subdiffusive quantifier is inappropriate. The established phase function parameter is much more useful but also carries large uncertainties. Through analysis of subdiffusive photon paths we arrived at the new parameter which builds upon and makes use of higher order similarity relations. This empirically derived parameter greatly enhances the accuracy in quantifying subdiffusively backscattered light. Our findings have important consequences for the experimental study of subdiffusive light. The parameter mostly lifts the necessity of finding proper model phase functions to best mimic investigated media. This is especially useful for the study of biological tissue with mostly unknown scattering phase functions. From our study, we conclude, that it is not the phase function model and its precise shape of angular scattering that matters, but rather the correct regime. Our verification studies indicate a high significance of independent of the source and detection geometry and for both the spatial domain and the spatial frequency domain. This hints at general applicability to various experimental approaches such as differential path spectroscopy,31,32 single or multiple fiber reflectance spectroscopy,7,33 SRR,34 SFDR,11,15 and to other modalities without polarization constraints.35,36 As expected, we find the accuracy of to decrease with decreasing SDS (i.e., increasing spatial frequency) as small angular phase function features become more relevant. The same is true for decreasing detection apertures. A second benefit of comes with the enhanced replaceability of phase functions in forward models. Within the uncertainties displayed in Figs. 6 and 7 there exists a general ability to replace phase functions for forward modeling of subdiffusive (and diffusive) reflectance. Heavily oscillating or extremely strong forward peaked scattering phase functions with slowly decreasing Legendre moments can produce numerical instabilities in analytical forward models. In MC simulations, both low phase function asymmetry values, as well as phase function invertibility boost computation speed. Through -equivalent phase function replacement, it is possible to lower the asymmetry value of a model function without altering subdiffusive backscattering intensities much. The possible extend of such asymmetry lowering can be understood from Fig. 2. Our study revealed that subdiffusive backscattering intensities are mostly determined by the high-angle scattering probability of individual scatterers scaled by the asymmetry value of their scattering phase function. The parameter reflects this angular weight distribution. As a derived version of the established parameter , , is likely to relate to similar physical and microsctructural interpretation.6 Similar to the measurement of and , experimental quantification of requires forward modeling to allow for fitting of optical properties and thus solving of the inverse problem. In biomedical optics, the Reynolds–McCormick function may be a model of choice for performing forward calculations. Along with its simplicity it performs well in modeling values below . Very small values even below are possible if the second input parameter of the model function (see Table 1) is allowed to become negative. In the same sense, Henyey–Greenstein may be used for values up to . The “modified powers of cosines” function allows for modeling of the entire range presented, but achieves this in part through rather unnatural probability distributions. Consequently, the and uncertainties for this phase function type are among the largest along with those for discrete Mie scatterers. We conclude that every experimental geometry as well as every scattering regime corresponds to a different relative influence of high-order Legendre moments and thus to a different ideal value for . The subdiffusive quantifier along with the empirically selected constant provides an accurate compromise for many imaging constraints. This allows for meaningful comparison across different studies on subdiffusive backscattering. AcknowledgmentsWe acknowledge the support by the German Academic Exchange Service through their provision of a DAAD postgraduate fellowship. Furthermore we thank Dominik Reitzle and Simeon Müller for both the provision of and assistance with their computational generic solver. ReferencesA. Ishimaru, Wave Propagation and Scattering in Random Media, 1 1st ed.Academic Press, New York
(1978). Google Scholar
F. Bevilacqua and C. Depeursinge,
“Monte Carlo study of diffuse reflectance at source-detector separations close to one transport mean free path,”
J. Opt. Soc. Am. A, 16
(12), 2935
–2945
(1999). http://dx.doi.org/10.1364/JOSAA.16.002935 JOAOD6 0740-3232 Google Scholar
C. L. Hoy et al.,
“Method for rapid multidiameter single-fiber reflectance and fluorescence spectroscopy through a fiber bundle,”
J. Biomed. Opt., 18
(10), 107005
(2013). http://dx.doi.org/10.1117/1.JBO.18.10.107005 JBOPFO 1083-3668 Google Scholar
U. A. Gamm et al.,
“Quantification of the reduced scattering coefficient and phase-function-dependent parameter of turbid media using multidiameter single fiber reflectance spectroscopy: experimental validation,”
Opt. Lett., 37
(11), 1838
–1840
(2012). http://dx.doi.org/10.1364/OL.37.001838 OPLEDP 0146-9592 Google Scholar
S. C. Kanick et al.,
“Method to quantitatively estimate wavelength-dependent scattering properties from multidiameter single fiber reflectance spectra measured in a turbid medium,”
Opt. Lett., 36
(15), 2997
–2999
(2011). http://dx.doi.org/10.1364/OL.36.002997 OPLEDP 0146-9592 Google Scholar
S. Chamot et al.,
“Physical interpretation of the phase function related parameter studied with a fractal distribution of spherical scatterers,”
Opt. Express, 18
(23), 23664
–23675
(2010). http://dx.doi.org/10.1364/OE.18.023664 OPEXFF 1094-4087 Google Scholar
I. Charvet et al.,
“A new optical method for the non-invasive detection of minimal tissue alterations,”
Phys. Med. Biol., 47 2095
–2108
(2002). http://dx.doi.org/10.1088/0031-9155/47/12/307 PHMBA7 0031-9155 Google Scholar
F. Bevilacqua et al.,
“In vivo local determination of tissue optical properties: applications to human brain,”
Appl. Opt., 38
(22), 4939
–4950
(1999). http://dx.doi.org/10.1364/AO.38.004939 APOPAI 0003-6935 Google Scholar
S. C. Kanick et al.,
“Sub-diffusive scattering parameter maps recovered using wide-field high-frequency structured light imaging,”
Biomed. Opt. Express, 5
(10), 3376
–3390
(2014). http://dx.doi.org/10.1364/BOE.5.003376 BOEICL 2156-7085 Google Scholar
N. Bodenschatz et al.,
“Model based analysis on the influence of spatial frequency selection in spatial frequency domain imaging,”
Appl. Opt., 54
(22), 6725
–6731
(2015). http://dx.doi.org/10.1364/AO.54.006725 APOPAI 0003-6935 Google Scholar
N. Bodenschatz et al.,
“Detecting structural information of scatterers using spatial frequency domain imaging,”
J. Biomed. Opt., 20
(11), 116006
(2015). http://dx.doi.org/10.1117/1.JBO.20.11.116006 JBOPFO 1083-3668 Google Scholar
K. W. Calabro and I. J. Bigio,
“Influence of the phase function in generalized diffuse reflectance models: review of current formalisms and novel observations,”
J. Biomed. Opt., 19
(7), 075005
(2014). http://dx.doi.org/10.1117/1.JBO.19.7.075005 JBOPFO 1083-3668 Google Scholar
C. F. Bohren and D. R. Huffman, Absorption and Scattering of Light by Small Particles, Wiley-Interscience, New York
(1998). Google Scholar
L. O. Reynolds and N. J. McCormick,
“Approximate two-parameter phase function for light scattering,”
J. Opt. Soc. Am., 70
(10), 1206
–1212
(1980). http://dx.doi.org/10.1364/JOSA.70.001206 JOSAAH 0030-3941 Google Scholar
D. J. Cuccia et al.,
“Modulated imaging: quantitative analysis and tomography of turbid media in the spatial-frequency domain,”
Opt. Lett., 30
(11), 1354
–1356
(2005). http://dx.doi.org/10.1364/OL.30.001354 OPLEDP 0146-9592 Google Scholar
A. Liemert and A. Kienle,
“Spatially modulated light source obliquely incident on a semi-infinite scattering medium,”
Opt. Lett., 37
(19), 4158
–4160
(2012). http://dx.doi.org/10.1364/OL.37.004158 OPLEDP 0146-9592 Google Scholar
A. Liemert and A. Kienle,
“Exact and efficient solution of the radiative transport equation for the semi-infinite medium,”
Sci. Rep., 3 2018
(2013). http://dx.doi.org/10.1038/srep02018 Google Scholar
V. Turzhitsky et al.,
“A predictive model of backscattering at subdiffusion length scales,”
Biomed. Opt. Express, 1
(3), 1034
–1046
(2010). http://dx.doi.org/10.1364/BOE.1.001034 BOEICL 2156-7085 Google Scholar
I. Turcu,
“Effective phase function for light scattered by blood,”
Appl. Opt., 45
(4), 639
–647
(2006). Google Scholar
I. Turcu and R. Bratfalean,
“Narrowly peaked forward light scattering on particulate media I. Assessment of the multiple scattering contributions to the effective phase function,”
J. Opt. A Pure Appl. Opt., 10 015002
(2008). http://dx.doi.org/10.1088/1464-4258/10/01/015002 Google Scholar
N. Pfeiffer and G. H. Chapman,
“Successive order, multiple scattering of two-term Henyey-Greenstein phase functions,”
Opt. Express, 16
(18), 13637
–13642
(2008). http://dx.doi.org/10.1364/OE.16.013637 OPEXFF 1094-4087 Google Scholar
J. Piskozub and D. McKee,
“Effective scattering phase functions for the multiple scattering regime,”
Opt. Express, 19
(5), 4786
–4794
(2011). http://dx.doi.org/10.1364/OE.19.004786 OPEXFF 1094-4087 Google Scholar
M. Reilly and M. Xu,
“Analytical model for sub-diffusive light reflection and the application to spatial frequency-domain imaging,”
Proc. SPIE, 9319 93191A
(2015). http://dx.doi.org/10.1117/12.2082714 Google Scholar
J. R. Mourant et al.,
“Influence of the scattering phase function on light transport measurements in turbid media performed with small source-detector separations,”
Opt. Lett., 21
(7), 546
–548
(1996). http://dx.doi.org/10.1364/OL.21.000546 OPLEDP 0146-9592 Google Scholar
R. Samatham and S. L. Jacques,
“Determine scattering coefficient and anisotropy of scattering of tissue phantoms using reflectance-mode confocal microscopy,”
Proc. SPIE, 7187 718711
(2009). http://dx.doi.org/10.1117/12.809684 Google Scholar
S. L. Jacques,
“Probing nanoscale tissue structure using light scattering,”
Optics in the Life Sciences, NW3C.2
(2015). Google Scholar
H. C. van de Hulst, Multiple Light Scattering, 1 477
–492 Academic Press Inc., London
(1980). Google Scholar
D. R. Wyman et al.,
“Similarity relations for anisotropic scattering in Monte Carlo simulations of deeply penetrating neutral particles,”
J. Comput. Phys., 81 137
–150
(1989). http://dx.doi.org/10.1016/0021-9991(89)90067-3 JCTPAH 0021-9991 Google Scholar
A. Kienle et al.,
“Influence of the phase function on determination of the optical properties of biological tissue by spatially resolved reflectance,”
Opt. Lett., 26
(20), 1571
–1573
(2001). http://dx.doi.org/10.1364/OL.26.001571 OPLEDP 0146-9592 Google Scholar
D. L. Hull and T. H. Foster,
“Steady-state reflectance spectroscopy in the approximation,”
J. Opt. Soc. Am. A, 18
(3), 584
–599
(2001). http://dx.doi.org/10.1364/JOSAA.18.000584 JOAOD6 0740-3232 Google Scholar
A. Amelink et al.,
“Single-scattering spectroscopy for the endoscopic analysis of particle size in superficial layers of turbid media,”
Appl. Opt., 42
(19), 4095
–4101
(2003). http://dx.doi.org/10.1364/AO.42.004095 APOPAI 0003-6935 Google Scholar
A. Amelink et al.,
“In vivo measurement of the local optical properties of tissue by use of differential path-length spectroscopy,”
Opt. Lett., 29
(10), 1087
–1089
(2004). http://dx.doi.org/10.1364/OL.29.001087 OPLEDP 0146-9592 Google Scholar
S. C. Kanick et al.,
“Measurement of the reduced scattering coefficient of turbid media using single fiber reflectance spectroscopy: fiber diameter and phase function dependence,”
Biomed. Opt. Express, 2
(1), 1687
–1702
(2011). http://dx.doi.org/10.1364/BOE.2.001687 BOEICL 2156-7085 Google Scholar
F. Foschum et al.,
“Fully automated spatially resolved reflectance spectrometer for the determination of the absorption and scattering in turbid media,”
Rev. Sci. Instrum., 82 103104
(2011). http://dx.doi.org/10.1063/1.3648120 RSINAK 0034-6748 Google Scholar
A. Dunn and D. Boas,
“Transport-based image reconstruction in turbid media with small source-detector separations,”
Opt. Lett., 25
(24), 1777
–1779
(2000). http://dx.doi.org/10.1364/OL.25.001777 OPLEDP 0146-9592 Google Scholar
L. T. Perelman et al.,
“Observation of periodic fine structure in reflectance from biological tissue: a new technique for measuring nuclear size distribution,”
Phys. Rev. Lett., 80
(3), 627
–630
(1998). http://dx.doi.org/10.1103/PhysRevLett.80.627 PRLTAO 0031-9007 Google Scholar
BiographyNico Bodenschatz is a PhD student in the Materials Optics and Imaging Group under supervision of Prof. Alwin Kienle. Currently, he is on a research stay at the British Columbia Cancer Research Centre in Canada. In 2012, he received his master’s degree in physics from the University of Ulm and in 2010 he completed his bachelor’s degree in physics from the University of Konstanz. Philipp Krauter received his diploma in physics from the University of Ulm in 2012 and is currently is a PhD student in the Materials Optics and Imaging Group of Prof. Alwin Kienle. He is working on light propagation in highly scattering media. André Liemert received his diploma in mechatronics from the University of Applied Sciences, Ulm, in 2007. In 2011, he received the Dr.-Ing. degree in electrical engineering from the University of Ulm. Since 2011, he has worked as a postdoctoral researcher in the Materials Optics and Imaging Group of Prof. Alwin Kienle. Alwin Kienle is the vice director (science) of the Institut für Lasertechnologien in der Medizin und Meßtechnik, Ulm, Germany, and head of the Materials Optics and Imaging Group at ILM. In addition, he is the professor at the University of Ulm. He studied physics and received his doctoral and habilitation degrees from University of Ulm. As postdoc, he worked with research groups in Hamilton, Canada, and in Lausanne, Switzerland. |


