|
|
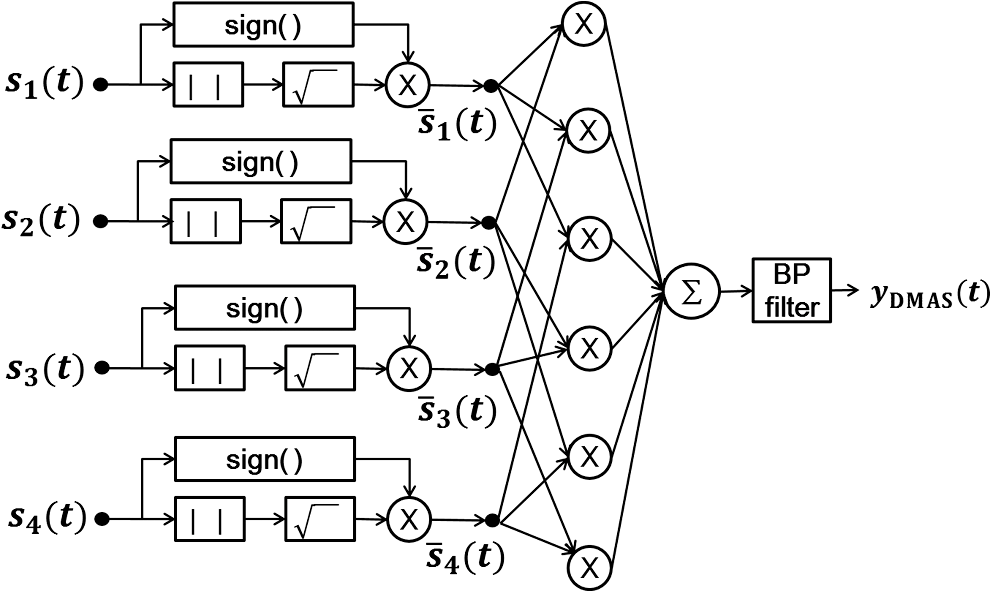
1.IntroductionPhotoacoustic imaging (PAI) is one of the fastest growing biomedical imaging modalities based on the photoacoustic (PA) transduction from light to sound. When ultrashort-pulsed laser illuminates biological tissues, wide bands of acoustic waves can be generated through transient thermoelastic expansion. The induced PA wave travels through a medium and is detected by an ultrasound (US) transducer. Then the PA images can be reconstructed via an imaging process algorithm. PAI noninvasively obtains the optical absorbing properties of biological tissues with high ultrasonic resolution in deep tissues.1,2 In general, physiologically important molecules such as hemoglobin and melanin are considered good intrinsic chromophores. Thus, label-free PAI is appropriate for vasculature structure imaging,3–5 tumor prediction,6 epidermal melanin measurement,7,8 and monitoring oxygenation in blood vessels.9 Extrinsic contrast agents (e.g., metallic, carbonic, and organic nanostructures) have been widely investigated for contrast-enhanced PAI.10–18 As one of the PAI modes, scanning-based PA microscopy (PAM) has been significantly investigated and used in biological studies. With a single laser shot, one-dimensional (1-D) PA images (referred to as A-lines) can be acquired by measuring the times of arrivals of PA signals. Through raster scanning along the two transverse directions, volumetric PA images can be obtained. Beyond one optical transport mean free path in biological tissues, the lateral and axial resolutions of PAM depend on a numerical aperture (N.A.) and bandwidth of the US transducer. This type of PAM is called acoustic-resolution PAM (AR-PAM).19–21 Typically, AR-PAM uses a spherically focused single-element US transducer with a high N.A. and frequency to improve the PA image qualities in the focal plane. However, this improvement is limited to the focal region; the image quality in the out-of-focus region is significantly degraded. To solve this problem, Zhang et al.22 proposed a method to maintain a constant US focal depth from the skin surface based on the skin profile acquired beforehand. However, this method suffers from a slow image acquisition speed and a poor lateral resolution in the off-focus region. Liao et al. proposed a synthetic aperture focusing technique (SAFT) with a virtual detector (VD) concept to expand the focal region of AR-PAM.23 SAFT is widely used in the radar and US research areas. By regarding a US transducer’s traveling distance as an effective aperture, new A-lines are obtained by linearly combining appropriately delayed scan-line signals. With the coherence factor (CF),24,25 1-D SAFT,26 two-dimensional (2-D) SAFT,27 and adaptive SAFT along the arbitrary vessel direction28 have been suggested. The phantom and in vivo studies have shown that the SAFT improved the lateral resolution and signal-to-noise ratio (SNR) in the out-of-focus region. In this study, we propose an improved version of the SAFT based on a delay-multiply-and-sum (DMAS) algorithm, which has been recently studied in microwave29 and US research areas.30 In the DMAS algorithm, the PA signals from multiple scan-lines are combinatorially coupled, multiplied, and then summed. This process can be regarded as a correlation operation of the PA signals at each scan-line, so the spatial coherent information between the PA signals can be efficiently extracted. By applying this method in conventional AR-PAM, better lateral resolution and higher SNR in out-of-focus regions are obtained than those estimated from the previously developed SAFT. Consequently, we achieve the extension of the imaging focal region. 2.Methods and Materials2.1.Conventional SAFT in AR-PAMThe conventional SAFT in AR-PAM is based on a VD concept, which considers the focal point of the US transducer as the VD [Fig. 1(a)].31 The VD is assumed to detect the PA signals back and forth with a certain angular extent. During raster scanning, the PA radiation fields of the consecutive VDs overlap, so the VDs at adjacent positions can repeatedly detect the PA signals from overlapped fields. Hence, the conventional SAFT can form the new PA A-lines by combining delayed scan-line signals that are appropriately adjusted to the VD position at each scan as follows: where is the received zero-mean signal at the ’th scan; is the number of scan-lines to be synthesized, which is determined by the angular extent of the PA radiation field; and is the time delay applied to the received signal of the ’th scan. is computed as where is the speed of sound, is the depth of the synthesized point, is the depth of the VD, and and are the depth (axial) distance and the distance from the VD to the synthesized point, respectively [Fig. 1(b)]. We assume that the scan-line signals are already time delayed, so we omit for notational simplicity in the following.Fig. 1(a) Schematic diagram of a virtual detector (VD) concept for SAFT. (b) Geometry of the VD to find a time delay for SAFT. , depth of the synthesized point; , depth of the VD; , depth (axial) distance; and , distance from the VD to the synthesized point. 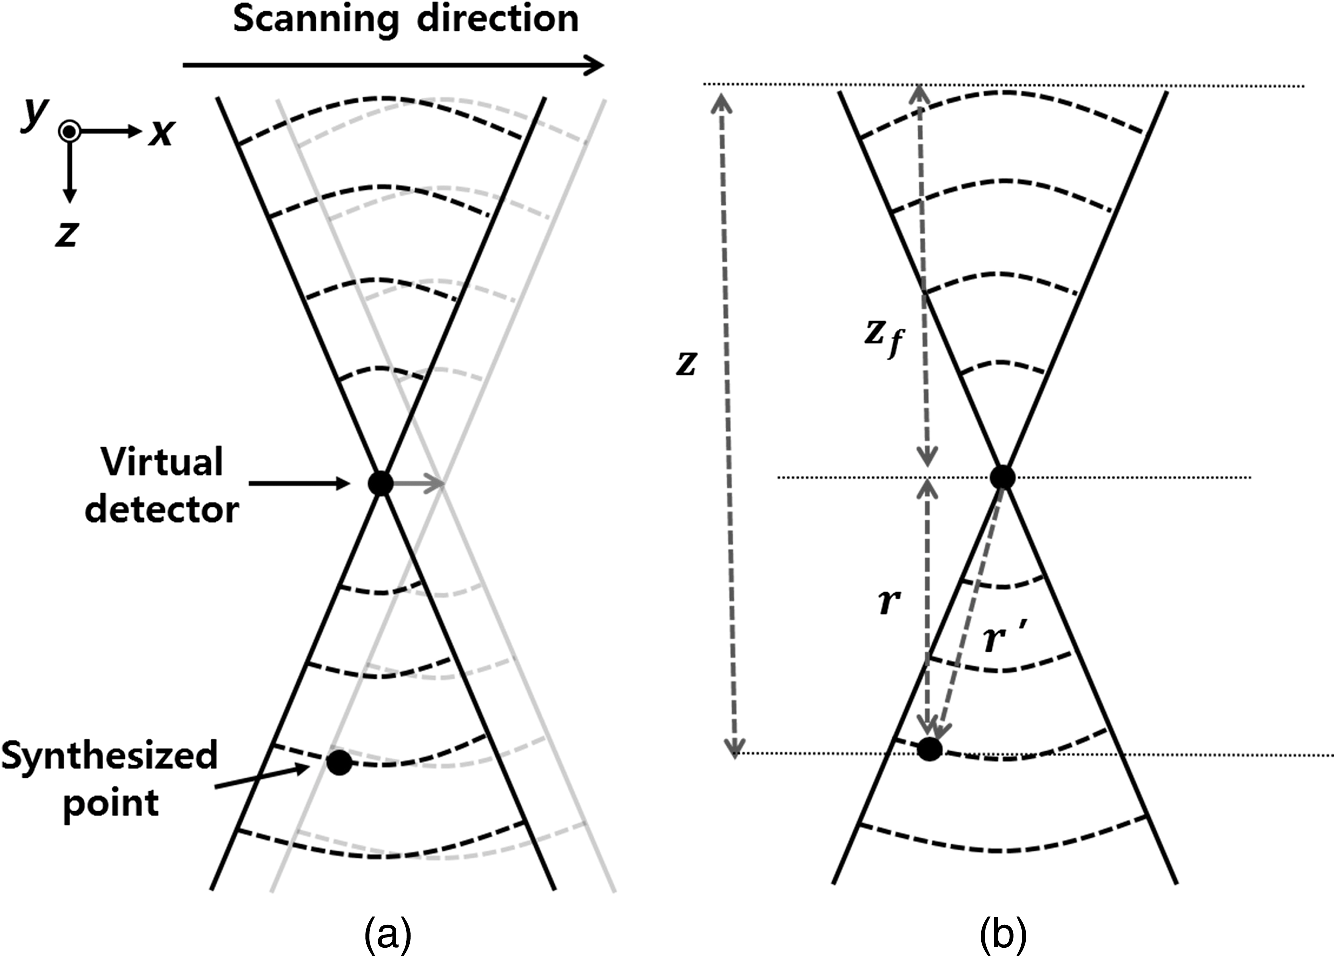 To improve the focusing quality, a CF is also used as a weighting coefficient. If an off-axis target occurs in the synthesized direction (i.e., scanning direction), then the delayed signals are no longer in phase. In such a case, the PA signals obtained after applying the SAFT are dominated by information from the off-axis target rather than the target in the synthesized direction. The CF is defined as means that the amplitude of the output should be maintained because the signals are strongly coherent; indicates that the amplitude of the output should be decreased due to its incoherence (i.e., the presence of focusing errors). Finally, the CF-weighted SAFT output can be obtained as2.2.Delay-Multiply-and-Sum-Based SAFT in AR-PAMEquation (1) can be considered a delay-and-sum (DAS) algorithm in US array signal processing.32 The DAS algorithm is simple and robust in radar and US research fields. However, it suffers from a limited resolution and poor off-axis interference rejection, which together cause broad image clutter. To overcome these problems, we suggest a new approach based on a DMAS algorithm. Similar to the DAS algorithm, the DMAS algorithm also reinforces the PA signal components from the direction of interest by combining the delayed scan-line signals, but the delayed scan-line signals are combinatorially coupled and multiplied before summation. Thus, the DMAS output is obtained as However, the output of Eq. (5) cannot be used to form PA B-scan images because it is dimensionally squared and the resultant images may be distorted. To overcome this problem, additional processing steps were added to the DMAS algorithm.30 The new equivalent scan-line signal is obtained by applying a signed geometric mean to the coupled scan-line signals as From the signed geometry mean process, the dimensionality of is the same as that of without losing its sign. Then the new A-line output is computed as Note that direct current (DC) and harmonic components appear in the spectrum of . According to the functional relationship between the time and frequency domains, the product of the two signals in the time domain is equivalent to the convolution of the spectra of the two signals in the frequency domain. Because and have similar ranges of frequency, new components centered at the zero frequency and the harmonic frequency appear in the spectrum after the coupling operation. To attenuate the DC component and to keep the harmonic signals, bandpass (BP) filtering should be applied as follows: where is the impulse response of the BP filter centered at the harmonic frequency and denotes the convolution operation.In this study, we apply this DMAS technique with some modifications. To compute the new equivalent scan-line signals in the previous DMAS algorithm, library functions such as sign, absolute, and square root were performed after coupling the signals, which require computations for each point. Sometimes the computations based on these library functions require many clock cycles, so the algorithm may run slowly. To reduce the number of these computations in this study, we derive new equivalent scan-line signals by applying the sign, absolute, and square-root operations to the received scan-line signals in advance, then coupling the resultant signals as The resultant DMAS output is the same, whereas the computational numbers of the sign, absolute, and square-root operations are reduced to for each point. The modified DMAS algorithm is schematically illustrated in Fig. 2.By applying the DMAS-based SAFT (DMAS-SAFT) in AR-PAM, we can expect the following improvements compared with the previously developed DAS-based SAFT (DAS-SAFT) in AR-PAM. First, the lateral resolution will be further improved in the off-focus regions. The lateral resolution is approximately , where is the acoustic center wavelength and N.A. is the numerical aperture. This equation can be converted to , where is the speed of sound and is the acoustic center frequency. Thus, the lateral resolution is inversely proportional to the acoustic center frequency. In the DMAS-SAFT, the synthesized signals are based on the high-frequency harmonic (i.e., second harmonic), thus the lateral resolution can be improved. Second, better clutter and noise rejection will be achieved in the off-focus regions. The coupling operation of the DMAS-SAFT significantly reduces the incoherent components such as clutter and noise. Moreover, more signals [i.e., ) are combined to compute the A-line signals compared with the DAS-SAFT (i.e., ), which improves the SNR and contrast. 2.3.Acoustic-Resolution Photoacoustic MicroscopyA commercial AR-PAM (switchable rapid-scanning PAM system, Microphotoacoustics) is utilized in our study (Fig. 3).33 The system provided laser pulses with a pulse repetition rate of 2.5 kHz, a pulse width of 9 ns, and a wavelength of 532 nm. The laser beam was coupled into a multimode fiber and focused by a collimator lens () and objective lens (). Then the laser beam passed through an optical–acoustic combiner, which consisted of a right-angle prism and rhomboid prism. The generated PA signals were reflected by a thin layer of silicone oil between the two prisms, then detected by an US transducer (V214-BB-RM, Olympus-NDT) with a center frequency of 50 MHz and a bandwidth of 100%. At the end of the optical–acoustic combiner, the acoustic lens with an N.A. of 0.5 was attached. This optical–acoustic combiner was submerged in the water tank, and the -position of the optical–acoustic combiner was adjusted to maximize the sensitivity. The laser beam and US transducer were mounted on a scanning stage (PLS-85, PI miCos GmbH, Germany) and mechanically moved in the scanning direction (i.e., along the and axes) in increments of . The detected PA signals were amplified (ZX60-3018G-S+, Mini-circuit), then sampled at a rate of 500 MHz. The sampled data were stored in a personal computer for postprocessing. The laser pulse energies were measured to be 0.1 and for phantom and in vivo studies, respectively, which are much lower than the American National Standards Institute safety standards (). The experimental lateral resolution and axial resolution were 60 and at the focal point, respectively. 3.ResultsTo investigate the DMAS-SAFT in AR-PAM, we photoacoustically imaged a carbon fiber in water. The position of the carbon fiber was vertically varied along the -axis with respect to the focal point of the transducer, i.e., , , (focal point), , and . Through raster scanning along the two transverse directions, volumetric PA signals were obtained and processed along the -axis with both DAS- and DMAS-SAFTs. Seventy-three scan-lines were used to synthesize the signals for both the DAS- and DMAS-SAFTs. The frequency range of the BP filter was 40 to 130 MHz in the DMAS-SAFT. After applying the algorithms, the envelopes of the processed PA signals along the -axis were acquired via Hilbert transformation and then compressed logarithmically. We generated the PA B-scan images from the resultant compressed envelopes in each plane and then created the PA maximum amplitude projection (MAP) images. The PA MAP images of the carbon fiber were obtained using the original method, DAS-SAFT, and DMAS-SAFT at different imaging depths (Fig. 4). The PA MAP images processed with the original method significantly deteriorate in the off-focus regions [Figs. 4(a), 4(b), 4(d), and 4(e)], while the image quality is still good at the focal point [Fig. 4(c)]. The further from the focal region, the worse the obtained images. The PA MAP images processed with the DAS-SAFT [Figs. 4(f), 4(g), 4(i), and 4(j)] show the improved lateral resolution in the out-of-focus regions due to the larger effective aperture. The image qualities are further improved in the off-focus regions when we apply the DMAS-SAFT [Figs. 4(k), 4(l), 4(n), and 4(o)]. Fig. 4PA MAP images of a carbon fiber at different depths: (a)–(e) original MAP images; (f)–(j) MAP images with the DAS-SAFT; and (k)–(o) MAP images with the DMAS-SAFT. All images are shown with a dynamic range of 15 dB. 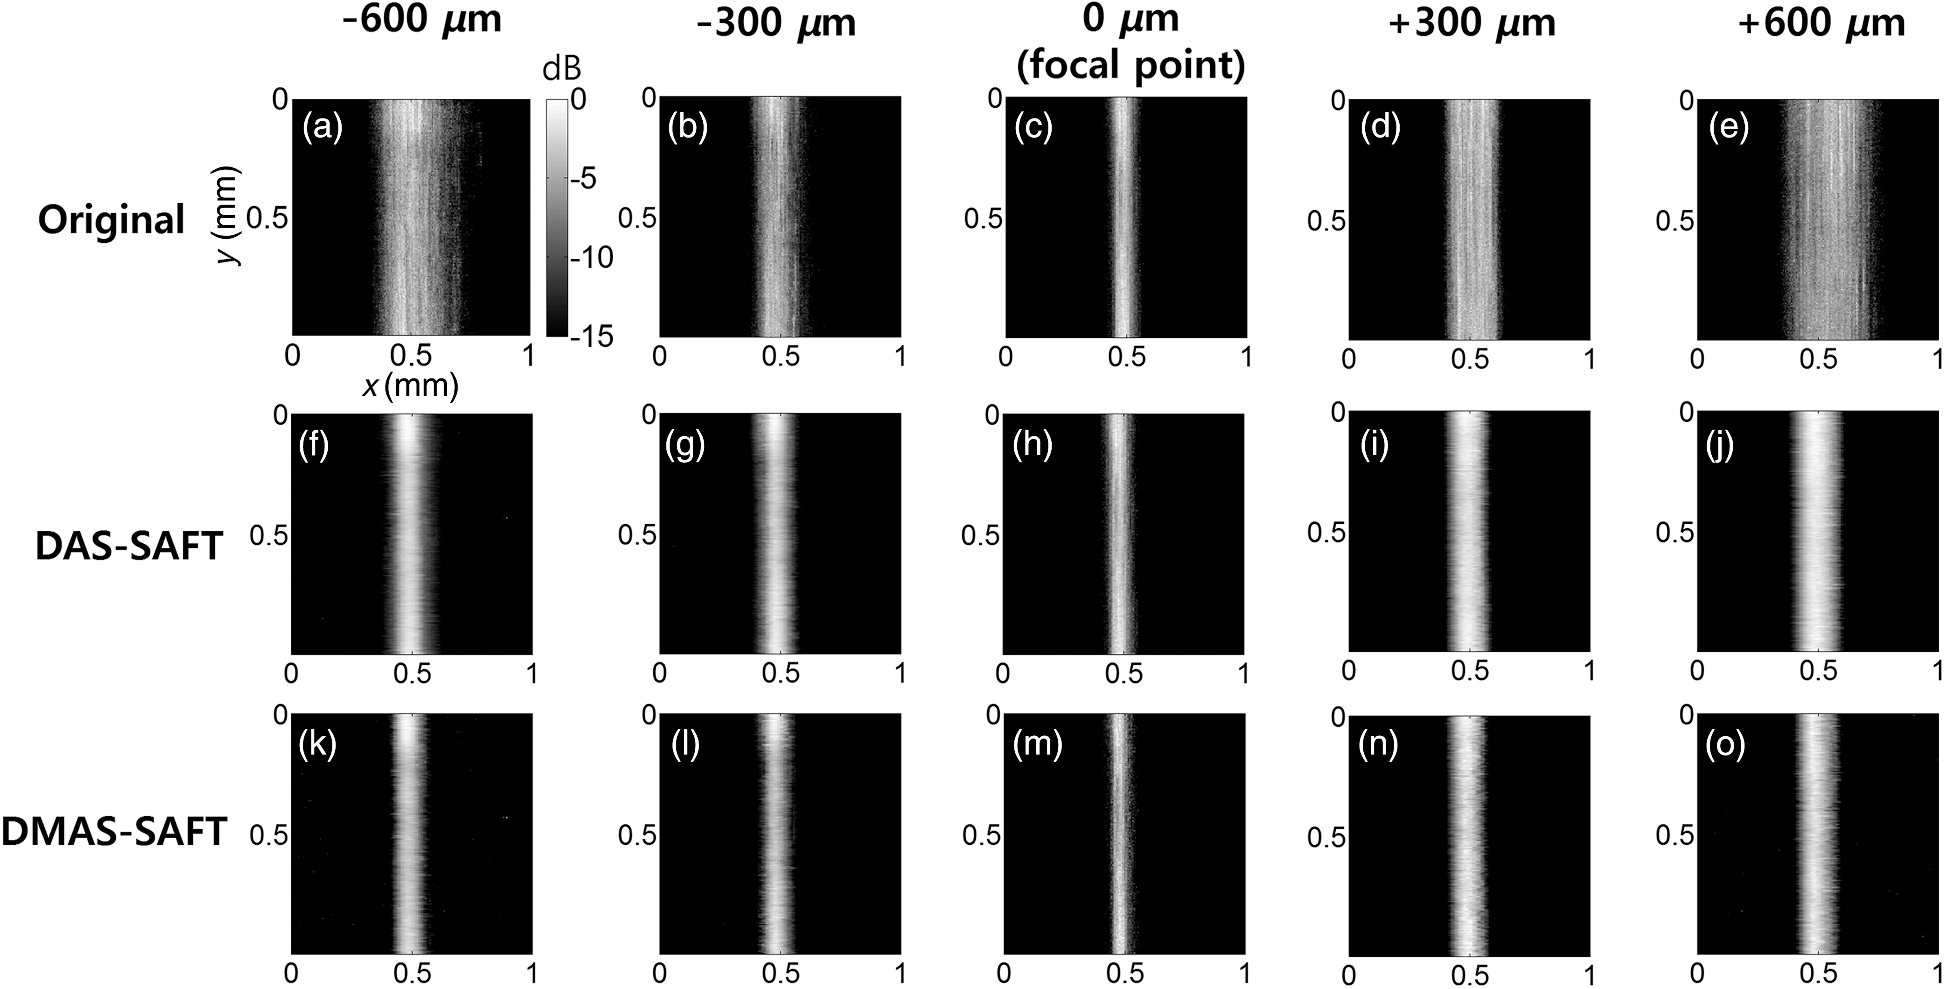 Then we compared the lateral profiles of the PA images acquired using the original method, DAS-SAFT, and DMAS-SAFT at different imaging depths (Fig. 5). Figures 5(a), 5(c), 5(e), 5(g), and 5(i) show the lateral PA profiles of the carbon fiber extracted from the PA B-scan image at , and Figs. 5(b), 5(d), 5(f), 5(h), and 5(j) are the corresponding enlarged profiles, respectively. The lateral PA response processed with the DMAS-SAFT in the focal region was similar to those treated with the original method and the DAS-SAFT [Figs. 5(e) and 5(f)]. The lateral PA response processed with the DMAS-SAFT in the out-of-focus region is much improved compared with those handled with the original method and the DAS-SAFT [Figs. 5(b), 5(d), 5(h), and 5(j)]. In addition, the PA signals from the side lobes are much suppressed with the DMAS-SAFT compared with the other two methods [Figs. 5(a), 5(c), 5(g), and 5(i)]. Thus, better noise reduction is achieved and the image contrast is consequently enhanced. Fig. 5Comparison of the lateral PA profiles acquired from a carbon fiber at the different depths. Three processing methods were used: original method, DAS-SAFT, and DMAS-SAFT. (a), (c), (e), (g), and (i) Lateral PA responses over the entire -axis. (b), (d), (f), (h), and (j) Enlarged PA profiles of (a), (c), (e), (g), and (i), respectively.  To quantitatively compare the performance of each method, we calculated the full width at half maximum (FWHM) and SNR values of the lateral PA profiles. The FWHM is considered the lateral resolution of the AR-PAM system. The SNR is defined as the ratio of the maximum intensity to the average noise intensity in the lateral PA profile. We obtained the FWHM and SNR values repeatedly at various positions, then calculated their mean and standard deviations. The resultant FWHM and SNRs are summarized in Table 1. The FWHM calculated with the DMAS-SAFT at the depth of is reduced by up to 57.6% [i.e., ] and 22.0% [i.e., ] compared with those estimated from the original method and DAS-SAFT, respectively. The SNR calculated with the DMAS-SAFT at the depth of is also increased by up to 76.8% [i.e., ] and 23.7% [i.e., ] compared with those estimated from original method and DAS-SAFT, respectively. Table 1FWHM and SNR values.
To prove the efficacy of the DMAS-SAFT, we conducted in vivo PA imaging experiments with mice. First, we noninvasively imaged the mouse abdominal region in vivo. All animal experimental protocols were approved by the POSTECH Animal Care and Use Committee. After hair depilation, the mouse was positioned on an animal stage. The mouse was anesthetized with 1% isoflurane vaporized by inhalation gas during the in vivo experiments. During the raster scanning, the body temperature was maintained at 35°C using a heating pad. A volume of () was imaged for the abdomen [Fig. 6(a)]. The PA MAP images processed with the different algorithms are shown in Figs. 6(b), 6(c), and 6(d). In addition, the depth-encoded PA MAP images processed with the different algorithms are also shown in Figs. 6(e), 6(f), and 6(g). The microvasculatures are clearly visible in all three images. The specified blood vessels [white dashed boxes 1 and 2; Figs. 6(b), 6(c), and 6(d)] are examined in detail. When the SAFT is applied, the corresponding blood vessels appear to be narrower and clearer than those processed with the original method [Fig. 6(c)]. With the DMAS-SAFT, the resolution is further improved, so the blood vessels are imaged to be much narrower and clearer than when the other methods are used [Fig. 6(d)]. This comparison is confirmed by the depth-resolved PA B-scan images, which show the corresponding point targets [white arrows in Figs. 6(h)–6(m)]. The DMAS-SAFT resolves the point targets better and provides a higher contrast and clearer edge definition than the other methods do with the same dynamic range. We also obtained the lateral PA profiles of the corresponding point targets using the different algorithms [Figs. 6(n) and 6(o)]. The DMAS-SAFT provides the narrowest lateral profile and highest image contrast. Fig. 6PA images of a mouse abdominal region in vivo. (a) Photograph of the mouse abdomen. (b), (c), and (d) PA MAP images of the mouse abdomen processed with the original method, DAS-SAFT, and DMAS-SAFT, respectively. (e), (f), and (g) Depth-encoded PA MAP images of the mouse abdomen processed with the original method, DAS-SAFT, and DMAS-SAFT, respectively. (h), (i), and (j) PA B-scan images of (b), (c), and (d) cut along Line 1, respectively. (k), (l), and (m) PA B-scan images of (b), (c), and (d) cut along Line 2, respectively. (n) and (o) Lateral PA profiles of the blood vessels indicated by Arrows 1 and 2, respectively. All images are shown with a dynamic range of 30 dB. PA, photoacoustic; MAP, maximum amplitude projection.  PA images were also obtained for the vasculature distribution in the mouse’s leg ( along , , and axes; Fig. 7). Similar to the PA images of the mouse’s abdomen, the PA MAP images of the blood vessels provided by the original method away from the focus (white dashed boxes 1, 2, and 3) are broadened and unclear [Fig. 7(b)], but are narrower and clearer when the SAFT and DMAS-SAFT are used [Figs. 7(c) and 7(d)]. Moreover, the PA MAP image with the DMAS-SAFT shows better resolution and contrast than that with the other methods [Fig. 7(d)]. In these measurements, reverberation artifacts (white arrows in the PA B-scan images) appear due to the presence of the leg bones. These artifacts are significant in the PA B-scan image obtained using the original method [Figs. 7(e) and 7(h)], but are reduced when the SAFT is used [Figs. 7(f) and 7(i)], and are further reduced when the DMAS-SAFT is used [Figs. 7(g) and 7(h)]. We also compare the axial PA profiles of the corresponding targets [white arrows in Figs. 7(e)–7(j)] in the PA B-scan images obtained from the original method, DAS-SAFT, and DMAS-SAFT [Figs. 7(k) and 7(l)]. The reverberation artifacts appear in the axial PA profiles [green box in Figs. 7(k) and 7(l)]. When DMAS-SAFT is used, the power of these artifacts is further reduced along the -direction than those of the original method and DAS-SAFT. Fig. 7PA images of a mouse leg region in vivo. (a) Photograph of the mouse leg. (b), (c), and (d) PA MAP images of the mouse leg processed with the original method, DAS-SAFT, and DMAS-SAFT, respectively. (e), (f), and (g) PA B-scan images of (b), (c), and (d) cut along Line 1, respectively. (h), (i), and (j) PA B-scan images of (b), (c), and (d) cut along Line 2, respectively. (k) and (l) Axial PA profiles of the positions indicated by Arrows 1 and 2, respectively. All images are shown with a dynamic range of 45 dB. PA, photoacoustic; MAP, maximum amplitude projection.  4.DiscussionWith the DMAS-SAFT, the lateral resolution is improved compared with the DAS-SAFT. In the phantom test, we confirm that the DMAS-SAFT provides a more accurate representation of the carbon fiber with narrower width than the DAS-SAFT when the carbon is located in the out-of-focus region. Therefore, the DMAS-SAFT expands the focal region and reduces the dependence on imaging depth. This improvement is also obtained in in vivo experiments. The DMAS-SAFT provides a higher SNR and finer lateral resolution than the DAS-SAFT and original method do. Due to the coupling operations, more equivalent RF signals [] are included and summed to compute the A-line outputs in the DMAS-SAFT compared with the DAS-SAFT (). As a result, incoherent components such as noise are much reduced. In in vivo experiments, the reverberation artifacts caused by strong acoustic specular reflectors such as bones can be problematic in PA B-scan images. The DMAS-SAFT attenuates reverberation artifacts further than the original method and DAS-SAFT do. This reduction by the DMAS-SAFT occurs because it can enhance the coherent components along the scan-lines; as a result, the relatively less coherent artifacts are shrunk and attenuated. However, the DMAS-SAFT has a higher computational complexity than the DAS-SAFT. To compute one pixel with scan-lines, the DAS-SAFT requires only additions [, whereas the DMAS-SAFT requires multiplications and [] additions with the computations of library functions []. For example, with scan-lines, only 73 additions are required for the DAS-SAFT. However, 2628 additions and 2627 multiplications with 219 library functions are required for the DMAS-SAFT. In the in vivo PA experiments of the mouse leg, double-precision floating-point data with a size of along , , and axes were used, and it took about 2 h to process the DMAS-SAFT data using a multicore CPU system (Intel® Core I7-3820, Window 7 64 bit) with multithread processing. Although the SNR and lateral resolution can be improved by extending the US focal zone with the depth-scanning method, it would suffer from the additional image acquisition time. We expect that the processing time would be much improved using a graphics processing unit. In this study, we describe 1-D DMAS-SAFT. Simple modifications can expand this to a 2-D version as in Ref. 27, then yield isotropic lateral resolution in both and axes. 5.ConclusionWe proposed the DMAS-SAFT for AR-PAM. In phantom and in vivo studies, we demonstrate that the DMAS-SAFT improves the lateral resolution and SNR compared with the original method and the previously developed DAS-SAFT in the out-of-focus region. Therefore, the DMAS-SAFT expands the focal region and thus reduces the dependence on imaging depth. Further, the DMAS-SAFT strongly attenuates reverberation artifacts caused by bones. This reduction is a benefit of the improved ability of the DMAS-SAFT to enhance the coherent components along the scan-lines. With the computationally efficient implementation, the DMAS-SAFT can be a promising tool for AR-PAM. AcknowledgmentsThis work was supported by the research funds from an IITP ICT Consilience Creative Program (IITP-2015-R0346-15-1007), the China-ROK joint research program (NRF-2013K1A3A1A20046921), and an NRF Pioneer Research Center Program (NRF-2014M3C1A3017229) of the Ministry of Science, ICT and Future Planning, Republic of Korea. ReferencesM. Jeon and C. Kim,
“Multimodal photoacoustic tomography,”
IEEE Multimedia, 15
(5), 975
–982
(2013). http://dx.doi.org/10.1109/TMM.2013.2244203 IEMUE4 Google Scholar
M. Jeon, J. Kim and C. Kim,
“Multiplane spectroscopic whole-body photoacoustic imaging of small animals in vivo,”
Med. Biol. Eng. Comput., 1
–12
(2014). http://dx.doi.org/10.1007/s11517-014-1182-6 MBECDY 0140-0118 Google Scholar
X. Wang et al.,
“Three-dimensional laser-induced photoacoustic tomography of mouse brain with the skin and skull intact,”
Opt. Lett., 28
(19), 1739
–1741
(2003). http://dx.doi.org/10.1364/OL.28.001739 OPLEDP 0146-9592 Google Scholar
G. Ku et al.,
“Imaging of tumor angiogenesis in rat brains in vivo by photoacoustic tomography,”
Appl. Opt., 44
(5), 770
–775
(2005). http://dx.doi.org/10.1364/AO.44.000770 APOPAI 0003-6935 Google Scholar
J. J. Niederhauser et al.,
“Combined ultrasound and optoacoustic system for real-time high-contrast vascular imaging in vivo,”
IEEE Trans. Med. Imaging, 24
(4), 436
–440
(2005). http://dx.doi.org/10.1109/TMI.2004.843199 ITMID4 0278-0062 Google Scholar
R. O. Esenaliev et al.,
“Sensitivity of laser opto-acoustic imaging in detection of small deeply embedded tumors,”
IEEE J. Sel. Top. Quantum Electron., 5
(4), 981
–988
(1999). http://dx.doi.org/10.1109/2944.796320 IJSQEN 1077-260X Google Scholar
E. V. Savateeva et al.,
“Noninvasive detection and staging of oral cancer in vivo with confocal optoacoustic tomography,”
Proc. SPIE, 3916 55
–66
(2000). http://dx.doi.org/10.1117/12.386341 PSISDG 0277-786X Google Scholar
J. A. Viator et al.,
“Photoacoustic measurement of epidermal melanin,”
Proc. SPIE, 4960 14
–20
(2003). http://dx.doi.org/10.1117/12.477648 PSISDG 0277-786X Google Scholar
R. O. Esenaliev et al.,
“Optoacoustic technique for noninvasive monitoring of blood oxygenation: a feasibility study,”
Appl. Opt., 41
(22), 4722
–4731
(2002). http://dx.doi.org/10.1364/AO.41.004722 APOPAI 0003-6935 Google Scholar
C. Kim, C. Favazza and L. V. Wang,
“In vivo photoacoustic tomography of chemicals: high-resolution functional and molecular optical imaging at new depths,”
Chem. Rev., 110
(5), 2756
–2782
(2010). http://dx.doi.org/10.1021/cr900266s CHREAY 0009-2665 Google Scholar
C. Kim et al.,
“In vivo molecular photoacoustic tomography of melanomas targeted by bioconjugated gold nanocages,”
ACS Nano, 4
(8), 4559
–4564
(2010). http://dx.doi.org/10.1021/nn100736c ANCAC3 1936-0851 Google Scholar
J. Koo et al.,
“In vivo non-ionizing photoacoustic mapping of sentinel lymph nodes and bladders with ICG-enhanced carbon nanotubes,”
Phys. Med. Biol., 57
(23), 7853
(2012). http://dx.doi.org/10.1088/0031-9155/57/23/7853 PHMBA7 0031-9155 Google Scholar
X. Liu et al.,
“ nanocrystals with localized surface plasmon resonance as sensitive contrast agents for in vivo photoacoustic imaging: demonstration of sentinel lymph node mapping,”
Adv. Healthcare Mater., 2
(7), 952
–957
(2013). http://dx.doi.org/10.1002/adhm.v2.7 Google Scholar
M. Jeon et al.,
“Nonionizing photoacoustic cystography with near-infrared absorbing gold nanostructures as optical-opaque tracers,”
Nanomedicine, 9
(9), 1377
–1388
(2014). http://dx.doi.org/10.2217/nnm.13.103 1743-5889 Google Scholar
A. Srivatsan et al.,
“Gold nanocage-photosensitizer conjugates for dual-modal image-guided enhanced photodynamic therapy,”
Theranostics, 4
(2), 163
–174
(2014). http://dx.doi.org/10.7150/thno.7064 Google Scholar
M. Jeon et al.,
“Methylene blue microbubbles as a model dual-modality contrast agent for ultrasound and activatable photoacoustic imaging,”
J. Biomed. Opt., 19
(1), 016005
(2014). http://dx.doi.org/10.1117/1.JBO.19.1.016005 JBOPFO 1083-3668 Google Scholar
Y. Zhang et al.,
“Non-invasive multimodal functional imaging of the intestine with frozen micellar naphthalocyanines,”
Nat. Nanotechnol., 9
(8), 631
–638
(2014). http://dx.doi.org/10.1038/nnano.2014.130 NNAABX 1748-3387 Google Scholar
C. Lee et al.,
“Dual-color photoacoustic lymph node imaging using nanoformulated naphthalocyanines,”
Biomaterials, 73 142
–148
(2015). http://dx.doi.org/10.1016/j.biomaterials.2015.09.023 BIMADU 0142-9612 Google Scholar
C. Kim, M. Jeon and L. V. Wang,
“Nonionizing photoacoustic cystography in vivo,”
Opt. Lett., 36
(18), 3599
–3601
(2011). http://dx.doi.org/10.1364/OL.36.003599 OPLEDP 0146-9592 Google Scholar
S. Park et al.,
“Acoustic resolution photoacoustic microscopy,”
Biomed. Eng. Lett., 4
(3), 213
–222
(2014). http://dx.doi.org/10.1007/s13534-014-0153-z Google Scholar
J. Y. Kim et al.,
“Fast optical-resolution photoacoustic microscopy using a 2-axis water-proofing MEMS scanner,”
Sci. Rep., 5
(2015). http://dx.doi.org/10.1038/srep07932 SRCEC3 2045-2322 Google Scholar
H. F. Zhang, K. Maslov and L. V. Wang,
“Automatic algorithm for skin profile detection in photoacoustic microscopy,”
J. Biomed. Opt., 14
(2), 024050
(2009). http://dx.doi.org/10.1117/1.3122362 JBOPFO 1083-3668 Google Scholar
C. K. Liao, M. L. Li and P. C. Li,
“Optoacoustic imaging with synthetic aperture focusing and coherence weighting,”
Opt. Lett., 29
(21), 2506
–2508
(2004). http://dx.doi.org/10.1364/OL.29.002506 OPLEDP 0146-9592 Google Scholar
K. Hollman, K. Rigby and M. O’Donnell,
“Coherence factor of speckle from a multi-row probe,”
in Proc IEEE Ultrason. Symp.,
1257
–1260
(1999). http://dx.doi.org/10.1109/ULTSYM.1999.849225 Google Scholar
P. C. Li and M. L. Li,
“Adaptive imaging using the generalized coherence factor,”
IEEE Trans. Ultrason. Ferroelectr. Freq. Control, 50
(2), 128
–141
(2003). http://dx.doi.org/10.1109/TUFFC.2003.1182117 ITUCER 0885-3010 Google Scholar
M. L. Li et al.,
“Improved in vivo photoacoustic microscopy based on a virtual-detector concept,”
Opt. Lett., 31
(4), 474
–476
(2006). http://dx.doi.org/10.1364/OL.31.000474 OPLEDP 0146-9592 Google Scholar
Z. Deng et al.,
“Two-dimensional synthetic-aperture focusing technique in photoacoustic microscopy,”
J. Appl. Phys., 109
(10), 104701
(2011). http://dx.doi.org/10.1063/1.3585828 JAPIAU 0021-8979 Google Scholar
Z. Deng et al.,
“Adaptive synthetic-aperture focusing technique for microvasculature imaging using photoacoustic microscopy,”
Opt. Express, 20
(7), 7555
–7563
(2012). http://dx.doi.org/10.1364/OE.20.007555 OPEXFF 1094-4087 Google Scholar
H. B. Lim et al.,
“Confocal microwave imaging for breast cancer detection: delay-multiply-and-sum image reconstruction algorithm,”
IEEE Trans. Biomed. Eng., 55
(6), 1697
–1704
(2008). http://dx.doi.org/10.1109/TBME.2008.919716 IEBEAX 0018-9294 Google Scholar
G. Matrone et al.,
“The delay multiply and sum beamforming algorithm in ultrasound B-mode medical imaging,”
IEEE Trans. Med. Imaging, 34
(4), 940
–949
(2015). http://dx.doi.org/10.1109/TMI.2014.2371235 ITMID4 0278-0062 Google Scholar
M. L. Li, W. J. Guan and P. C. Li,
“Improved synthetic aperture focusing technique with applications in high-frequency ultrasound imaging,”
IEEE Trans. Ultrason. Ferroelectr. Freq. Control, 51
(1), 63
–70
(2004). http://dx.doi.org/10.1109/TUFFC.2004.1268468 ITUCER 0885-3010 Google Scholar
M. Brandstein and D. Ward, Microphone Arrays: Signal Processing Techniques and Applications, Springer Science & Business Media, New York
(2001). Google Scholar
S. Hu, K. Maslov and L. V. Wang,
“Second-generation optical-resolution photoacoustic microscopy with improved sensitivity and speed,”
Opt. Lett., 36
(7), 1134
–1136
(2011). http://dx.doi.org/10.1364/OL.36.001134 OPLEDP 0146-9592 Google Scholar
BiographyJongin Park received his BS degree in electrical engineering from Pohang University of Science and Technology (POSTECH), Republic of Korea, in 2009. He is currently PhD student in electrical engineering at POSTECH. His research interests include signal processing, computing, and their applications to biology. Seungwan Jeon completed his BS degree in biomedical engineering at Yonsei University and is now a PhD student in Creative IT Engineering Department at Pohang University of Science and Technology (POSTECH). His research interests are photoacoustic microscopy, medical ultrasound imaging, and image processing. Jing Meng is an associate professor at the Qufu Normal University. She received her PhD degree in computer engineering from Soochow University in 2006. She engaged in photoacoustic imaging as a research fellow at the Shenzhen Institutes of Advanced Technology, Chinese Academy of Sciences from 2011 to 2013. Her current research interests include photoacoustic imaging, reconstruction algorithms, and signal processing. Liang Song, PhD, is professor and founding director of the Research Lab for Biomedical Optics and Molecular Imaging at the Shenzhen Institutes of Advanced Technology, the Chinese Academy of Sciences. He also serves as the founding director of the Shenzhen Key Lab for Molecular Imaging. Prior to joining SIAT, he studied at Washington University, St. Louis under the tutelage of Lihong Wang and received his PhD in biomedical engineering in 2010. Jin S. Lee received his PhD in system science from the University of California, Los Angeles, in 1984. Since 1989, he has been a professor at Pohang University of Science and Technology (POSTECH), Pohang, Republic of Korea. He is currently the head of Creative IT Engineering Department and the director of Future IT Innovation Laboratory at POSTECH. His research interests include nonlinear systems and control, robotics, and intelligent control. Chulhong Kim is currently an associate professor of Creative IT Engineering at Pohang University of Science and Technology, in Republic of Korea. Before he joined the department, he was an assistant professor of biomedical engineering at the University at Buffalo, the State University of New York from 2010 to 2013. He studied for his PhD and postdoctoral training at Washington University in St. Louis, St. Louis, Missouri. |
||||||||||||||||||||||||||||||||||||||||||||||||