
|
|
1.IntroductionOcclusal caries lesions are routinely detected in the United States using visual/tactile (explorer) methods coupled with radiography. Radiographic methods have poor sensitivity for occlusal lesions, and by the time the lesions are radiolucent they have typically progressed deep into the dentin.1 Some of these “hidden” lesions may show up in radiographs, but most do not.2,3 Such lesions are more common today with the widespread use of fluoride, and new methods are needed to detect these lesions. The diagnodent that detects the fluorescence of porphyrin molecules found in bacteria was developed for detecting hidden lesions; however, it suffers from a high rate of false positives and does not measure either the depth or exact position of the lesions.4,5 Recent studies utilizing the practice-based research network6–9 funded by the National Institutes of Health indicated that a third of all patients have a questionable occlusal caries lesion (QOC), which can be defined as occlusal surfaces with no cavitation and no radiographic radiolucencies but where caries is suspected due to roughness, surface opacities, or staining. After monitoring QOCs for 20 months, 90% did not require intervention. The identification of occlusal lesions penetrating to dentin is poor, with an accuracy of .10,11 Optical coherence tomography (OCT) is a noninvasive technique for creating cross-sectional images of internal biological structure.12 Several groups have used OCT and polarization-sensitive OCT (PS-OCT) to image dental caries13–16 on both smooth surfaces and occlusal surfaces. We have demonstrated that polarization sensitivity is invaluable for providing depth-resolved measurements of the severity of demineralization both in vitro and in vivo.16–18 Quantitative depth-resolved measurements are useful for clinical studies and for monitoring the state of early lesions, and our studies indicate that polarization sensitivity provides considerable advantages for the measurement of early demineralization near tooth surfaces.16–18 However, many clinicians are only interested in knowing how deep the occlusal lesions have actually penetrated into the tooth so that they can decide whether a restoration is necessary. Our recent studies show that the visibility of hidden occlusal lesions can be significantly increased by use of optical clearing agents and image analysis methods.19,20 Optical clearing agents have routinely been used in biological microscopy and have found recent application in clinical imaging, including OCT.21,22 We postulate that OCT is ideally suited for monitoring and improving the diagnosis of QOCs, and methods can be developed to enhance the visibility of hidden subsurface lesions. Even though the optical penetration of near-IR light can easily exceed 7 mm through sound enamel to image lesions on proximal surfaces with high contrast,23 the large increase in light scattering due to demineralization24 typically limits optical penetration in highly scattering lesions (also dentin and bone) to 1 to 2 mm, thus cutting off the OCT signal before it reaches the dentinal–enamel junction (DEJ). However, most occlusal lesions rapidly spread laterally under the enamel upon contacting the more soluble softer dentin. In previous studies, we demonstrated that OCT can be used to determine if occlusal lesions have penetrated to the underlying dentin25,26 by detecting the lateral spread across the DEJ. If extensive demineralization is present from the enamel surface all the way down to the DEJ, the optical penetration is highly variable, that is, sometimes the entire lesion is visible from the enamel surface to the DEJ, while more typically only the outer surface of the lesion is visible or the area where the lesion has reached the DEJ (lower part) can be seen. Most lesions extend laterally along the DEJ upon reaching the underlying dentin under sound enamel; therefore with sufficient optical penetration we should be able to determine whether most lesions have reached the DEJ. In a previous clinical study, 12 out of 14 of the lesions examined in vivo using OCT exhibited increased reflectivity below the DEJ, which suggested that the lesions had spread to the dentin. Since none of the lesions showed up on a radiograph, this is a remarkable improvement in sensitivity over existing technology.25,26 We previously demonstrated that index matching agents can be used to enhance the contrast of demineralization and that better images could be acquired in occlusal surfaces by use of index matching agents applied to the fissure areas.17 Higher index agents also appeared to increase the optical penetration depth of OCT. The viscosity is also important because penetration of the agent into the lesion pores can decrease the lesion contrast. Even though such penetration is anticipated to lower the contrast of the lesion near the tooth surface, it is also expected to increase the optical penetration to deeper layers in the lesion. In addition, various imaging analysis methods have been developed for enhancing the visibility of subsurface structures and edges, speckle reduction, and denoising OCT images.27–29 The rotating kernel transformation is one approach that has been successful for edge detection in OCT images.30–33 In this study, we investigated the performance of a VPS impression material that is used clinically, which also acts as an optical clearing agent to enhance the visibility of occlusal lesions that have penetrated to the underlying dentin and also enhance the visibility of the DEJ. 2.Materials and Methods2.1.Sample PreparationTeeth extracted from patients in the San Francisco Bay area were collected, cleaned, and sterilized with gamma radiation. Molars and premolars were visually inspected for caries lesions. On extracted molars these lesions are easily identified as white or brown/black (pigmented) spots on the tooth surface, and specimens are readily available. Those samples with suspected lesions were further screened using a near-IR transillumination imaging system operating at 1300 nm. In the visible range, it is difficult to differentiate between stains and actual decay. Many of the teeth selected by visual inspection were only stained without decay. The organic molecules that cause pigmentation apparently do not strongly absorb near-IR light, and staining does not interfere in the near-IR.34,35 Ten samples were selected with suspected deep naturally existing occlusal decay using this screening technique. The roots were cut off, and the teeth were mounted on rectangular blocks of black orthodontic composite resin with the occlusal surface containing the lesion facing out from the square surface of the block. Each rectangular block fit precisely in an optomechanical assembly that could be positioned with micron accuracy. A VPS impression material, Star VPS Clear Bite (Danville Materials, San Ramon, California), that is currently being used clinically to take impressions for restorations was used. OCT images were acquired before and after application of the VPS. The VPS is a viscous liquid that hardens in place within 10 to 15 s, and it was applied liberally to fill the pits and fissures of the occlusal surface. OCT images were subsequently acquired with the VPS hardened in place, and it was removed after OCT imaging by simply pulling off the impression. After imaging the teeth were sectioned for histological examination and microradiography. 2.2.Digital MicroscopyImages of the tooth occlusal surfaces were examined using a digital microscopy/three-dimensional surface profilometry system, the VHX-1000 from Keyence (Elmwood, New Jersey) with the VH-Z25 lens with a magnification from 25 to . Depth composition digital microscopy images were acquired by scanning the image plane of the microscope and reconstructing a depth composition image with all points at optimum focus displayed in a two-dimensional image. 2.3.Near-IR Transillumination ImagingTeeth were examined initially using near-IR transillumination to screen for occlusal lesions.35,36 A 150-W fiber-optic illuminator (FOI-1 E Licht Company, Denver, Colorado) with a low-profile fiber optic with dual line lights (Model P39-987, Edmund Scientific, Barrington, New Jersey) was used with each light line directed at the cementoenamel junction beneath the crown on the buccal and lingual sides of each tooth. Light leaving the occlusal surface was directed by a right angle prism to an InGaAs camera equipped with a Navitar (Rochester, New York) SWIR-35 lens, a 75-mm plano-convex lens (LA1608-C, Thorlabs, Newton, New Jersey) and a 90-nm wide bandpass filter centered at 1300 nm (BP1300-90, Spectrogon, Parsippany, New Jersey). A element InGaAs area camera (SU320-KTSX, Wakefield, Massachusetts) from Sensors Unlimited (Princeton, New Jersey) was used with a pixel pitch. 2.4.Optical Coherence Tomography SystemA single-mode fiber, autocorrelator-based optical coherence domain reflectometry (OCDR) system with an integrated fiber probe, high efficiency piezoelectric fiber-stretchers, and two balanced InGaAs receivers that was designed and fabricated by Optiphase, Inc. (Van Nuys, California) was integrated with a broadband high power superluminescent diode (SLD) (DL-CS313159A, Denselight, Jessup, Maryland) with an output power of 19 mW, a bandwidth of 83 nm, and a high-speed XY-scanning system, ESP 300 controller, and 850-HS stages (Newport, Irvine, California) and used for in vitro optical tomography. The fiber probe was configured to provide an axial resolution at in air and in enamel and a lateral resolution of over the depth of focus of 10 mm. The all-fiber OCDR system has been previously described in greater detail.37 The OCT system is completely controlled using Labview™ software (National Instruments, Austin, Texas). Acquired scans are compiled into -scan files. Image processing was carried out using Igor Pro™ data analysis software (Wavemetrics Inc., Lake Oswego, Oregon). 2.5.Polarized Light Microscopy and Digital Transverse MicroradiographyAfter sample imaging was completed, thick serial sections were cut using an Isomet 5000 saw (Buehler, Illinois) for polarized light microscopy (PLM) and transverse microradiography (TMR). PLM was carried out using a Meiji Techno Model RZT microscope (Meiji Techno Co., Ltd., Saitama, Japan) with an integrated digital camera, Canon EOS Digital Rebel XT (Canon Inc., Tokyo, Japan). The sample sections were imbibed in water and examined in the brightfield mode with crossed polarizers and a red I plate with 500-nm retardation. PLM images were acquired at magnification and had a resolution of . A custom built digital TMR system was used to measure the volume percent mineral content in the areas of demineralization on the tooth sections.38 High-resolution microradiographs were taken using radiation from a Philips 3100 X-ray generator and a Photonics Science FDI x-ray digital imager (Microphotonics, Allentown, Pennsylvania). The x-ray digital imager consisted of a interline CCD directly bonded to a coherent micro fiber-optic coupler that transfers the light from an optimized gadolinium oxysulfide scintillator to the CCD sensor. The pixel resolution was , and the images were acquired at . A high-speed motion control system with Newport UTM150 and 850G stages and an ESP 300 controller coupled to a video microscopy and a laser targeting system was used for precise positioning of the sample in the field of view of the imaging system. 2.6.Image Analysis and StatisticsImage processing was carried out using Igor Pro™ data analysis software (Wavemetrics Inc., Lake Oswego, Oregon). A reference a-scan was acquired from a mirror prior to scanning the samples. The reference a-scan contains several weak artifact signals along with the primary reflection. The reference array was normalized to the intensity of the point of interest and subtracted to selectively remove the artifacts and reduce noise. Background subtraction was carried out by subtracting the mean reflectivity of 5000 data points measured in air from the top 100 pixels of the 50 unprocessed a-scans outside the sample area. Tomographic images of the sample were reconstructed from the parallel b-scans. The images were convolved with a Gaussian filter ( filter, ) to reduce speckle noise. OCT images were acquired of the suspect occlusal surfaces with and without VPS added to the tooth surfaces. Selected a-scans were chosen from acquired b-scans which contained subsurface reflections 2 to 3 mm below the surface adjacent to the fissures with occlusal lesions characteristic of increased reflectivity at the DEJ. The reflectance at the lesion surface in the center of the fissure is very strong, and the OCT signal is quickly attenuated. However, lesions that penetrate to the DEJ typically spread laterally in the less acid resistant dentin so adjacent areas of the lesion are located under sound enamel and show up in OCT images as strong reflections well below the tooth surface, usually at the position of the DEJ. These b-scans typically have two areas of increased reflectivity corresponding to the tooth surface () and the position of the dentin or DEJ (). These positions can be seen in the a-scan images of Fig. 1. The respective amplitudes of the surface peak are designated as and and for the second subsurface peak they are and , respectively. The lesion depth or distance separating the first and second peaks is and was measured before and after application of VPS. The breadth of the second peak was also measured before and after application of VPS; it was demarcated by a fall-off in intensity compared with the center of that peak as shown by the red dashed lines in Fig. 1. The integrated reflectivity, , of the subsurface peak was calculated over the breadth of that peak, between the two red dashed lines. The percentage change in was used to represent the increase in visibility of the subsurface lesion. Fig. 1Diagram describing the calculations performed on the OCT a-scans taken (a) before and (b) after application of the optical clearing agent. The amplitudes of the surface peak are shown with the purple arrow, before and after ( and , respectively) along with the amplitudes of the second subsurface peak shown with the green arrow, labeled and , respectively. The axial depths separating the first and second peaks are and , respectively, and the integrated reflectivity, , of the subsurface peak was calculated between the two red dashed lines.  A paired -test (two tailed) was used to compare measurements before and after application of VPS. A significance level of 0.05 was used. Analysis was carried out using Graphpad Prism (La Jolla, California). 3.ResultsSample OCT b-scan and a-scan images are shown in Figs. 2Fig. 3–4 before and after the VPS impression material was applied to the occlusal surfaces. Figure 2 shows one sample lesion for which the subsurface lesion/peak was not visible in OCT images without the VPS impression material, Fig. 2(a). The b-scan OCT image taken after application of VPS, Fig. 2(b), clearly shows the subsurface lesion beneath the surface near the DEJ with an intensity approaching the magnitude of the reflectivity of the surface. The demineralization is so strong at the center of the fissure at the position of the green arrow that it completely blocks light penetration even with the addition of the VPS. The surface of the VPS layer is also visible at this position as the thin meniscus located above the center of the fissure. The sample was sectioned, and polarized and nonpolarized microscope images of the section matching the position of the OCT b-scans of Fig. 2 are shown in Fig. 5. The dark areas in the enamel of the polarized light microscope image [Fig. 5(a)] are decay that appears localized to the center of the fissure. In this case, the nonpolarized light image [Fig. 5(b)] better shows the areas of decay in the enamel and dentin. This image shows a dark pigmented area in the dentin localized to the center and expanding to the left along the DEJ. Microradiography, the gold standard, which directly measures changes in mineral content, was used to confirm the presence of decay in the dentin. There is also some demineralization expanding slightly to the right halfway through the enamel. These features are clearly visible in the enhanced OCT image of Fig. 2(b). Both the strong reflection from the subsurface lesion near the DEJ at the position of the red arrow and the demineralization in the enamel slightly to the right of the central fissure where optical penetration is completely blocked at the position of the yellow arrow are visible. Fig. 2OCT b-scans taken at the same fixed position on a tooth for which the subsurface lesion was not visible before application of VPS acquired (a) without and (b) with VPS. (c) and (d) OCT a-scans extracted at the position of the upper and lower red arrows. The green arrow shows the position of the center of the fissure where optical penetration is blocked, and the yellow arrow shows the position where deeper enamel demineralization is visible. 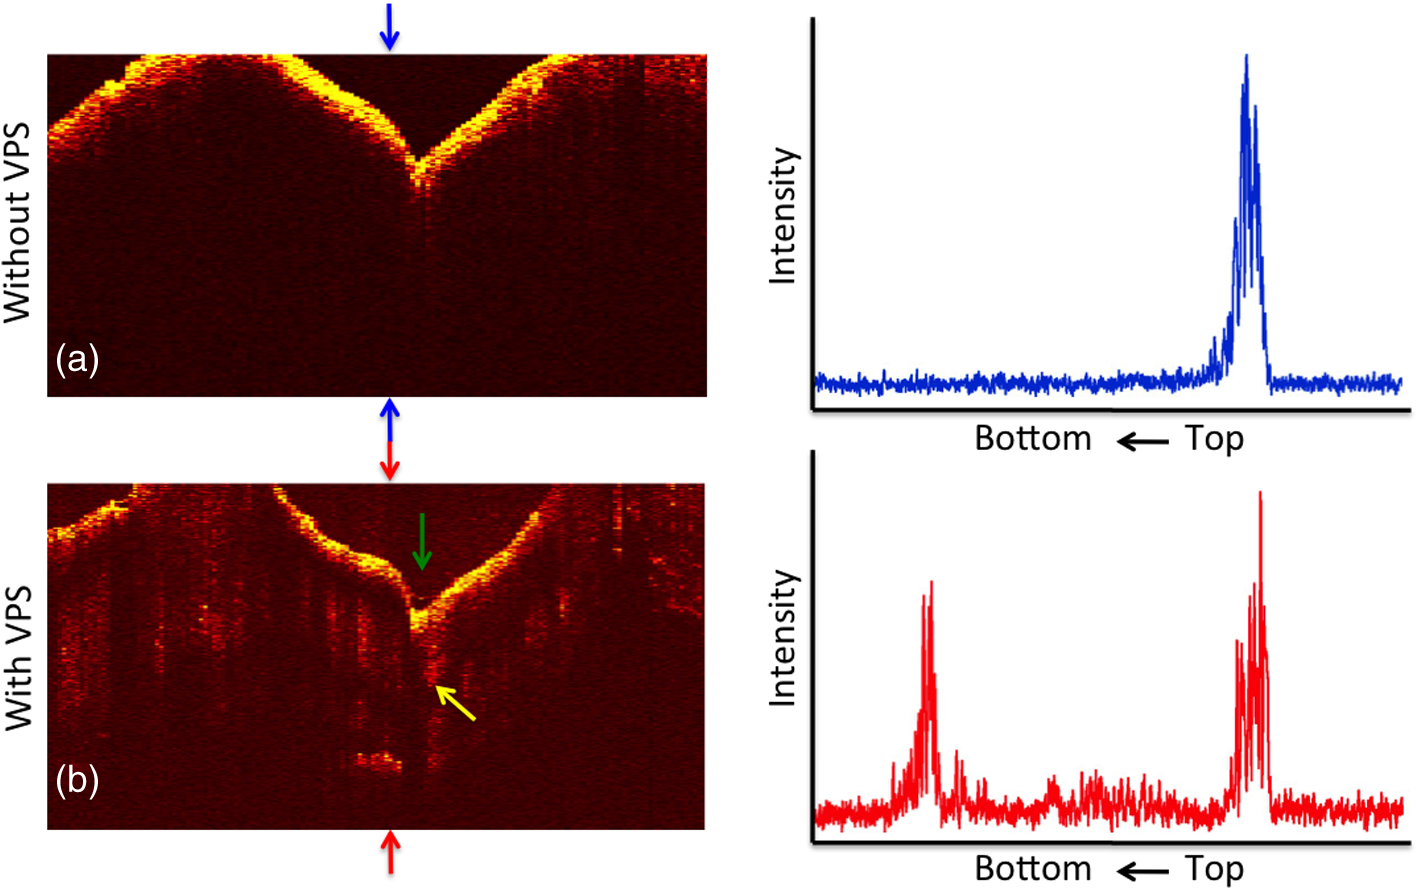 Fig. 3OCT b-scans taken at the same fixed position on a tooth in which the subsurface lesion was initially visible before application of VPS, acquired (a) without and (b) with VPS. (c) and (d) OCT a-scans extracted at the position of the upper and lower red arrows.  Fig. 4OCT b-scans taken at the same fixed position on a tooth in which no subsurface lesion was present, acquired (a) without and (b) with VPS. OCT a-scans extracted at the position of the upper and lower red arrows.  Fig. 5(a) Polarized and (b) nonpolarized light microscopy images acquired of tooth sections matching the position of the OCT scans shown in Figs. 2 and 4.  The b-scan images shown in Fig. 3 are for a lesion that was partially visible before application of the VPS. Initially, the amplitude of the subsurface lesion peak is less than half the amplitude of the surface peak; however, after applying VPS, the intensity of the second peak increases to more than twice the amplitude of the surface peak. The reflectivity from deeper layers within the tooth is more visible after adding VPS, and the DEJ has also become visible on the right side of the fissure. Another notable feature is that the separation of the surface and subsurface peaks () decreases significantly with the VPS. Figure 4 shows one sample that had a thin layer of surface demineralization that blocked optical penetration at the center of the fissure; however, there was no subsurface lesion. The increase in optical penetration after adding the VPS is very dramatic, and the DEJ becomes visible along the entire length of the b-scan. The surface (meniscus) of the VPS can be easily seen in Fig. 4(b) where it had pooled in the fissure. However, in the initial image the DEJ was only visible at the position of the arrow, and the intensity of the reflectivity of the DEJ at that position has a slightly higher intensity than the DEJ at other locations. Histological examination (Fig. 5) and microradiography confirmed there was no dentinal lesion present. In the OCT b-scan of Fig. 4(b), the DEJ in the areas directly peripheral to the fissure does not have a higher intensity than the DEJ at other positions further away from the fissure. Therefore, we anticipated that histology would not show a subsurface lesion for this tooth. We predicted that 9/10 of the lesions examined with OCT + VPS would have dentinal lesions. Histology and microradiography confirmed that 9/10 of the samples had a dentinal lesion and 1/10 did not (Fig. 4). Out of the nine samples with dentinal lesions, microradiography showed mineral loss in the area of the lesion in dentin for eight of the samples; one of the samples showed a slight increase in mineral density in the dentin (Fig. 2 sample). Microscopy showed that the dentin in the area of the lesion was discolored brown [see Fig. 5(b)—Fig. 2 sample] suggesting that the higher mineral content was due to the formation of reparative dentin. The values of and before and after application of VPS and the change in amplitude of the surface reflection are tabulated in Table 1. The increase in for the subsurface lesion peak or DEJ with the addition of the VPS was remarkable, increasing by almost 2000%. However, it is important to note that the magnitude of the enhancement should be viewed with caution since for some of the samples the second peak was not initially visible. Paired -tests indicated that for the subsurface peak and the lesion breadth increased significantly, and , respectively. The increase for the lesion depth was not significant, . Table 1Values for the integrated reflectivity (ΔR), the lesion depth and breadth, and the change in the magnitude of the surface reflection before and after application of VPS.
4.DiscussionPrevious in vitro and in vivo studies have shown that OCT can be used to show whether occlusal lesions have penetrated to the DEJ and spread laterally under the enamel.25,26 This suggests that OCT is ideally suited for the detection and diagnosis of QOCs. The requisite optical penetration/imaging depth for the detection and diagnosis of occlusal lesions is to the DEJ. If the lesion is present in the underlying dentin and the enamel above is sound, OCT often works quite well in resolving that lesion, and the images confirm penetration to the DEJ. If extensive demineralization is present from the enamel surface all the way down to the DEJ, the results are quite mixed, that is, sometimes the entire lesion is visible from the enamel surface to the DEJ, while more typically only the outer surface of the lesion is visible or the area where the lesion has reached the DEJ (lower part) can be seen. One limitation of radiography is that ionizing radiation is required; however, it is even more important to emphasize that the sensitivity of radiography to early occlusal lesions is poor and that by the time they show up on a radiograph they have typically spread extensively throughout the dentin and it is too late for nonsurgical intervention. Therefore, any method that increases the optical penetration in OCT images is valuable for the detection and diagnosis of occlusal caries lesions. This study shows that the use of optical clearing agents significantly increases the visibility of subsurface lesions located under sound enamel peripheral to the pits and fissures in the occlusal surface. In addition, as can be seen in Fig. 4, the visibility of the dentinal–enamel junction is also increased, which is potentially valuable for measuring the remaining enamel thickness for monitoring tooth wear and erosion. The excellent performance of the VPS impression material is particularly exciting because these impression materials have been used clinically for many years, and they are transparent, odorless, and tasteless. Therefore, they can be used immediately as optical clearing agents for clinical OCT imaging. Moreover, since the impression material hardens in place, it is easy to apply to upper teeth as well, by holding in place for 10 to 15 s while it hardens as is currently done with an impression tray. Polysiloxanes are used for intraocular lenses and dental impression materials, and the refractive index (RI) can be varied from 1.4 to 1.6 with RI increasing with the phenyl concentration. Commercially available diphenyl methyl siloxane copolymer has an RI close to that of dental enamel.39,40 Our results with a common dental transparent VPS impression material () show remarkable improvement in visibility of subsurface structures around the fissure. The higher performance of the lower RI VPS impression material () suggests that index matching is not the most important criterion for increasing optical penetration. Vinyl polysiloxane impression materials are designed for intimate contact with tooth surfaces for accurate impressions; therefore, they are hydrophilic and have a low enough viscosity to penetrate tooth fissures. With application of any agent with a RI greater than unity there is some distortion of the image since the optical path length is modified. One change was that the separation of the surface and subsurface peaks contracted somewhat. This can be explained by the optical distortion of the image by the agent and the greater visibility of the subsurface lesion closer to the tooth surface. One can easily envision how such an optical clearing agent such as VPS can be utilized clinically. After an initial scan of a suspect fissure using OCT those areas can be rescanned after application of the optical clearing agent to enhance the ability to detect the subsurface lesion either by revealing a subsurface reflection that was not visible without enhancement by the agent or by increasing the intensity of a very weak reflection for additional confirmation. AcknowledgmentsThis work was supported by the NIH/NIDCR Grant R01-DE17869. The authors would like to thank Zihan Zhu, Kenneth Chan, Jacob Simon, Robert Lee, and Michal Staninec for their help with this study. ReferencesDental Caries: The Disease and its Clinical Management, Blackwell, Oxford
(2003). Google Scholar
D. W. Boston,
“Incipient and hidden caries,”
Dent. Clin. N. Am., 49
(4), xi
–xii
(2005). http://dx.doi.org/10.1016/j.cden.2005.05.00110.1016/j.cden.2005.05.001 Google Scholar
D. Ricketts et al.,
“Hidden caries: what is it? Does it exist? Does it matter?,”
Inter. Dent. J., 47
(5), 259
–265
(1997). http://dx.doi.org/10.1002/idj.1997.47.issue-510.1002/idj.1997.47.issue-5 Google Scholar
A. Lussi et al.,
“Performance and reproducibility of a laser fluorescence system for detection of occlusal caries in vitro,”
Caries Res., 33
(4), 261
–266
(1999). http://dx.doi.org/10.1159/00001652710.1159/000016527 Google Scholar
X. Q. Shi, U. Welander and B. Angmar-Mansson,
“Occlusal caries detection with Kavo DIAGNOdent and radiography: an in vitro comparison,”
Caries Res., 34 151
–158
(2000). http://dx.doi.org/10.1159/00001658310.1159/000016583 Google Scholar
S. K. Makhija et al.,
“The prevalence of questionable occlusal caries: findings from the dental practice-based research network,”
J. Am. Dent. Assoc., 143
(12), 1343
–1350
(2012). http://dx.doi.org/10.14219/jada.archive.2012.009710.14219/jada.archive.2012.0097 Google Scholar
S. K. Makhija et al.,
“Characteristics, detection methods and treatment of questionable occlusal carious lesions: findings from the national dental practice-based research network,”
Caries Res., 48
(3), 200
–207
(2014). http://dx.doi.org/10.1159/00035484110.1159/000354841 Google Scholar
S. K. Makhija et al.,
“Twenty-month follow-up of occlusal caries lesions deemed questionable at baseline: findings from the national dental practice-based research network,”
J. Am. Dent. Assoc., 145
(11), 1112
–1118
(2014). http://dx.doi.org/10.14219/jada.2014.8210.14219/jada.2014.82 Google Scholar
J. D. Bader and D. A. Shugars,
“The evidence supporting alternative management strategies for early occlusal caries and suspected occlusal dentinal caries,”
J. Evid Based Dent. Pract., 6
(1), 91
–100
(2006). http://dx.doi.org/10.1016/j.jebdp.2005.12.00410.1016/j.jebdp.2005.12.004 Google Scholar
J. D. Bader, D. A. Shugars and A. J. Bonito,
“A systematic review of the performance of methods for identifying carious lesions,”
J. Public Health Dent., 62
(4), 201
–213
(2002). http://dx.doi.org/10.1111/jphd.2002.62.issue-410.1111/jphd.2002.62.issue-4 Google Scholar
B. E. Bouma and G. J. Tearney, Handbook of Optical Coherence Tomography, Marcel Dekker, New York, NY
(2002). Google Scholar
B. Colston et al.,
“Imaging of hard and soft tissue structure in the oral cavity by optical coherence tomography,”
Appl. Opt., 37
(19), 3582
–3585
(1998). http://dx.doi.org/10.1364/AO.37.00358210.1364/AO.37.003582 Google Scholar
F. I. Feldchtein et al.,
“In vivo OCT imaging of hard and soft tissue of the oral cavity,”
Opt. Express, 3
(3), 239
–251
(1998). http://dx.doi.org/10.1364/OE.3.00023910.1364/OE.3.000239 Google Scholar
A. Baumgartner et al.,
“Polarization-sensitive optical optical coherence tomography of dental structures,”
Caries Res., 34 59
–69
(2000). http://dx.doi.org/10.1159/00001657110.1159/000016571 Google Scholar
D. Fried et al.,
“Imaging caries lesions and lesion progression with polarization sensitive optical coherence tomography,”
J. Biomed. Opt., 7
(4), 618
–627
(2002). http://dx.doi.org/10.1117/1.150975210.1117/1.1509752 Google Scholar
R. S. Jones and D. Fried,
“The effect of high index liquids on PS-OCT imaging of dental caries,”
Proc. SPIE, 5687 34
–41
(2005). http://dx.doi.org/10.1117/12.60454910.1117/12.604549 Google Scholar
P. Ngaotheppitak, C. L. Darling and D. Fried,
“Polarization optical coherence tomography for the measuring the severity of caries lesions,”
Lasers Surg. Med., 37
(1), 78
–88
(2005). http://dx.doi.org/10.1002/(ISSN)1096-910110.1002/(ISSN)1096-9101 Google Scholar
H. Kang, C. L. Darling and D. Fried,
“Enhancing the detection of hidden occlusal caries lesions with OCT using high index liquids,”
Proc. SPIE, 8929 89290O
(2014). http://dx.doi.org/10.1117/12.2045681 Google Scholar
H. Kang, C. L. Darling and D. Fried,
“Enhanced detection of dentinal lesions in OCT images using the RKT transformation,”
Proc. SPIE, 9306 93060P
(2015). http://dx.doi.org/10.1117/12.208365410.1117/12.2083654 Google Scholar
V. V. Tuchin, Optical Clearing of Tissues and Blood, SPIE, Bellingham, WA
(2006). Google Scholar
D. Zhu et al.,
“Recent progress in tissue clearing,”
Laser Photonics Rev., 7
(5), 732
–757
(2013). http://dx.doi.org/10.1002/lpor.2013.7.issue-510.1002/lpor.2013.7.issue-5 Google Scholar
G. Jones, R. S. Jones and D. Fried,
“Transillumination of interproximal caries lesions with 830-nm light,”
Proc. SPIE, 5313 17
–22
(2004). http://dx.doi.org/10.1117/12.53928910.1117/12.539289 Google Scholar
C. L. Darling, G. D. Huynh and D. Fried,
“Light scattering properties of natural and artificially demineralized dental enamel at 1310-nm,”
J. Biomed. Opt., 11
(3), 034023
(2006). http://dx.doi.org/10.1117/1.220460310.1117/1.2204603 Google Scholar
S. M. Douglas, D. Fried and C. L. Darling,
“Imaging natural occlusal caries lesions with optical coherence tomograph,”
Proc. SPIE, 7549 75490N
(2010). http://dx.doi.org/10.1117/12.84934410.1117/12.849344 Google Scholar
M. Staninec et al.,
“Nondestructive clinical assessment of occlusal caries lesions using near-IR imaging methods,”
Lasers Surg. Med., 43
(10), 951
–959
(2011). http://dx.doi.org/10.1002/lsm.v43.1010.1002/lsm.v43.10 Google Scholar
J. M. Schmitt, S. H. Xiang, K. M. Yung,
“Speckle reduction techniques,”
Handbook of Optical Coherence Tomography, Marcel Dekker, New York, NY
(2002). Google Scholar
D. L. Marks, T. S. Ralston, S. A. Boppart,
“Data analysis and signal postprocessing for optical coherence tomography technology,”
Optical Coherence Tomography Technology and Applications, Springer, New York, NY
(2008). Google Scholar
J. Rogowska,
“Digital image processing techniques for speckle reduction, enhancement, and segmentation of optical coherence tomography (OCT) images,”
Optical Coherence Tomography: Principles and Applications, Elsevier, London
(2006). Google Scholar
Y. K. Lee and W. T. Rhodes,
“Nonlinear image processing by a rotating kernel transformation,”
Opt. Lett., 15
(23), 1383
–1385
(1990). http://dx.doi.org/10.1364/OL.15.00138310.1364/OL.15.001383 Google Scholar
J. Rogowska and M. E. Brezinski,
“Evaluation of the adaptive speckle suppression filter for coronary optical coherence tomography imaging,”
IEEE Trans. Med. Imaging, 19
(12), 1261
–1266
(2000). http://dx.doi.org/10.1109/42.89782010.1109/42.897820 Google Scholar
J. Rogowska and M. E. Brezinski,
“Image processing techniques for noise removal, enhancement and segmentation of cartilage OCT images,”
Phys. Med. Biol., 47
(4), 641
–655
(2002). http://dx.doi.org/10.1088/0031-9155/47/4/30710.1088/0031-9155/47/4/307 Google Scholar
R. C. Lee et al.,
“Automated assessment of the remineralization of artificial enamel lesions with polarization-sensitive optical coherence tomography,”
Biomed. Opt. Express, 5
(9), 2950
–2962
(2014). http://dx.doi.org/10.1364/BOE.5.00295010.1364/BOE.5.002950 Google Scholar
D. Lee, D. Fried and C. Darling,
“Near-IR multi-modal imaging of natural occlusal lesions,”
Proc. SPIE, 7162 71620X
(2009). http://dx.doi.org/10.1117/12.81686610.1117/12.816866 Google Scholar
C. Buhler, P. Ngaotheppitak and D. Fried,
“Imaging of occlusal dental caries (decay) with near-IR light at 1310-nm,”
Opt. Express, 13
(2), 573
–582
(2005). http://dx.doi.org/10.1364/OPEX.13.00057310.1364/OPEX.13.000573 Google Scholar
S. Chung et al.,
“Multispectral near-IR reflectance and transillumination imaging of teeth,”
Biomed. Opt. Express, 2
(10), 2804
–2814
(2011). http://dx.doi.org/10.1364/BOE.2.00280410.1364/BOE.2.002804 Google Scholar
J. Bush et al.,
“Cost effective all-fiber autocorrelator for optical coherence tomography imaging,”
in 17th Int. Conf. on Optical Fibre Sensors,
254
–257
(2005). Google Scholar
C. L. Darling et al.,
“An automated digital microradiography system for assessing tooth demineralization,”
Proc. SPIE, 7162 71620T
(2009). http://dx.doi.org/10.1117/12.81686810.1117/12.816868 Google Scholar
X. Hao et al.,
“High refractive index polysiloxane as injectable, in situ curable accommodating intraocular lens,”
Biomaterials, 33
(23), 5659
–5671
(2012). http://dx.doi.org/10.1016/j.biomaterials.2012.04.05210.1016/j.biomaterials.2012.04.052 Google Scholar
|
|||||||||||||||||||||||||||||||||||||||||||||||||||||||||||||||||||||||||||||||||||||||||||||||||||||||||||||||||||||||||||||||||||||||||||||||||||||||||||||||||||||||||||||||||||||||||||||||||||


