|
|
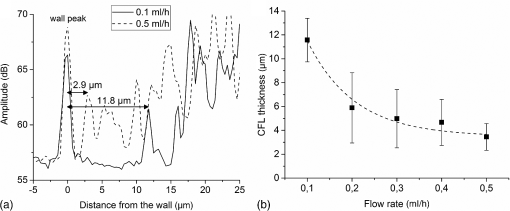
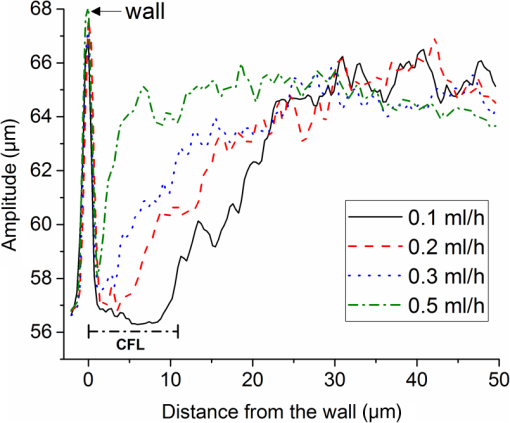
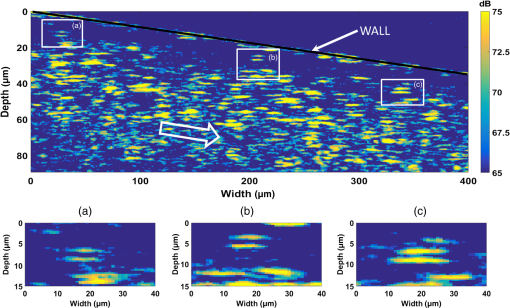
1.IntroductionMany of the common diseases such as diabetes and hypertension have an effect on the microcirculation and further on the rheological properties of blood flow. Deformable red blood cells (RBCs), suspended in plasma, make up of the total blood volume. Depending on various parameters such as diameter of the vessel, hematocrit, and flow rate, blood can form a plasma layer free of its cells near the wall. The cell-free layer (CFL) which consists mainly of plasma leads to a decreased apparent viscosity of blood. This effect is widely known as the Fåhraeus–Lindqvist effect. It is one of the major factors that contribute to the fluid resistance in the microcirculation and has been extensively investigated, especially in glass microchannels.1,2 The CFL thickness is in the range of a few microns making it challenging to measure. It is commonly measured by light microscopy employing high-speed cameras. Furthermore, to provide better sensitivity, especially in confocal microscopes, RBCs are often labeled with fluorescent markers.3,4 Labeling increases the complexity of a measurement preparation process and can have an influence on the flow properties. Recently, advanced computer algorithms were developed for analyzing images and defining the CFL thickness.5 In the case of high hematocrit levels, the microscopy images are highly distorted and have low contrast. RBCs located out of the focus plain can cause shading. Thus, it is difficult to accurately determine a width between a lumen boundary and an outermost edge of a concentrated RBC suspension in the core. Currently, high-speed optical coherence tomography (OCT) system has achieved axial resolutions of to visualize tissue at cellular level.6 An extremely high resolution enables new applications in the blood rheology including study of CFL and blood flow properties at the level of a single cell. Potential applications in blood monitoring also include measuring hemoglobin7 and glucose8 concentrations. The microflows have been extensively studied in complex vessels by Doppler OCT.9–13 The spatial distribution of RBCs in microchannels has been previously evaluated with OCT.14,15 Due to an insufficient axial resolution of the used OCT systems, the thickness of a CFL has not been measured previously. In this letter, for the first time, the application of the OCT technique for the estimation of the CFL thickness in blood flow is introduced and the evaluation of the spatial distribution of RBC next to the plasma layer is performed. Additionally, OCT images of blood flow at the level of a single RBC are presented. 2.Materials and MethodsAll of the procedures were performed according to the ethical policy of the University of Oulu. Blood samples taken from a healthy adult were collected in a tube which contained ethylenediaminetetraacetic acid as an anticoagulant. Prior to the measurements, RBCs were washed with phosphate buffered saline (PBS). For that purpose, whole blood was centrifuged 3 min at 3000 rpm. The top layer containing blood plasma, white blood cells, and platelets formed over RBCs was removed and the obtained RBC mass was diluted with PBS. This procedure was repeated two more times to wash out the blood plasma proteins causing uncontrollable aggregation. The obtained washed RBC mass was finally diluted with PBS to the hematocrit of 45% that is typical for the healthy adult male. Flow measurements were performed in a 100-mm long rectangular glass microchannel (VitroCom Ltd.) with an inner size of . A syringe pump (Fusion 100, Chemyx Inc.) was used to accurately control the flow rate. The angle between the microchannel surface and the vertically aligned probing beam was . The refractive index of water (1.33) was used to scale OCT images to real distances.16 All the measurements were performed at the room temperature of . The laboratory-built spectral domain OCT device17,18 employs an integrated supercontinuum light source (SuperK Extreme EXB-1, NKT Photonics). The spectrum range from 450 to 800 nm was used for imaging. An axial resolution was measured to be in air ( in water). The lateral resolution of the system determined by the focusing lens is . The custom-built spectrometer consists of a CMOS line-scan camera (Sprint spL4096-140 km, Basler). 2048 pixels at the center of the sensor are exposed. The effective A-line rate (axial scan rate) of the system is up to 123 kHz, corresponding to with the used data acquisition. A detailed description of the used system is given in Ref. 17. The raw interference spectra obtained from the spectrometer were first resampled from the wavelength domain to be equidistant in the frequency domain. Then a fixed pattern noise was removed by complex median-line subtraction.19 The Gaussian apodization was applied to the spectra to reduce the side lobes and improve image quality. Structural OCT images were obtained via Fourier transformation. 3.Results and DiscussionIn this study, OCT was applied to measure the CFL thickness in vitro with different flow rates. RBC suspension was mixed at the beginning of the experiments. The probing beam was set 5 cm from the inlet at the middle of the microchannel. Different CFL thicknesses were created at the top side of the microchannel by the use of gravity and sedimentation. The ratio of the gravitational forces and the lift forces20 was controlled by changing the flow rate from 0.1 to . At the lowest flow rate, sedimentation of RBCs caused formation of a thick CFL.21 It is known that CFL layer thickness is not constant and it is typically presented as an averaged distance from the wall.5,22 The reason for this is the particulate nature of blood flow where some of the RBCs slip along the microchannel surface and the other travel at various distances from the wall. Therefore, CFL thicknesses were determined by averaging 1000 A-scans and locating the wall and the first adjacent RBC surface [Fig. 1(a)]. The locations of the wall and the first RBC peaks and their distances were automatically determined by MATLAB® findpeaks-function. For the used flow rates, averages of 50 CFL thicknesses with standard deviations are shown in Fig. 1(b). From this figure it is seen that the CFL thickness decreases with the increasing flow rate and saturates at the level of . A large variation in the standard deviation can be observed. This indicates that the edge of the concentrated RBC suspension in the core is less uniform and RBCs are more dispersed. At the highest flow rate of , the CFL is around and can be reliably measured by OCT. Furthermore, due to the axial resolution of the used OCT setup, it is expected to be capable to quantify CFL layer thickness down to with high accuracy. Fig. 1CFL thickness estimation for 0.1 to . (a) Average amplitude profiles from 1000 depth scans and corresponding CFL thicknesses for 0.1 and . (b) Average from 50 thickness measurements for each flow rate with standard deviation. The exponential fit is shown as a dashed line ().  Backscattering intensity indicates an amount of scattering RBCs at a particular distance from the wall and thus it can be used for estimating the spatial distribution of RBC.14 However, it should be noted that due to the constant measurement time window at the extremely high spatial resolution, a direct comparison of the backscattering amplitude profiles between the flow rates can be imprecise. Due to the fast scanning speed, a probability to image single cell multiple times is increased. This can cause an overestimated spatial concentration profile at low flow rates. Figure 2 shows averaged backscattering amplitude profiles for four different flow rates. Each amplitude profile is an average from 50,000 A-scans. The peak located at the origin is a reflection from the glass wall–blood interface. At the flow rates of 0.1 to (Fig. 2), there is a slow increase of spatial distribution of RBCs after the PBS layer. At , the signal rapidly rises to the maximum level which indicates more uniform RBC distribution close to the wall. Simultaneous measurement of CFL and spatial distribution of RBCs at high hematocrit values are one of key benefits of OCT compared to the microscopy. Those parameters, in addition to flow speed and image data, can potentially be used to evaluate various pathological blood conditions. Fig. 2Averaged backscattering amplitude profiles at the wall. The RBC free layer (CFL) is best seen at the lowest flow rate.  Microscope images provide information about a CFL thickness only at the center plane of a microchannel. Compared to microscopic images, OCT can provide cross-sectional images of a microchannel from which CFL thickness could be estimated for the half of the perimeter. With confocal microscopy, it is possible to scan cross-sectional images. However, due to the moving cells, the cross-sectional image acquisition speed is too slow. A fast A-scan rate of OCT technique also enables measuring temporal changes in plasma layer thickness. In humans, normal healthy RBCs are elastic biconcave-shaped discs with diameters of to and a thickness at the thickest point of 2 to and a minimum thickness in the center of 0.8 to . These dimension, especially thickness, are too small to be visualized with the range of currently available OCT systems. The used OCT with a axial resolution is capable to image blood flow on the level of a single RBC. Figure 3 shows a cross-sectional image (B-scan) from blood flow along the microchannel. Colors depict the backscattering amplitude. The scale is compressed to highlight the peaks observed from RBC surfaces. The flow rate was and the direction of the flow is shown with the arrow in Fig. 3. The wall layer with a reduced amount of RBCs is clearly seen. There are several cells that flow right next to the channel wall. The three close-up images show single RBCs. The length of the cell, estimated from the OCT image, is about , which indicates elongation parallel to the flow direction. This can be due to the influences of shear flow and a limited lateral resolution of the measurement system. Also, a finite integration time can contribute to the elongation of a cell. We expect that two lines close to each other are coming from the upper and bottom surfaces of a cell. This hypothesis is made because the distance between these lines is in all of the close-up images. Due to the detection of individual cells, it enables further study, for instance, aggregation and deformability. In combination with the spectral analysis, this technique could be potentially used for an estimation of hemoglobin content in RBCs.7 4.ConclusionAn OCT system with a axial resolution was successfully applied to measure the CFL thicknesses in vitro in blood flow. The highest flow rate induced the minimum CFL thickness of which was accurately measured by the OCT system. The backscattering intensity signal was used to estimate the spatial distribution profile of RBCs next to the PBS layer. In addition, we presented a cross-sectional image of blood flow at the level of a single cell. The outcome of this study shows excellent potential of the axial resolution OCT technique in blood flow characterization. It enables a method to study and analyze various blood abnormalities in vitro and with the further possibility to expand the proposed technique for in vivo applications. AcknowledgmentsThe study was supported by the Academy of Finland project: Rheological Properties of Complex Fluids, Grant No. 266937. ReferencesA. S. Popel and P. C. Johnson,
“Microcirculation and hemorheology,”
Annu. Rev. Fluid Mech., 37
(1), 43
–69
(2005). http://dx.doi.org/10.1146/annurev.fluid.37.042604.133933 ARVFA3 0066-4189 Google Scholar
S. Kim et al.,
“The cell-free layer in microvascular blood flow,”
Biorheology, 46
(3), 181
–189
(2009). http://dx.doi.org/10.3233/BIR-2009-0530 BRHLAU 0006-355X Google Scholar
Y. Sugii et al.,
“Velocity measurement of both red blood cells and plasma of in vitro blood flow using high-speed micro PIV technique,”
Meas. Sci. Technol., 16
(5), 1126
–1130
(2005). http://dx.doi.org/10.1088/0957-0233/16/5/011 MSTCEP 0957-0233 Google Scholar
B. Namgung, L. Liang, S. Kim,
“Physiological significance of cell-free layer and experimental determination of its width in microcirculatory vessels,”
Visualization and Simulation of Complex Flows in Biomedical Engineering, 75
–87 Springer, Netherlands
(2014). Google Scholar
S. Kim et al.,
“A Computer-based method for determination of the cell-free layer width in microcirculation,”
Microcirculation, 13
(3), 199
–207
(2006). http://dx.doi.org/10.1080/10739680600556878 MCCRD8 0275-4177 Google Scholar
L. Liu et al.,
“Imaging the subcellular structure of human coronary atherosclerosis using micro-optical coherence tomography,”
Nat. Med., 17
(8), 1010
–1014
(2011). http://dx.doi.org/10.1038/nm.2409 1078-8956 Google Scholar
F. E. Robles, S. Chowdhury and A. Wax,
“Assessing hemoglobin concentration using spectroscopic optical coherence tomography for feasibility of tissue diagnostics,”
Biomed. Opt. Express, 1
(1), 310
–317
(2010). http://dx.doi.org/10.1364/BOE.1.000310 BOEICL 2156-7085 Google Scholar
H. Ullah et al.,
“Autocorrelation optical coherence tomography for glucose quantification in blood,”
Laser Phys. Lett., 12
(12), 125602
(2015). http://dx.doi.org/10.1088/1612-2011/12/12/125602 1612-2011 Google Scholar
M. Bonesi et al.,
“Turbulence monitoring with Doppler optical coherence tomography,”
Laser Phys. Lett., 4
(4), 304
–307
(2007). http://dx.doi.org/10.1002/lapl.200610098 1612-2011 Google Scholar
M. Bonesi, D. Churmakov and I. Meglinski,
“Study of flow dynamics in complex vessels using Doppler optical coherence tomography,”
Meas. Sci. Technol., 18
(11), 3279
–3286
(2007). http://dx.doi.org/10.1088/0957-0233/18/11/003 MSTCEP 0957-0233 Google Scholar
D. M. Bukowska et al.,
“Assessment of the flow velocity of blood cells in a microfluidic device using joint spectral and time domain optical coherence tomography,”
Opt. Express, 21
(20), 24025
–24038
(2013). http://dx.doi.org/10.1364/OE.21.024025 OPEXFF 1094-4087 Google Scholar
A. V. Bykov et al.,
“Doppler OCT imaging of cytoplasm shuttle flow in Physarum polycephalum,”
J. Biophotonics, 2
(8–9), 540
–547
(2009). http://dx.doi.org/10.1002/jbio.v2:8/9 Google Scholar
J. Lauri et al.,
“Experimental study of the multiple scattering effect on the flow velocity profiles measured in intralipid phantoms by DOCT,”
Laser Phys., 21
(4), 813
–817
(2011). http://dx.doi.org/10.1134/S1054660X11070164 Google Scholar
J. Moger et al.,
“Measuring red blood cell flow dynamics in a glass capillary using Doppler optical coherence tomography and Doppler amplitude optical coherence tomography,”
J. Biomed. Opt., 9
(5), 982
–994
(2004). http://dx.doi.org/10.1117/1.1781163 JBOPFO 1083-3668 Google Scholar
P. Cimalla et al.,
“Shear flow-induced optical inhomogeneity of blood assessed in vivo and in vitro by spectral domain optical coherence tomography in the wavelength range,”
J. Biomed. Opt., 16
(11), 116020
(2011). http://dx.doi.org/10.1117/1.3653235 JBOPFO 1083-3668 Google Scholar
O. Zhernovaya et al.,
“The refractive index of human hemoglobin in the visible range,”
Phys. Med. Biol., 56
(13), 4013
–4021
(2011). http://dx.doi.org/10.1088/0031-9155/56/13/017 PHMBA7 0031-9155 Google Scholar
J. Czajkowski et al.,
“Characterization of ink-jet printed RGB color filters with spectral domain optical coherence tomography,”
Proc. SPIE, 8493 849308
(2012). http://dx.doi.org/10.1117/12.929681 PSISDG 0277-786X Google Scholar
J. Lauri et al.,
“Measuring flow dynamics in a microfluidic chip using optical coherence tomography with axial resolution,”
Flow Meas. Instrum., 43 1
–5
(2015). http://dx.doi.org/10.1016/j.flowmeasinst.2015.02.001 FMEIEJ 0955-5986 Google Scholar
S. Moon, S. Lee and Z. Chen,
“Reference spectrum extraction and fixed-pattern noise removal in optical coherence tomography,”
Opt. Express, 18
(24), 24395
–24404
(2010). http://dx.doi.org/10.1364/OE.18.024395 OPEXFF 1094-4087 Google Scholar
T. M. Geislinger and T. Franke,
“Hydrodynamic lift of vesicles and red blood cells in flow—from Fåhræus & Lindqvist to microfluidic cell sorting,”
Adv. Colloid Interface Sci., 208 161
–176
(2014). http://dx.doi.org/10.1016/j.cis.2014.03.002 ACISB9 0001-8686 Google Scholar
V. V. Tuchin, X. Xu and R. K. Wang,
“Dynamic optical coherence tomography in studies of optical clearing, sedimentation, and aggregation of immersed blood,”
Appl. Opt., 41
(1), 258
–271
(2002). http://dx.doi.org/10.1364/AO.41.000258 APOPAI 0003-6935 Google Scholar
S. Kim et al.,
“Temporal and spatial variations of cell-free layer width in arterioles,”
Am. J. Physiol., 293
(3), H1526
–H1535
(2007). http://dx.doi.org/10.1152/ajpheart.01090.2006 AJPHAP 0002-9513 Google Scholar
|


