|
|
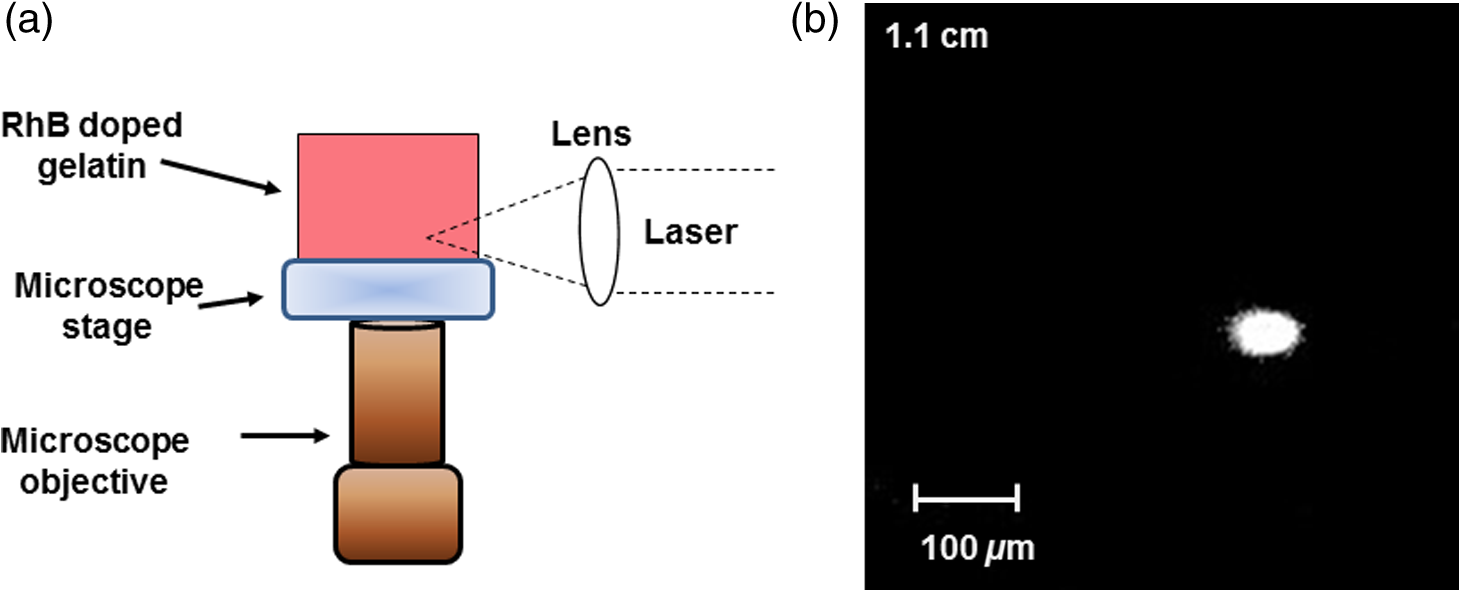
1.IntroductionOptical spectroscopic techniques have become powerful tools for disease diagnosis and surgical guidance over the past several decades, with numerous spectroscopic chemical imaging methods being employed for the real-time monitoring of both endogenous biomarkers as well as exogenous contrast agents.1–5 Nevertheless, a major challenge in using optical techniques for many tissue diagnostics is the concurrent need for improved spatial resolution and deeper penetration depths, particularly for subsurface imaging applications.1 A wide variety of laser spectroscopic methods have been developed over the past several decades that are capable of obtaining chemical images of samples with spatial resolutions ranging from microns to a few tens of nanometers depending on the transduction method employed as well as the depth at which the measurement is made.3–13 However, the techniques that provide spatial resolution in the micron and submicron regime (e.g., fluorescence, optical coherence tomography, and so on) are generally limited to obtaining images at depths of hundreds of microns or less. This limitation is typically due to either strong absorption of the excitation light or scattering of either the excitation or emitted light. In the case of conventional fluorescence imaging, ultraviolet or visible wavelengths are often required to have sufficient energy to excite various chemical species being interrogated. Because of this limitation in excitation wavelengths and the strong broadband absorption properties of tissues in the ultraviolet and short-wavelength visible region of the electromagnetic spectrum, such diagnoses are generally restricted to layers of tissue below the surface, thereby limiting the applicability of such analyses to surface tissues. To increase the useful penetration depth of fluorescent tissue imaging, significant research efforts in the development and application of near-infrared (NIR) absorbing exogenous dyes (i.e., contrast agents) have grown.14 These dyes take advantage of the significantly greater penetration depths associated with NIR excitation light, due to minimal absorption over the optical diagnostic window ( to 1100 nm). Unfortunately, scattering of both the excitation light as well as the emitted fluorescent light from the dye still limits the ability to obtain high resolution (i.e., cellular level) chemical images at significant depths in most cases, limiting the use of such methods primarily to general diagnostics. Furthermore, issues associated with dye localization (i.e., targeting) in living tissues, toxicity, and photobleaching have also presented significant challenges in this promising field. An alternate approach that has seen some limited success in obtaining high-resolution subsurface chemical images of tissue is multiphoton fluorescence, which has been employed by several groups15–18 for tumor demarcation and bioimaging.19 In this case, excitation light in the NIR is used to excite ultraviolet and visible absorbing chromophores in a highly localized excitation volume,20 minimizing both background luminescence and sample damage due to photobleaching.21 Additionally, the use of excitation light in the NIR optical diagnostic window allows for significant depth of penetration while allowing for excitation of chemical species at the focal point that would typically exhibit single-photon absorption at approximately twice the energy (i.e., 325 to 550 nm). Consequently, this allows for excitation of most endogenous chromophores in tissues at significantly greater depths (millimeters to centimeters) than are possible via single-photon excitation. While this highly localized “deep” tissue excitation has found some applications, its ability to be used for high-resolution subsurface imaging has been greatly hampered by both the absorption of the resulting visible fluorescence prior to exiting the tissue surface as well as the significant background two-photon fluorescence generated at the tissue-air interface,22 which has been demonstrated to ultimately limit the depth at which such analyses can be performed due to signal to noise/background limitations.23 To overcome the limitations associated with signal loss following NIR two-photon excitation of tissues, the application of photoacoustic detection as the means of signal transduction has been developed over the past decade for subsurface analyses.24,25 Unlike single-photon absorption-based photoacoustic imaging in tissues, which relies primarily on excitation of oxygenated and deoxygenated hemoglobin for tissue contrast due to hemoglobin’s red-shifted absorption (compared to most endogenous chromophores),26–34 the use of nonresonant, two-photon absorption results in both a localized excitation as well as the ability to effectively excite species that typically absorb UV or visible light.35–39 Furthermore, since photoacoustic detection relies on nonradiative relaxation and quantum yields for endogenous chromophores are typically for even the most fluorescent species,40 the resulting ultrasonic wave generated represents the majority of the energy absorbed and suffers from minimal attenuation over the distances excited by NIR light, making it an extremely sensitive technique. In this paper, we demonstrate the potential of multiphoton photoacoustic spectroscopy for differentiating between healthy and malignant (grade III astrocytoma) brain tissues, based on blind studies from multiple excised, flash frozen human brain tissue matched pair samples. These samples were independently classified as healthy or malignant via histopathology for comparison. In addition, characterization of the spatial resolution and maximum subsurface analysis depth achievable using this multiphoton photoacoustic technique at ANSI safe laser fluences is determined using well-characterized tissue phantoms, with optical scattering properties consistent with brain tissues. 2.Experimental Methods2.1.Chemicals and Materials2.1.1.Tissue samplesTwelve matched pairs of excised, grade III astrocytoma, and adjacent healthy brain tissue biopsy samples from 12 different patients were purchased from Asterand PLC and employed for training and blind studies. Tissue samples were purchased as snap frozen samples, thick, and stored at . Prior to photoacoustic analysis, they were slowly warmed to room temperature under ambient conditions. 2.1.2.ChemicalsGelatin from bovine skin (type B) was purchased from Sigma-Aldrich Inc. and used to make gelatin tissue phantoms. Double distilled and deionized water was used for all solutions in gelatin tissue phantom preparation. Rhodamine B (RhB) was also purchased from Sigma-Aldrich Inc. and used without further purification. Alumina () particles ( diameter) were purchased from Baikowski Int. Corp. Acoustic coupling gel (Aquasonic 100, Parker Lab Inc., New Jersey) was used to couple the piezoelectric transducer to the samples for photoacoustic analyses. 2.2.Sample/Gelatin Phantom PreparationPreparation of gelatin tissue phantoms was performed by mixing bovine-derived gelatins with particles (to mimic the optical scattering properties of brain tissues) as well as RhB. RhB was used during characterization studies as a model compound and with samples prepared from a common stock solution. A stock solution of RhB was prepared by adding 0.2395 g of RhB to 500 mL of double distilled and deionized water. Lower concentration solutions, ranging from to , were then subsequently prepared from this stock to generate RhB-doped gelatins of various concentrations. To provide optical scattering properties comparable to the worst case frontal lobe brain tissue (i.e., reduced scattering coefficients of ranging from 20 to ),41 0.01% (w/w) of diameter was added to the 50-mL RhB solution prior to mixing with bovine gelatin, resulting in gelatins with reduced scattering coefficients of 38 to . For resolution and depth penetration studies, 3.0 g of gelatin was added to each of the 50-mL RhB solutions while stirring and heating to 90°C. After the gelatin was completely mixed in the solution, the mixtures were poured into 0.5- or 0.1-cm-thick aluminum molds to gel. In addition, various thickness blank gelatins (having scatterers but without dye embedded into them) were also created via the same procedure. Following extraction of the solid gelatins, their thicknesses and uniformity were verified via optical microscopy. 2.3.Multiphoton Photoacoustic Measurement SystemMultiphoton photoacoustic measurements were performed using the laboratory-based system shown in Fig. 1. A nanosecond (i.e., ) pulsed, β-barium oxide (BBO)-based optical parametric amplifier (OPA; Opotek Inc., Vibrant B), pumped by the third harmonic of an Nd:YAG laser, with maximum output energy of (10 Hz), was used as the excitation source. This allowed for continuous spectral tuning over the diagnostic window from 700 to 1100 nm. Reduction of power, from the maximum to the ANSI tissue safe levels employed, was achieved by detuning the q-switch of the pump Nd:YAG laser. To ensure complete removal of any of the visible signal beam from the OPA, an external 680-nm long-pass filter was employed in addition to the internal beam selection optics. This 680-nm long-pass filter removed any residual bleed-through of visible signal beam and second and third harmonics from the Nd:YAG laser that escape the OPA housing without reducing the output power of the idler beam below the tissue safe powers used in the various experiments. The resulting laser beam was then focused via an lens onto the tissue sample, which was located on top of a nonfocused, broadband 1.0-MHz ceramic piezoelectric transducer (0.5-in. diameter; Panametrics Inc.) used for acoustic detection. Using an unfocused transducer, negligible biasing of the magnitude of the measured signal due to position of the generated ultrasonic wave occurred. Furthermore, the small size of the biopsied samples (i.e., ) makes the use of a focused transducer unnecessary, due to minimal signal loss. A 1-MHz center frequency broadband transducer was employed because of its availability and reasonable response following sample excitation with a 5-ns laser pulse. The output of the piezoelectric transducer was then coupled to a 500-MHz digital oscilloscope that was triggered by a fast photodiode monitoring the laser firing events. Generation of the optical trigger was performed by placing a glass microscope slide in the laser beam, allowing the minimal reflection off the slide to illuminate the fast photodiode. By employing a glass microscope slide as the beam splitter for triggering, minimal power is lost from the sample excitation beam while generating a measurable signal to monitor the relative laser power from pulse-to-pulse and ensure that only signals generated from excitation pulses greater than the threshold needed for two-photon excitation were signal averaged. To account for pulse-to-pulse variability in the laser power output, as well as to improve the signal-to-noise ratio of the measurements, acoustic signals corresponding to 300 excitation events were averaged for each wavelength analyzed in these studies. Although pulse-to-pulse normalization of the photoacoustic signals based on the measured laser powers is possible, it was found that after averaging 300 pulses, such normalization was unnecessary since it provided negligible difference to the average signals. 2.4.Multiphoton Fluorescence SystemMultiphoton fluorescence analyses were performed with the same OPA laser used for excitation and an inverted epifluorescence microscope (Nikon Eclipse TE2000-S) equipped with an intensified charge-coupled device (ICCD; Roper Scientific, Model PI-MAX) for signal collection. Filtering of the fluorescent light was performed using a standard Nikon rhodamine filter cube in the typical arrangement. The angle of the excitation beam with respect to the sample and microscope stage varied depending upon whether penetration depth or longitudinal resolution studies were being performed [details of the excitation angle are discussed in Sec. 3 for each study along with schematic diagrams, depicting the two-photon excited fluorescent measurement systems employed; Figs. 3(a) and 4(a)]. 3.Results and Discussions3.1.Brain Tissue DifferentiationIn order to demonstrate the potential of multiphoton photoacoustic spectroscopy for rapidly differentiating between healthy and malignant brain tissues, analysis of 12 pairs of biopsied, flash frozen, human brain tissue samples was performed and the results were compared to independent histopathology results. These matched tissue pairs were acquired from Asterand PLC and came from 12 different patients of varying age and race, with each pair consisting of one malignant astrocytoma (grade III) biopsy sample, and one neighboring healthy tissue biopsy sample from the frontal lobe of the same patient for comparison. Analysis of the samples was performed by placing the particular excised tissue sample of interest on top of a broadband piezoelectric transducer with acoustic coupling gel. In order to ensure effective coupling of the acoustic signals to the transducer, the sample was gently rubbed in the gel with tweezers to reduce the presence of any air bubbles in the coupling gel between the sample and transducer. Once the sample was positioned, the filtered, NIR output of the OPA was focused into the center of the tissue using an biconvex lens, perpendicular to the transducer’s surface to ensure that the signal generated was due to absorption by the tissue and not interaction of the excitation light with the transducer itself. The resulting photoacoustic signals were collected by the transducer and averaged on a digital oscilloscope, with the output of 300 laser shots being averaged for each excitation wavelength to account for shot-to-shot laser power fluctuations, while also improving the signal-to-noise ratio of the measurements. Although this resulted in data acquisition times of several seconds at each wavelength using the Q-switched OPA employed in these studies, the use of comparable kHz or MHz mode-locked excitation sources (e.g., topaz prime OPA; light conversions, and so on) should allow for achievement of subsecond analysis times that would be required for in-vivo analyses. Figure 2(a) shows typical reconstructed two-photon induced, photoacoustic spectra from one of the malignant grade III astrocytoma tissue samples (solid circles) and it is corresponding matched healthy tissue (open circles). Excitation wavelengths from 740 to 1100 nm were used to cover the optical diagnostic window in the NIR without providing significant excitation of hemoglobin via one photon excitation, which occurs primarily at wavelengths below 740 nm. Additionally, excitation powers (power densities) were kept at 20 mW for these measurements, well below ANSI specified tissue safe limits, to demonstrate this technique’s potential for future in-vivo applications. Fig. 2(a) Representative multiphoton photoacoustic spectra of grade III astrocytoma tumor tissue (solid dots) and healthy (open circles) brain tissue. (b) Excitation power dependent photoacoustic signal response. (c) Photoacoustic spectra of same healthy (solid circles) and tumor (open circles) tissue samples obtained with 1-mW laser power. (d) Average ratiometric signals at the wavelength ratios of 740 nm:1100 nm and 970 nm:1100 nm for healthy (H) and tumor (T) tissues. Error bars represent 90% confidence limits.  To verify that the signals generated were due to two-photon absorption, as opposed to weakly absorbing single-photon absorption events, laser power studies were performed for each tissue sample, revealing a quadratic power dependence, indicative of two-photon absorption. Figure 2(b) shows a typical excitation power-dependent photoacoustic signal response for a grade III astrocytoma sample excited at 750 nm, with data points representing the experimental results and the dotted fit showing a clear quadratic power dependence. The equation for the best fit quadratic curve was found to be , revealing a value of 2.3 for the power dependence. This value is typical for all of the tissue samples (between 740 and 1050 nm), with power dependences decreasing to a minimum of 1.4 for excitation wavelengths . This reduction in the order of the power-dependent term at these longer wavelengths is suggestive of the fact that at longer wavelengths, there are reduced contributions from two-photon absorbers and the increased single-photon absorption by water at wavelengths between 1050 and 1100 nm begins to start dominating. This would also explain why both healthy and malignant tissue samples show relatively similar intensities in this wavelength range. In addition to ensuring the quadratic power dependence of the signals at each wavelength, temporal filtering of the acquired signal was also performed, as described previously,35 restricting the potential for single-photon induced interferences from other locations throughout the sample (e.g., the sample surface where potential nonlinear effects can occur) from contributing to the measured signal. Further verification of the two-photon induced origin of the spectra shown in Fig. 2(a) was demonstrated by performing the same analyses on the same tissue samples while exciting them with laser powers incapable of promoting measurable two-photon signals. Figure 2(c) shows an example of such measurements for typical healthy (solid circles) and malignant (open circles) tissue samples following excitation with 1-mW excitation power. This excitation level is below the threshold needed for measurable two-photon excitation of the tissues (), as seen from the power dependence curve in Fig. 2(b). At excitation powers , a linear power-dependent fit provides a reasonable estimation of the power dependence. From Fig. 2(c), no significant difference between the spectral response between the healthy and malignant tissue sample can be observed. In addition, the signals are significantly weaker than those seen in Fig. 2(a) and reveal the opposite spectral trend, with the largest signals occurring at the longer wavelengths (i.e., ). This is what might be expected from such single-photon excited measurements in excised (nonblood perfused) tissues where water absorption would dominate at wavelengths between 1050 and 1100 nm. Based on the two-photon excited tissue spectra in Fig. 2(a), a clear difference can be seen between the healthy and malignant tissue samples at the short-wavelength NIR excitation (i.e., 740 nm) region, with the endogenous chromophores in the malignant tissues providing significantly greater absorption than the healthy tissue. However, at longer wavelengths (i.e., 1100 nm), the signals from the two different matched samples (i.e., healthy and malignant) are statistically the same. This same trend was found to exist in all 12 of the matched tissue pairs, with the short wavelength NIR resulting in significantly greater signals for the malignant tissues than in their corresponding matched healthy tissue. In addition, in every case, a relatively narrow band at 970 nm was found to exist (quadratic power term at 970 nm was found to be ) for the malignant tissue and not the healthy tissue samples. Although the exact chemical species responsible for generating these differential signals is unknown (and beyond the scope of this manuscript), the significant increase in two-photon absorption at 740 nm for the malignant tissues, relative to the healthy tissues, could potentially be due to differences in the oxidation state of various endogenous biochemical species, such as flavins. Such species would provide significant two-photon absorption in this wavelength region and have been previously demonstrated in cellular studies to exhibit significantly altered levels between healthy and malignant cells.42,43 Furthermore, as the two-photon excitation wavelength approaches 1100 nm, the number of potential endogenous absorbers dramatically decreases, resulting in a reduced two-photon photoacoustic signal for both healthy and malignant tissue samples and similar magnitude signals at these longer wavelengths. Since the absolute magnitude of the photoacoustic signals is largely dependent on optical and acoustic scattering within the sample as well as the acoustic coupling of the sample to the transducer, ratiometric analysis of signals taken at 740, 970, and 1100 nm was evaluated to more reliably distinguish between the healthy and malignant brain tissues based on endogenous chemical differences. Statistical results from these ratiometric analyses are shown in Fig. 2(d), with each of the dozen matched pair tissue samples being analyzed three times by different individuals. Each bar in Fig. 2(d) represents the average of these 36 replicate analyses on either healthy or malignant tissue with the error bars corresponding to the 90% confidence interval. The 740:1100 nm ratio, for the malignant tissue samples, was found to have a value of , while the healthy tissue samples provided a value of , clearly demonstrating a statistical difference between the two tissue types (with greater than 90% confidence) based on this single two wavelength analysis. Furthermore, if a ratiometric analysis of the two-photon photoacoustic signals following 970:1100 nm excitation is performed, distinct statistical differences are also found to exist, with malignant tissues resulting in a ratio of and the healthy tissue samples corresponding to . These results demonstrate a clear ability to distinguish between the excised, flash frozen tissues with a simple ratiometric analysis, offering a great potential for rapidly distinguishing biopsy samples and possibly allowing for a rapid diagnosis and surgical guidance tool that could one day be used in vivo. In addition, since the 970-nm band is well separated from the shorter wavelength of 740-nm band, it is likely that the biochemical specie(s) responsible for the differential absorption at these two wavelengths are two (or more) different biomarkers. If these two biomarkers are not related by a common biochemical reaction/signaling pathway within the tissue, they would represent two independent measures for differentiation, each with certainty, resulting in a combined certainty of greater than 99% for tissue diagnoses based on only three measurements. Following determination of the ratiometric thresholds for classification of the excised tissue samples, blind studies were performed to evaluate the comprehensive variability of sample-to-sample as well as analyst-to-analyst. In these studies, the same 12 matched pair samples used for determining the ratiometric thresholds were measured a total of 125 times by four different individuals. Using a two-wavelength discrimination analysis ratio at 740:1100 nm, the tissue sample was correctly classified as either healthy or malignant 123 out of 125 times based on these 90% confidence intervals and asking the corresponding question, “is this representative of a grade III astrocytoma?”. In the two cases that failed to provide an accurate classification, based on this analysis, measured signals were extremely weak for the entire spectrum and resulted in ratios of 15.4 and 14.7, which are still well above the 90% threshold value for healthy tissues, but outside of the 90% confidence interval for classification as grade III astrocytoma. Similarly, using the 970:1100 nm ratio, the tissue samples were correctly identified 118 out of 125 times, using the same discrimination criteria, with the seven inaccurately classified samples providing ratios of 4.3, 4.6, 4.1, 4.6, 4.4, 4.4, and 4.8, falling just outside of the 90% confidence interval for classification as grade III astrocytoma, but all again falling outside of the 90% confidence interval for healthy tissue classification. In fact, for all blind analyses, both the 740:1100 nm ratio and the 970:1100 nm ratio, the malignant tissues were classified as “not healthy” (i.e., a ratio of for 740:1100 nm ratio or for 970:1100 nm ratio) for all 125 measurements. Furthermore, if both ratios were employed for blind studies and when either ratio (i.e., 740:1100 nm or 970:1100 nm) provided a result within the 90% confidence interval for malignant tissue classification, it was classified as malignant, and the study correctly identified all of the 125 samples. Although more refined threshold values and classification algorithms would need to be developed before clinical application of such a technique, including the introduction of additional astrocytoma grade and neoplastic tissues as well as in-vivo tissue training sets for potential future in-vivo classifications, the results from these blind studies demonstrate a great potential for the rapid differentiation of healthy and advanced stage (i.e., grade III) astrocytoma tissue using two-photon photoacoustic spectroscopy. 3.2.Probing Depth and Axial Spatial ResolutionTo further characterize the potential of multiphoton photoacoustic spectroscopy for subsurface tissue diagnostics and imaging, penetration depth and spatial resolution studies were performed on gelatin tissue phantoms. In these studies, gelatin tissue phantoms doped with 0.01% (w/w) , to provide optical reduced scattering coefficients comparable to frontal lobe brain tissues over the red and NIR spectral region (i.e., ), were fabricated and employed. These gelatin phantoms were prepared by homogenously dispersing micromolar concentration solutions of RhB and the throughout gelatin slabs prior to gel formation in a process previously described.44,45 To provide different thickness samples, aluminum molds of precise thicknesses ranging from 1 mm to 2 cm, in 1-mm increments, were used. Once the gelatins had set, their scattering properties over the optical diagnostic window were verified by optical scattering measurements,44 to have reduced scattering coefficients between 38 and , representative of the high end of reduced scattering coefficients for frontal lobe brain tissues. Since the maximum depth of penetration into tissues for multiphoton photoacoustic spectroscopy using NIR excitation light in the optical diagnostic window is limited by the optical scattering of the sample (not the absorption by the tissue or the propagation of the ultrasonic signal generated),15,22,23 multiphoton fluorescence studies were performed to determine the maximum depth at which subsurface tissue analyses could be performed using tissue safe laser powers. Unlike two-photon excited fluorescence, the ultrasonic signal generated from the nonradiative relaxation exhibits minimal attenuation over the optical probing depth, limiting the analysis only to the depth at which significant two-photon absorption can occur at tissue safe powers. In these studies, the rhodamine-embedded gelatin tissue phantoms were placed on an inverted microscope stage and illuminated from above via the OPA [as shown in Fig. 3(a)]. Due to physical constraints associated with the microscope, the OPA beam was brought in at angle relative to the perpendicular to the stage. The OPA was focused via an lens onto the bottom side of the sample (i.e., -plane of the microscope stage), at the same height as the focal plane of the microscope objective. Aligning the OPA’s focus and the microscope’s image plane to the lower surface of the gelatin insured that the entire thickness of the gelatin was traversed prior to excitation, while also reducing scatter of the resulting fluorescent light. Simply by replacing one gelatin phantom for a different thickness gelatin phantom and monitoring the resulting two-photon excited fluorescence, the maximum excitation depth possible via two-photon excitation (using tissue safe powers), as well as the axial spatial resolution of the measurement system, was determined. While the exact maximum measurement depth for every chemical species will be different depending on its absorption coefficient and concentration within the tissue, the use of rhodamine as a model compound at micromolar concentrations provides a similar two-photon absorption cross-section to many of the dominate endogenous chromophores in tissue and at comparable or lower concentrations than the endogenous chromophores. Furthermore, it allows for visualization of the two-photon excitation volume in the axial dimensions, providing a conservative measure of the multiphoton photoacoustic excitation volume at different depths within the sample. Fig. 3(a) Schematic diagram depicting the excitation system used for maximum penetration depth and axial spatial resolution studies. (b) Two-photon excited fluorescence images obtained from RhB doped gelatin tissue phantoms obtained at different depths. (c) Two-photon excited fluorescence image of RhB doped gelatin tissue with an thick brain tissue overlayer.  Two-photon excitation of the rhodamine B was performed using 20 mW, 1050-nm laser pulses (), corresponding to power densities of . One thousand fifty nanometers corresponds to the two-photon absorption maximum for rhodamine B. The resulting fluorescence emission was filtered with a standard Nikon rhodamine filter cube (mounted in a Nikon TE2000 epifluorescent microscope) and imaged using the fluorescence microscopic imaging system described previously. Measurements were then made for gelatins ranging in thickness from 1 mm to 1.5 cm in 1-mm increments. For each thickness, five different gelatin samples were prepared and imaged to provide statistical analyses. Intensity normalized, two-photon induced, fluorescence images of typical gelatin samples ranging in thickness from 1.1 to 1.4 cm can be seen in Fig. 3(b). From the image taken with a 1.1-cm gelatin phantom (upper left image), the localized fluorescence excitation spot can easily be seen, with a size of along the longest axis. The slightly elongated (i.e., noncircular) shape of the fluorescent emission is due primarily to the slightly off-axis excitation angle, with a small amount of the shape attributed to the excitation beam profile. Similar two-photon excited fluorescence excitation spots can also be seen in the images corresponding to 1.2-, 1.3-, and 1.4-cm thick gelatin phantoms, with the intensity decreasing with increasing thickness. From these images, it can be seen that two-photon excitation in the optical diagnostic window is possibly as deep as 1.4 cm using tissue safe laser powers. Although a two-photon excited fluorescent spot could also be seen in the 1.5-cm sample (image not shown), the signal intensity was not statistically different than that of the blank tissue phantom (i.e., tissue phantom without rhodamine) at the 90% confidence interval, suggesting that 1.4 cm is the maximum depth that can be probed prior to optical scatter of the excitation beam limiting the ballistic photons available for two-photon excitation. Furthermore, as expected, these images also reveal a relatively constant axial excitation area independent of the excitation depth. This is due to the fact that any scattered excitation photons cannot contribute to the two-photon absorption process, therefore, no matter how scattering the sample, the excitation volume is dictated by the source diameter and excitation optics. Therefore, using the same excitation source and optics for two-photon photoacoustic measurements, the resulting axial excitation area will be in diameter, with a slight decrease in excitation area at depths , where the ballistic photon density decreases to a point where two-photon excitation on the edges is diminished. This spatial resolution is sufficient to provide near cellular level spatial resolution while still providing significant two-photon photoacoustic signals necessary for tissue differentiation. To verify the ability to generate two-photon excitation events at depths of 1.4 cm or less in the presence of both optical scattering as well as optical absorption associated with real brain tissue samples, a similar study was performed with excised brain tissue samples acting as the scattering overlayer. In this study, an 1-mm thick RhB doped gelatin sample (without scatters) was fabricated and placed on the fluorescence measurement system, with three separate biopsied tissue samples stacked on top of the gelatin, providing an overall tissue thickness of 1.4 cm. Because several tissue samples had to be stacked to provide a comparable thickness to that determined from the tissue phantoms, acoustic coupling gel was placed between each biopsy sample to reduce interface effects. Once the gel coupled tissue samples were placed on top of the dye doped gelatin, fluorescence images were obtained by exciting through the overlying tissue with 1050-nm laser light. The corresponding two-photon excited fluorescent image of the gelatin is shown in Fig. 3(c). From this image, which has been intensity normalized to match the images in Fig. 3(b), a clear fluorescent excitation spot can be seen. This fluorescent spot appears slightly lower in intensity than the 1.4-cm thick gelatin phantom image in Fig. 3(b), however, they are statistically the same. In addition, the diameter of the excitation spot is , comparable to the size of the spot obtained in the nonabsorbing tissue phantom studies; thereby confirming the comparable scattering properties of the gelatin phantoms to real tissues and verifying that the dominant limitation of two-photon excitation of tissues over this spectral range is due to scattering loses as opposed to absorption loses. 3.3.Longitudinal Spatial ResolutionIn order to determine the volume of sample probed during a single analysis, it is also essential to determine the longitudinal resolution of the two-photon excitation occurring. To achieve this, two-photon excited fluorescence studies similar to those described for the axial resolution analyses were performed, but with the excitation laser beam oriented parallel to the surface of the microscope stage on which the gelatin phantom was placed [see Fig. 4(a)]. This orientation allows for the length of the two-photon excitation volume to be imaged along the axis of light propagation. The same lens was used for focusing the laser into the rhodamine embedded tissue phantom, with the focal point kept as close to the bottom surface of the gelatin as possible to prevent significant scattering of the fluorescent light before being imaged by the microscope. This distance was from the bottom of the gelatin sample to prevent clipping of the excitation beam by the microscope stage. As can be seen from the fluorescent image shown in Fig. 4(b) (taken 1.1 cm into a gelatin tissue phantom), the length of the fluorescent spot along the laser axis is . This image was obtained at a 1.1-cm depth within the sample, with multiple excitation events coadded (resulting in a slightly saturated image) to ensure the maximum longitudinal excitation length possible is measured, thereby providing a conservative estimate of the longitudinal resolution. Similar to the radial resolution measurements, the deeper into the sample you excite, the more scatter occurs and the length of the excitation volume will only decrease, improving the longitudinal resolution. As expected, this dimension is slightly larger than the axial dimensions but is still on the size scale of one to two cells in a tissue sample. This longitudinal resolution was verified to be at all depths within the gelatin phantom between 1 and 1.3 cm. The resulting two-photon excitation volume determined in these studies (which corresponds to a slight overestimation due to scattering of the generated fluorescent light) suggests that two-photon photoacoustic signals responsible for tissue differentiation are generated at the cellular or near cellular level (i.e., one to five cells). 3.4.Subsurface ImagingFollowing determination of the optical penetration depth and spatial resolution of the two-photon excitation process, the ability of the technique to three-dimensionally image analytes of interest through overlying structures was evaluated. In this study, a 1.5-cm-thick gelatin tissue phantom was created as described previously, however, at depths of 5-mm, 7-mm, and 9-mm, three polymer microtubes (internal diameter 250 μm) were inserted and filled with solutions of RhB, as shown in Fig. 5(a). Micromolar RhB solutions were employed as the model analyte for these studies to provide a conservative estimate of the contrast potential biomarkers of interest might provide. At a concentration of , this is well below that of many biomarkers, and the high quantum yield (i.e., ) of rhodamine results in the vast majority of the absorbed energy being emitted radiatively and not contributing to the photoacoustic signal, as opposed to most biological chromophores, which have quantum yields of .40 Fig. 5(a) Schematic diagram depicting the three-dimensional orientation of the embedded objects in the model tissue phantom. (b) Reconstructed multiphoton photoacoustic images of different depths within the tissue phantom, following 1050-nm excitation, revealing the location of model structures. Depth planes of 5 through 9 mm below the surface are imaged with step sizes. (c) Reconstructed multiphoton photoacoustic planar images of tissue phantoms with hemoglobin added throughout the gelatin at excess physiological concentrations, revealing the ability distinguishing the RhB filled microtubes in the presence of the dominant NIR absorbing background.  In order to generate three unique structures in each of the different -planes, each tube was oriented in a different direction. Once fabricated, two-photon photoacoustic images were obtained using the measurement system, as shown in Fig. 1. The laser was focused to different depths within the sample, corresponding to the depth of the sample being imaged (e.g., 5 mm, 7 mm, and so on) and the sample and piezoelectric transducer were raster scanned together in the and planes in increments (keeping the laser focal point fixed in space). By raster scanning the piezoelectric transducer and sample together as one unit, with the micrometer controlled -, -, - positioner, precise determination of the location being probed by the fixed laser focus was achieved without the need to alter the contact between the sample and the piezoelectric transducer from measurement-to-measurement. Image planes of every 1-mm deep, from 4 mm through 10 mm within the sample, were measured and reconstructed. The resulting reconstructed image slices are shown in Fig. 5(b). In addition, white light microscopy images of the sample are also shown (leftmost column of images) with the focal plane of the microscope objective adjusted to highlight the corresponding microtube structure imaged via two-photon photoacoustic spectroscopy. From these reconstructed images, the location, orientation, and size of the rhodamine-filled microtubes can be easily seen for each of the depths (5, 7, and 9 mm) with a clear contrast from the surrounding gelatin sample. Even at a depth of 9 mm, where the two-photon induced photoacoustic signal is expected to be significantly weaker due to greater scattering of the excitation light and a reduced number of ballistic photons available for two-photon absorption, a significant contrast can still be seen. Furthermore, by raster scanning in steps across the rhodamine-filled microtube, the resulting images confirm the axial spatial resolutions previously measured via fluorescence. In addition, it should also be noted that the images shown are obtained by exciting the sample through the overlying microtube structures without causing any distortions or backgrounds (i.e., ghosts) within the deeper images. This ability to visualize at a specific depth without interference from overlying structures highlights a major advantage of using two-photon excitation for signal generation. This ability to image without distortions or effects from overlying structures can be further seen in the two-photon photoacoustic images obtained at depths corresponding to no microtubes being present (i.e., 6- and 8-mm deep). From these two images, a relatively uniform intensity can be seen, corresponding to the background intensity in each of the other image planes. To verify that the image contrast from the phantom layers with microtubes was not due to absorption or scattering effects associated with the microtubes themselves, similar images were obtained from gelatin phantoms having microtubes filled with only gelatin (no rhodamine) and no signals other than background were observed. To further verify the contrast abilities of this technique, and its potential usefulness in blood perfused tissue analyses, a second gelatin phantom embedded with rhodamine-filled microtubes and loaded with hemoglobin throughout the gelatin matrix was fabricated. This gelatin phantom was created using a process similar to that described in the previous study except that the solution in which the gelatin matrix was allowed to gel contained of hemoglobin (50:50 mixture of oxy- and deoxyhemoglobin) in distilled water. This concentration was chosen because it represents a significant excess over what is found in blood, thereby representing an overestimation of what might be encountered in blood perfused or living tissues.46–48 To ensure that the hemoglobin did not degrade, the temperature of the gelatin was not allowed to exceed 37°C during the gel formation process. Once the body of the gelatin phantom was created, rhodamine B-filled microtubes were added the same way as before. Hemoglobin was doped into the phantoms because it represents the dominant tissue constituent exhibiting single-photon NIR absorption over the diagnostic window47,49 and the ability to contrast the two-photon absorption of the micromolar rhodamine B in its presence is essential for any future work in living tissues. Once constructed, a series of images were taken, as before, by raster scanning the transducer with the sample mounted on top while keeping the laser focus fixed. Images were reconstructed for different depths within the phantom (4 to 10 mm) using the raw photoacoustic signal intensity measured following excitation at 1050 nm. Figure 5(c) shows the images at 5, 7, and 9 mm, corresponding to the depths at which the microtubes filled with rhodamine B were embedded, along with a corresponding intensity scale. Although the intensity of the background signal increased slightly with the inclusion of the hemoglobin, the position of the rhodamine-filled microtubes can easily be distinguished with a high degree of contrast, even at physiologically excessive hemoglobin concentrations. Furthermore, the presence of the hemoglobin throughout the gelatin phantom matrix does not degrade the depth at which images can be obtained, as evidenced by the clear contrast of the microtube from the surrounding gelatin even at a depth of 9 mm. 4.ConclusionMultiphoton photoacoustic spectroscopy offers a great deal of potential for the differentiation of healthy and malignant astrocytomas without the need for exogenous contrast agents. This work has demonstrated the potential for rapid tissue differentiation of malignant astrocytomas from healthy tissues as well as characterized the fundamental imaging abilities and limits of multiphoton photoacoustic imaging. Blind studies on 12 matched pair excised brain tissue samples exhibited significant differences in the endogenous absorption spectra of the tissues over the NIR optical diagnostic window. Characterization of the optical performance characteristics of this technique for subsurface analyses has demonstrated the ability to obtain measurements in tissue phantoms as deep as 1.4 cm below the surface. Furthermore, the ability of multiphoton photoacoustic spectroscopy to provide cellular level spatial resolution in tissue phantoms with optical scattering properties similar to brain tissue has also been demonstrated. Finally, the ability to image at various subsurface depths within optically scattering samples without interference from overlying tissue/tissue-like structures has also been shown, even in the presence of a physiological excess of hemoglobin, suggesting that this technique might offer a great potential for in-vivo diagnoses in the future. AcknowledgmentsThe authors would like to gratefully acknowledge the Maryland Technology Development Corporation (MD TEDCO), Eli Lilly and Company and the University of Maryland Baltimore County for support of this work. ReferencesT. Vo-Dinh, Biomedical Photonics Handbook., 2 1876 2nd ed.CRC Press, Boca Raton
(2014). Google Scholar
I. Georgakoudi et al.,
“NAD(P)H and collagen as in vivo quantitative fluorescent biomarkers of epithelial precancerous changes,”
Cancer Res., 62
(3), 682
–687
(2002). CNREA8 0008-5472 Google Scholar
R. R. Alfano et al.,
“Advances in optical biopsy and optical mammography - panel discussion - review and summary of presentations,”
Advances in Optical Biopsy and Optical Mammography, 194
–196 New York Acad. Sciences, New York
(1998). Google Scholar
S. Andersson-Engels et al.,
“In vivo fluorescence imaging for tissue diagnostics,”
Phys. Med. Biol., 42
(5), 815
–824
(1997). http://dx.doi.org/10.1088/0031-9155/42/5/006 PHMBA7 0031-9155 Google Scholar
R. Richards-Kortum and E. Sevick-Muraca,
“Quantitative optical spectroscopy for tissue diagnosis,”
Annu. Rev. Phys. Chem., 47 555
–606
(1996). http://dx.doi.org/10.1146/annurev.physchem.47.1.555 ARPLAP 0066-426X Google Scholar
M. Panjehpour et al.,
“Endoscopic fluorescence detection of high-grade dysplasia in Barrett’s esophagus,”
Gastroenterology, 111 93
–101
(1996). http://dx.doi.org/10.1053/gast.1996.v111.pm8698231 GASTAB 0016-5085 Google Scholar
T. Vo-Dinh et al.,
“Laser-induced differential fluorescence for cancer diagnosis without biopsy,”
Appl. Spectrosc., 51
(1), 58
–63
(1997). http://dx.doi.org/10.1366/0003702971938768 APSPA4 0003-7028 Google Scholar
G. A. Wagnieres, W. M. Star and B. C. Wilson,
“In vivo fluorescence spectroscopy and imaging for oncological applications,”
Photochem. Photobiol., 68
(5), 603
–632
(1998). http://dx.doi.org/10.1111/php.1998.68.issue-5 PHCBAP 0031-8655 Google Scholar
R. R. Alfano et al.,
“Fluorescence-spectra from cancerous and normal human-breast and lung tissues,”
IEEE J. Quantum Electron., 23
(10), 1806
–1811
(1987). http://dx.doi.org/10.1109/JQE.1987.1073234 IEJQA7 0018-9197 Google Scholar
R. M. Cothren et al.,
“Gastrointestinal tissue diagnosis by laser-induced fluorescence spectroscopy at endoscopy,”
Gastrointest. Endoscopy, 36
(2), 105
–111
(1990). http://dx.doi.org/10.1016/S0016-5107(90)70961-3 GAENBQ 0016-5107 Google Scholar
C. R. Kapadia et al.,
“Laser induced fluorescence spectroscopy of human colonic mucosa,”
Gastroenterology, 99
(1), 150
–157
(1990). GASTAB 0016-5085 Google Scholar
N. Ramanujam et al.,
“Cervical precancer detection using a multivariate statistical algorithm based on laser-induced fluorescence spectra at multiple excitation wavelengths,”
Photochem. Photobiol., 64
(4), 720
–735
(1996). http://dx.doi.org/10.1111/php.1996.64.issue-4 PHCBAP 0031-8655 Google Scholar
T. Vo-Dinh et al.,
“In-vivo cancer-diagnosis of the esophagus using differential normalized fluorescence (DNF) indexes,”
Lasers Surg. Med., 16
(1), 41
–47
(1995). http://dx.doi.org/10.1002/(ISSN)1096-9101 LSMEDI 0196-8092 Google Scholar
V. Pansare et al.,
“Review of long-wavelength optical and NIR imaging materials: contrast agents, fluorophores, and multifunctional nano carriers,”
Chem. Mater., 24
(5), 812
–827
(2012). http://dx.doi.org/10.1021/cm2028367 CMATEX 0897-4756 Google Scholar
B.R. Masters, P.T. So and E. Gratton,
“Multiphoton excitation fluorescence microscopy and spectroscopy of in vivo human skin,”
Biophys. J., 72
(6), 2405
–2412
(1997). http://dx.doi.org/10.1016/S0006-3495(97)78886-6 BIOJAU 0006-3495 Google Scholar
J. Bewersdorf, R. Pick and S.W. Hell,
“Multifocal multiphoton microscopy,”
Opt. Lett., 23 655
–657
(1998). http://dx.doi.org/10.1364/OL.23.000655 OPLEDP 0146-9592 Google Scholar
R.M. Williams, W.R. Zipfel and W.W. Webb,
“Multiphoton microscopy in biological research,”
Curr. Opin. Chem. Biol., 5
(5), 603
–608
(2001). http://dx.doi.org/10.1016/S1367-5931(00)00241-6 COCBF4 1367-5931 Google Scholar
K. Koenig et al.,
“Two-photon excited lifetime imaging of autofluorescence in cells during UVA and NIR photostress,”
J. Microsc., 183 197
–204
(1996). http://dx.doi.org/10.1046/j.1365-2818.1996.910650.x JMICAR 0022-2720 Google Scholar
J. C. Jung et al.,
“In vivo mammalian brain imaging using one and two-photon fluorescence microendoscopy,”
J. Neurophysiol., 92 3121
–3133
(2004). http://dx.doi.org/10.1152/jn.00234.2004 JONEA4 0022-3077 Google Scholar
H. Szmacinski, I. Gryczynski and J. R. Lakowicz,
“Spatially localized ballistic two-photon excitation in scattering media,”
Biospectroscopy, 4 303
–310
(1998). http://dx.doi.org/10.1002/(ISSN)1520-6343 BIOSFS 1075-4261 Google Scholar
T. C. So et al.,
“Two-photon excitation fluorescence microscopy,”
Annu. Rev. Biomed. Eng., 2 399
–429
(2000). http://dx.doi.org/10.1146/annurev.bioeng.2.1.399 ARBEF7 1523-9829 Google Scholar
P. Theer and W. Denk,
“On the fundamental imaging-depth limit in two-photon microscopy,”
J. Opt. Soc. Am. A, 23
(12), 3139
–3149
(2006). http://dx.doi.org/10.1364/JOSAA.23.003139 JOAOD6 0740-3232 Google Scholar
P. Theer, M.T. Hasan and W. Denk,
“Two-photon imaging to a depth of 1000 mm in living brains by use of a regenerative amplifier,”
Opt. Lett., 28
(12), 1022
–1024
(2003). http://dx.doi.org/10.1364/OL.28.001022 OPLEDP 0146-9592 Google Scholar
A. A. Oraevsky, A. A. Karabutov,
“Optoacoustic tomography,”
Biomedical Photonics Handbook, CRC Press, Boca Raton
(2003). Google Scholar
H. F. Zhang et al.,
“Functional photoacoustic microscopy for high-resolution and noninvasive in vivo imaging,”
Nat. Biotechnol., 24
(7), 848
–851
(2006). http://dx.doi.org/10.1038/nbt1220 NABIF9 1087-0156 Google Scholar
J. Mobley, B.M. Cullum and T. Vo-Dinh,
“Method for the simultaneous acquisition of optical absorption and sonic attenuation with photoacoustic ultrasound,”
Proc. SPIE, 3911 180
(2000). http://dx.doi.org/10.1117/12.384901 PSISDG 0277-786X Google Scholar
C. G. A. Hoelen et al.,
“Three-dimensional photoacoustic imaging of blood vessels in tissue,”
Opt. Lett., 23
(8), 648
–652
(1998). http://dx.doi.org/10.1364/OL.23.000648 OPLEDP 0146-9592 Google Scholar
A. A. Bednov, E. V. Savateeva and A. A. Oraevsky,
“Opto-acoustic monitoring of blood optical properties as a function of glucose concentration,”
Proc. SPIE, 4960 21
(2003). http://dx.doi.org/10.1117/12.479519 PSISDG 0277-786X Google Scholar
X. Wang et al.,
“Laser-induced photoacoustic tomography for small animals,”
Proc. SPIE, 4960 40
(2003). http://dx.doi.org/10.1117/12.477788 PSISDG 0277-786X Google Scholar
P. C. Beard and T. N. Mills,
“2-D line-scan photoacoustic imaging of absorbers in a scattering tissue phantom,”
Proc. SPIE, 4256 34
–42
(2001). http://dx.doi.org/10.1117/12.429319 PSISDG 0277-786X Google Scholar
I. Patrickeyev and A. A. Oraevsky,
“Multiresolution reconstruction method to opto-acoustic imaging,”
Proc. SPIE, 4960 99
(2003). http://dx.doi.org/10.1117/12.477647 PSISDG 0277-786X Google Scholar
V. A. Andreev et al.,
“Detection of prostate cancer with opto-acoustic tomography,”
Proc. SPIE, 4960 45
(2003). http://dx.doi.org/10.1117/12.483489 PSISDG 0277-786X Google Scholar
R. O. Esenaliev, A. A. Karabtov and A. A. Oraevsky,
“Sensitivity of laser opto-acoustic imaging in detection of small deeply embedded tumors,”
IEEE J. Select. Top. Quantum Electron., 5 981
–988
(1999). http://dx.doi.org/10.1109/2944.796320 Google Scholar
A. A. Karabutov et al.,
“Backward mode detection of laser-induced wide-band ultrasonic transients with optoacoustic transducer,”
J. Appl. Phys., 87
(4), 2003
–2014
(2000). http://dx.doi.org/10.1063/1.372127 JAPIAU 0021-8979 Google Scholar
N. Chandrasekharan, B. Gonzales and B. M. Cullum,
“Non-resonant multiphoton photoacoustic spectroscopy for noninvasive subsurface chemical diagnostics,”
Appl. Spectrosc., 58
(11), 1325
–1333
(2004). http://dx.doi.org/10.1366/0003702042475565 APSPA4 0003-7028 Google Scholar
N. Chandrasekharan et al.,
“Development of multiphoton photoacoustic spectroscopy for non-invasive tissue diagnostics,”
Proc. SPIE, 5261 58
–69
(2003). http://dx.doi.org/10.1117/12.514797 PSISDG 0277-786X Google Scholar
R. L. Shelton, S. P. Mattison and B.E. Applegate,
“Volumetric imaging of erythrocytes using label-free multiphoton photoacoustic microscopy,”
J. Biophotonics, 7
(10), 834
–840
(2013). http://dx.doi.org/10.1002/jbio.v7.10 Google Scholar
Y. Yamaoka, M. Nambu and T. Takamatsu,
“Fine depth resolution of two-photon absorbtion-induced photoacoustic microscopy using low-frequency bandpass filtering,”
Opt. Express, 19
(14), 13365
–133377
(2011). http://dx.doi.org/10.1364/OE.19.013365 OPEXFF 1094-4087 Google Scholar
Y. Yamaoka et al.,
“Improvement of signal detection selectivity and efficiency in two-photon absorption-induced photoacoustic microscopy,”
Proc. SPIE, 8943 89433C
(2014). http://dx.doi.org/10.1117/12.2039323 PSISDG 0277-786X Google Scholar
D. N. Stratis-Cullum et al.,
“Spectroscopic data of biologically and medically relevant species and samples,”
Biomedical Photonics Handbook, 65-1
–65-136 CRC Press, Boca Raton
(2014). Google Scholar
S. L. Jacques,
“Optical properties of biological tissues: a review,”
Phys. Med. Biol., 58 R37
–R61
(2013). http://dx.doi.org/10.1088/0031-9155/58/11/R37 PHMBA7 0031-9155 Google Scholar
V. Masilamani et al.,
“Optical biopsy of benign and malignant tissue by time resolved spectroscopy,”
Technol. Cancer Res. Treat., 12
(6), 559
–563
(2013). http://dx.doi.org/10.7785/tcrt.2012.500345 Google Scholar
T. Vo-Dinh, B. M. Cullum,
“Fluorescence spectroscopy for biomedical diagnostics,”
CRC Handbook of Biomedical Photonics, 28-1
–28-50 CRC Press, Boca Raton
(2003). Google Scholar
S. Dahal and B. M. Cullum,
“Mimicking brain tissues by doping scatterers into gelatin tissue phantoms and determination of chemical species responsible for NMPPAS,”
Proc. SPIE, 8367 836707
(2012). http://dx.doi.org/10.1117/12.918254 PSISDG 0277-786X Google Scholar
S. Dahal and B. M. Cullum,
“Depth and resolution characterization of two-photon photoacoustic spectroscopy for non-invasive subsurface chemical diagnostics,”
Proc. SPIE, 8025 80250E
(2011). http://dx.doi.org/10.1117/12.882800 PSISDG 0277-786X Google Scholar
H. Jansson and J. Swenson,
“Dynamical changes of hemoglobin and its surrounding water during thermal denaturation as studied by quasielastic neutron scattering and temperature modulated differential scanning calorimetry,”
J. Chem. Phys., 128
(24), 245104
(2008). http://dx.doi.org/10.1063/1.2943199 Google Scholar
E. Ritz et al.,
“Target level for hemoglobin correction in patients with diabetes and CKD: primary results of the anemia correction in diabetes (ACORD) study,”
Am. J. Kidney Dis., 49
(2), 194
–207
(2007). http://dx.doi.org/10.1053/j.ajkd.2006.11.032 Google Scholar
J. Varon and R. E. Fromm, Handbook of Practical Critical Care Medicine, Springer, New York
(2002). Google Scholar
B. L. Horecker,
“The absorption spectra of hemoglobin and its derivatives in the visible and near infra-red regions,”
J. Biol. Chem., 148
(1), 173
–183
(1943). JBCHA3 0021-9258 Google Scholar
|