|
|
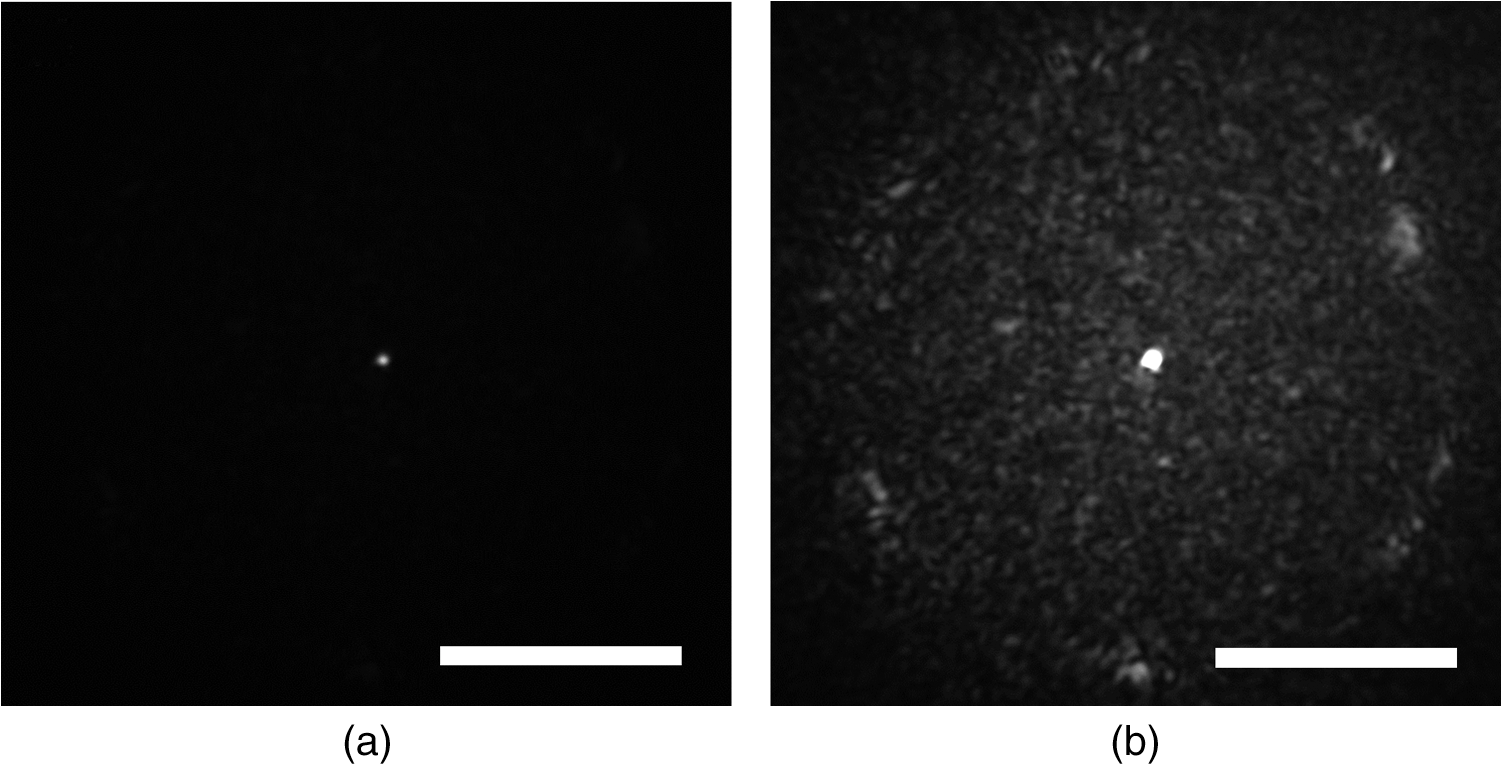
1.IntroductionThere is strong interest in developing high-resolution devices for internal in vivo imaging. These tools would aid medical doctors and researchers in diagnosing and understanding many medical ailments, such as cancer, with a less invasive method than current practice. Multiphoton imaging provides a useful tool for cellular imaging1–6 and is widely used in brain6 and biological imaging.1–4 Like confocal microscopy, multiphoton imaging provides optical sectioning, which is necessary for imaging within thick tissue samples.1 The compatibility between multiphoton imaging and biology is well-known and a few endoscopic devices have been developed as a result.7–10 Endoscopic devices for two-photon fluorescence (TPF) imaging generally utilize a single-mode fiber for pulse delivery with mechanical components encased in a probe at the fiber’s distal tip to enable point scanning.8–10 The scanning mechanism significantly increases the size of the endoscope over that of the light-delivering fiber. Although these devices are a significant improvement over existing technologies, a more compact TPF endoscope remains a desired goal. To meet this goal, endoscopes utilizing specialty fibers and optics without distal optics or mechanics are being pursued. For example, commercial confocal endoscopes (not multiphoton) utilize a multicore fiber (MCF) for small-diameter endoscopes.11,12 These devices scan light through many cores of the fiber to sample the image at each core position at the distal end. The resolution of core-by-core scanning MCF endoscopes is limited by the core spacing,13 which must be kept sufficiently large to limit core-to-core coupling.14,15 The resolution can be improved with a graded index (GRIN) lens that demagnifies the fiber facet; however, this improvement comes at the expense of a reduced field of view, and the resolution is still limited by core spacing. This GRIN lens arrangement was used in a previous implementation of TPF imaging through an MCF.7 More recently, MCFs have been utilized with wavefront shaping techniques to control the wavefront at the distal end.13,16–18 These methods are similar to the methods recently deployed in step-index multimode fiber (MMF) imaging,19–23 in which they create a focus at the distal end by properly selecting the wavefront at the proximal side. The key difference between these methods is that in MMFs, the modes provide the degrees of freedom in the light field control, whereas the fiber cores (and their modes) do in MCFs. With step-index MMFs, these methods are restricted with regard to multiphoton microscopy due to modal dispersion of a propagating ultrashort pulse. The temporal spread of the modes as they propagate through the fiber limits the number that can contribute to a focus spot recreation.24 However, GRIN fibers exhibit significantly less modal dispersion, and we have recently demonstrated TPF imaging through one combined with a GRIN lens.25 Using single-mode MCFs bypasses the restrictions imposed by modal dispersion, as well. Recently, a wavefront shaping method has been demonstrated with MCFs for multiphoton imaging.18 The system developed by Andresen et al.18 uses a custom-fabricated MCF comprised of 169 highly spaced, single-mode cores arranged in a hexagonal grid. With this fiber, the light field can be controlled with minimal core-to-core coupling. However, the large separation between periodically arranged cores resulted in a close spacing between diffraction orders at the focal plane, thus limiting the field of view and forcing a large working distance, which decreases resolution.18,26 In this paper, we use wavefront shaping in conjunction with MCFs for TPF imaging, similar to Ref. 18. We utilize TPF imaging to enable optical sectioning in our lensless endoscope. However, to create the focus, we use coherence-gated digital phase conjugation (DPC), as we have done previously with a GRIN and step-indexed MMFs.24,25 DPC compensates for core-to-core coupling27 and allows for use of commercially available MCFs, which contain a large number (several thousand to 100,000) of densely packed cores arranged in a quasiperiodic array. The closely spaced cores spread the diffraction orders in the focal plane away from the desired focus, which allows for a larger field of view than possible with highly spaced core MCFs18 and also reduces the power distributed to the diffraction orders. Although the MCF used propagates a few modes at our experimental wavelength, we show that a single mode can be selected through modal dispersion in the fiber and coherence gating during hologram recording. We demonstrate that coherence-gated DPC allows for the selective propagation of individual modes and that the fundamental mode offers a better focusing performance when compared to the higher order mode. Finally, we construct TPF images by digital scanning of the phase-conjugated focus on the target object and fluorescence collection through the MCF to obtain images of fluorescently stained beads and cells. 2.Coherence-Gated Digital Phase ConjugationDPC of ultrashort pulses with fibers allows for precise selectivity of the phase-conjugated modes.24 To perform DPC, a calibrating focus spot is created at the distal end of the fiber. After propagation through the fiber, the field is recorded at the proximal end using off-axis digital holography. The recorded field can then be phase conjugated digitally and coupled back into the fiber to recreate a focus spot at the original calibration focus. In the case of coherence-gated DPC, the two pulses recording the hologram must overlap in space and time at the detector array. One pulse emerges from the MCF and the other is a reference wave. In most commercially available MCFs, each core supports the propagation of only a few modes. An ultrashort pulse propagating in a core will couple into the linearly polarized (LP) modes, which temporally separate as a result of modal dispersion. During the hologram recording, the short coherence length of the high-bandwidth laser pulse coherence gates the recording process. This allows for time-sampling the pulse after propagation through the MCF, recording the field of a selected set of modes after propagation through the fiber. To test coherence-gated DPC through an MCF, we use a commercially available fiber (Fujikura, FIGH-03-215S). This fiber has 3000 cores within a diameter. Individual cores have a numerical aperture (NA) of 0.34 and are in diameter on average and spaced by on average. These cores have a number of and support the and modes at 785-nm wavelength. These fibers are designed with a variation in core diameter to minimize core-to-core coupling.14 Notably, the smaller core spacing separates the diffraction orders in the far-field, which allows a wider field of view than possible with highly spaced core MCFs.17 The optical system used for coherence-gated DPC is shown in Fig. 1. The laser beam emitted from a Coherent Chameleon (3 W, 140 fs, operated at ) is collimated and split into reference and calibration arms. The power ratio between the two arms is selected depending on whether the system is in a hologram recording or readout configuration. For these experiments, a 30-cm length of MCF is mounted between two objectives separated by 28 cm, thus fixing the fiber with a slight curvature. Figure 1(a) shows the optical path during the hologram recording phase. To record a hologram, light travels through both the reference and calibration arms. The light in the calibration path is focused in front of the distal end of the fiber. After collection and transmission through the MCF, the light is imaged onto a CMOS detector (MV1-D1312IE-100-G2-12, Photonfocus) by an objective lens and a lens in a 4f configuration. The pulse that propagates through the reference path arrives concurrently on the CMOS and interferes with the calibration pulse. A delay line is placed in the reference path for tuning the temporal delay. Fig. 1The optical apparatus for DPC with an MCF. The optical apparatus in (a) hologram recording and (b) read out mode for focus spot recreation. (a) The beam is split into two parts: reference and calibration paths. The calibration path creates a focus spot at the distal end of the MCF. This beam interferes with the reference beam at the CMOS after propagation through the fiber. (b) The field recorded previously is phase conjugated and displayed on the SLM, which encodes the readout pulse before propagating through the MCF and recreating the focus spot. PBS, polarizing beam splitter; BS, beamsplitter; D, dichroic beamsplitter; 9:1, 90:10 (R:T) beamsplitter; Obj, objective lens; HWP, halfwave plate; L, lens; PMT, photomultiplier tube; and SLM, spatial light modulator. 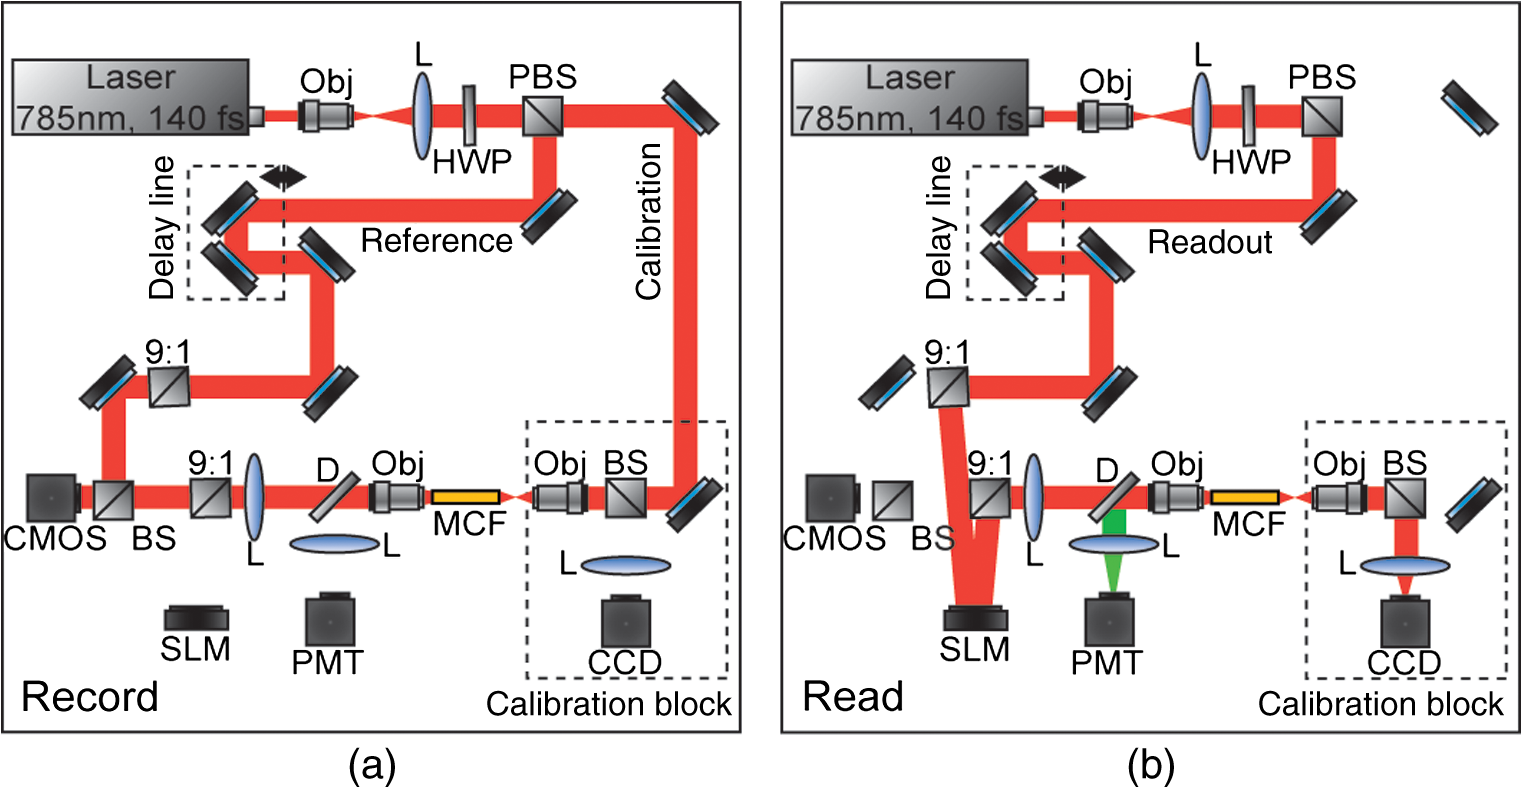 After recording, the phase of the field is extracted from the recorded hologram, phase conjugated, and displayed on the spatial light modulator (SLM, Pluto-NIR2, Holoeye). Figure 1(b) shows the optical path during the hologram readout. Two 90:10 beamsplitters (R:T) are used to read out the phase-conjugate hologram displayed on the SLM to minimize the beamsplitter losses of the phase-conjugated beam.28 On the distal end of the fiber, the objective used to focus the calibration beam is used to capture the phase-conjugated light, which is then reimaged on a CCD (Point Grey Research, Chameleon 3) for examination. Coherence-gated holography of the pulse allows an analysis of the temporal and spatial shapes of the transmitted pulse from each core. The coherence-gating reference pulse can be treated as a sampling window in time. However, its sampling window size is not determined by the pulse length, but by the coherence length of the source because the interference measurement is not sensitive to spectral phase (i.e., to chromatic dispersion, which broadens the pulse). In this way, it probes the temporal coherence function of the pulses emerging from each core. Because coherence-gated holography provides the coherence function across the fiber facet, it provides information about pulse transmission from individual cores. The temporal profile of the coherence-gated output was measured by first-order cross correlation of the reference and the pulses transmitted through the MCF. To do this, the delay line was moved in steps (133 fs), and a hologram was recorded at each position. Then, by integrating the power in the first diffraction order of the hologram’s Fourier transform, we measured the total power of the coherence-gated output from each core of the MCF at each step [Fig. 2(a)]. The temporal profile reveals that the light emerges from the MCF cores in two distinct LP modes: the and . Figures 2(b) and 2(c) show the Fourier transforms of the hologram captured at and , respectively. A comparison of the spatial frequency components encoded in the holograms shows distinct spatial frequency content in the two fields. After recovering the phase of the field, is clearly the mode of each core [Fig. 2(d)]. This is apparent in the quadratic phase, which encircles each core of the MCF at , whereas the phase recovered at shows a phase image [Fig. 2(e)] corresponding to the higher order mode. The inset of Fig. 2(a) is a histogram showing the distribution of the times of the maximum power of the coherence function from each core during the mode arrival range. It contains 24 bins of 133 fs width. Fig. 2(a) The temporal profile of the total power of the coherence-gated output from the MCF. The inset shows a histogram of the delay times of the maximum power of the coherence function of the pulses from each core within the first 3.2 ps. (b) Fourier transform of the hologram captured at , (c) Fourier transform of the hologram captured at , (d) the phase reconstruction from (b), which shows quadratic phase patterns encircling individual cores indicating the mode, and (e) the phase reconstruction from (c) with the mode in each core. 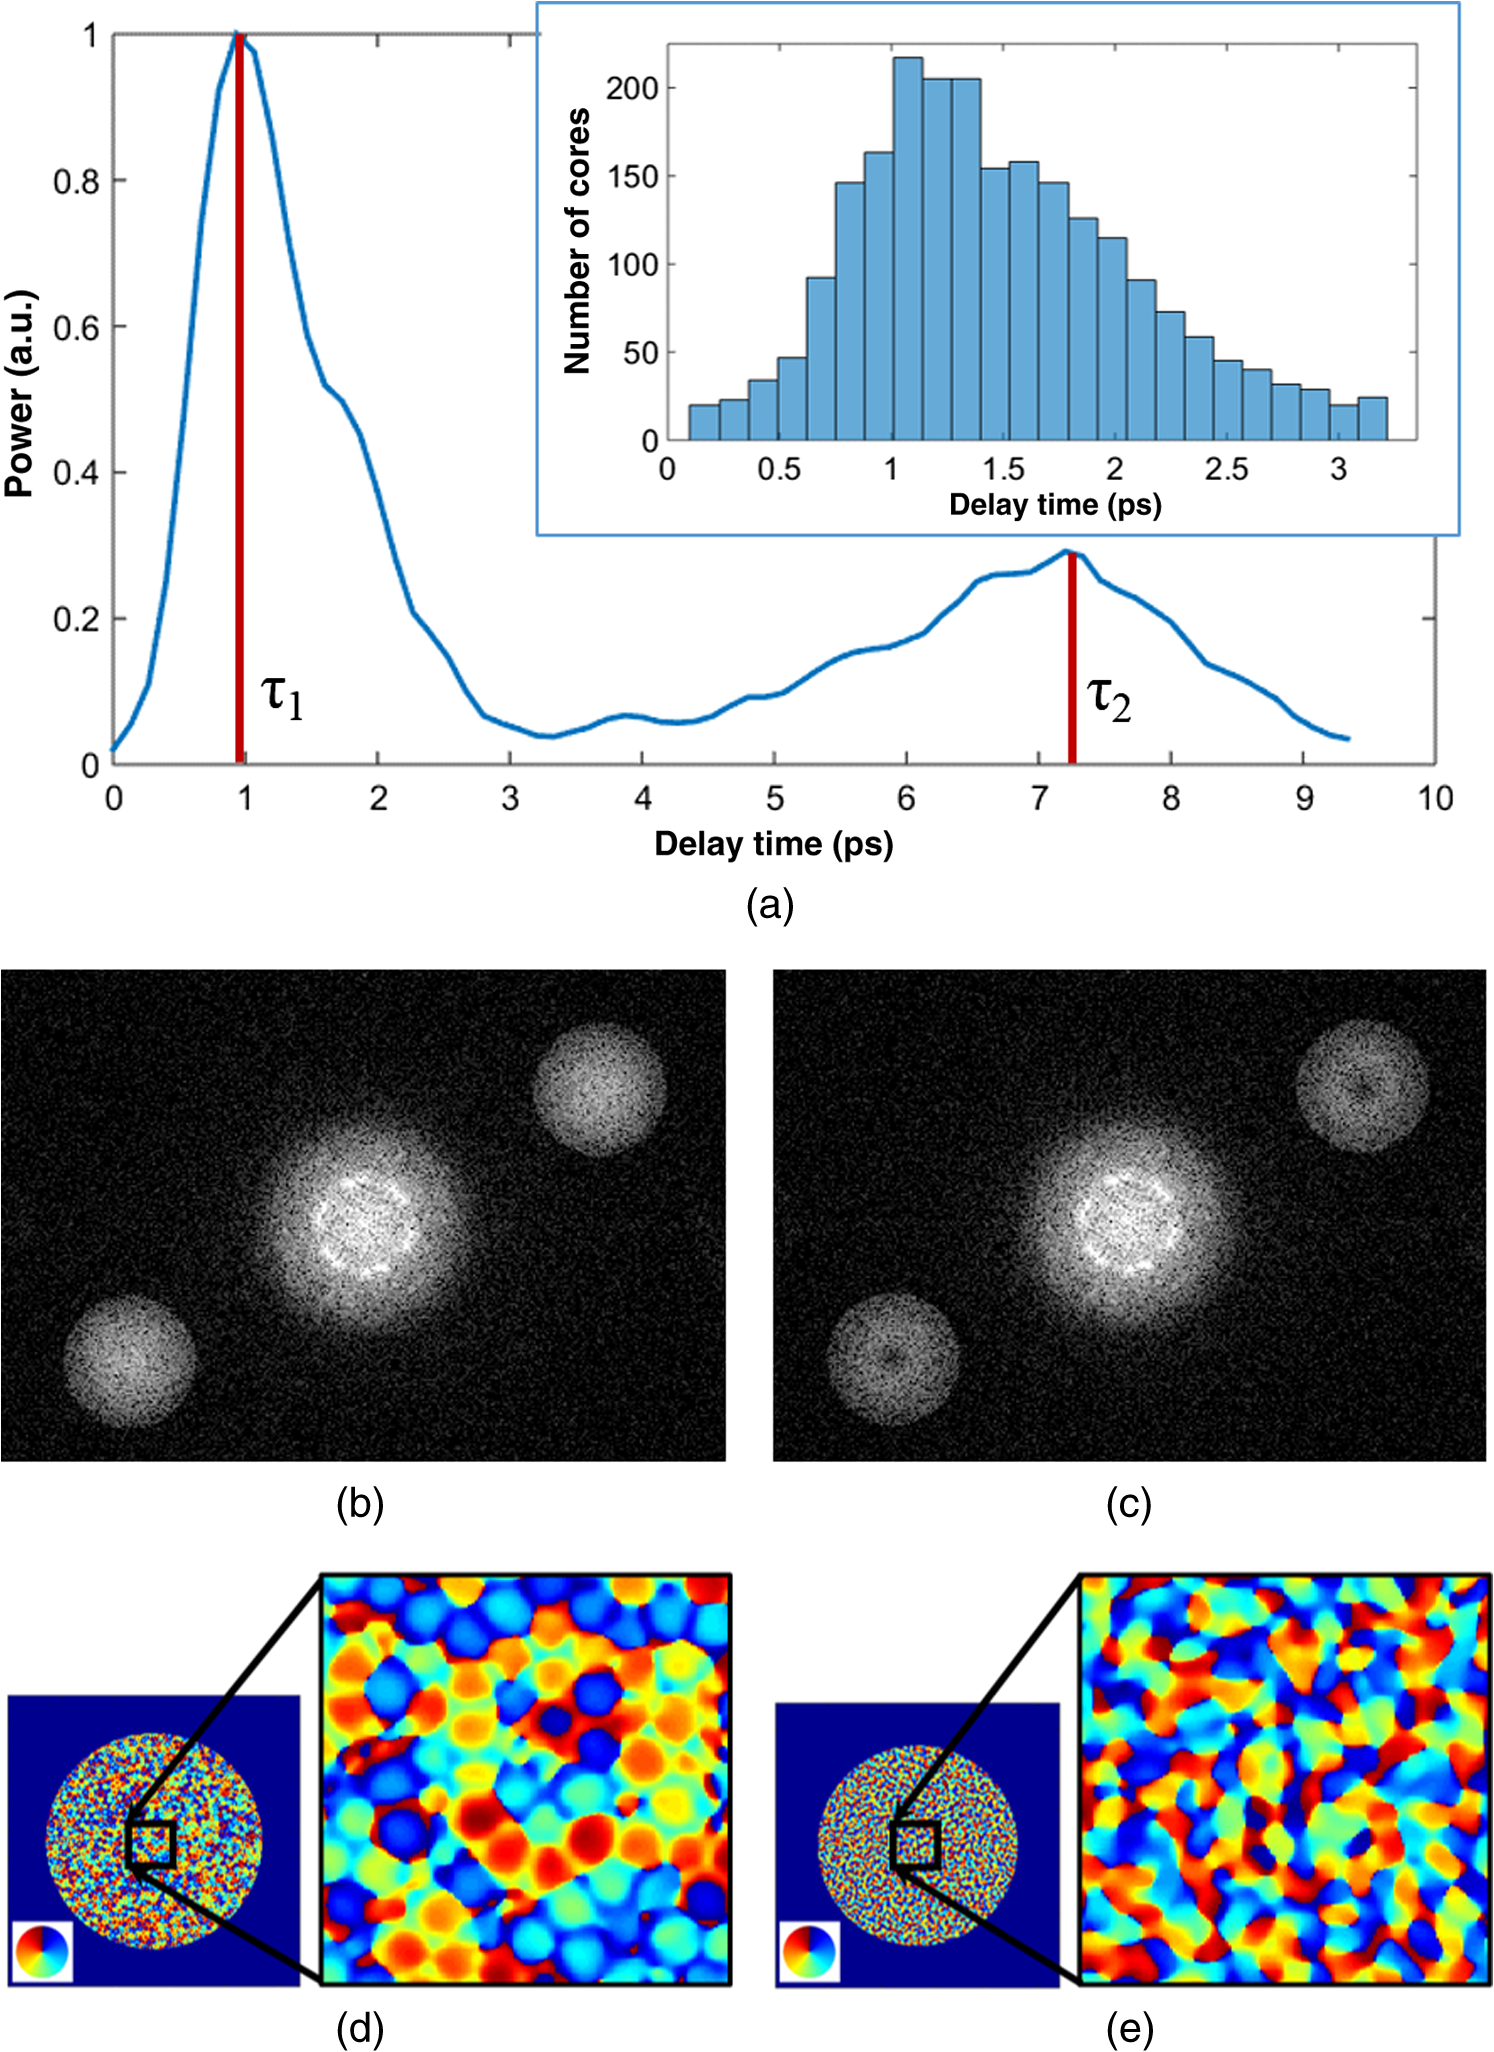 3.Characterization of Digital Phase Conjugation Focused Ultrashort PulsesThe reconstructed focus spots obtained by DPC of the and the modes were characterized. This analysis revealed that the focus spot created from the DPC in an MCF behaves in two distinct ways depending on the LP mode used in the reconstruction. 3.1.Focal Spot Contrast and SizeThe calibration arm created a focus spot at away from the MCF distal end. After phase conjugation, the measured signal in relation to the average of the background (e.g., signal-to-background ratio [SBR]) for a calibration focus transversely centered on the fiber was 130 for phase conjugation with the and 60 for the modes of the MCF cores. The full width at half maximum of the focus was for the mode and for the mode. Because the fundamental mode consists of light that effectively has a lower NA than higher-order modes, it is expected that the mode would create a larger focus spot than the mode.29 We can use the measured spot sizes to calculate the effective NA () to be 0.27 and 0.31 for the and modes, respectively. Figure 3(a) shows the focal plane with the phase-conjugated focus spot using the mode of the MCF cores at from the MCF facet, in which the diffraction orders are not visible. After increasing the exposure time by 20 times [Fig. 3(b)], the background becomes visible, including the spatially spread diffraction orders surrounding the phase-conjugated focus at a lateral distance of . The focus is 28 times more intense than the brightest spot in the diffraction order. 3.2.Modal Contribution to Focus SpotThe temporal profile of the total power of the coherence-gated phase-conjugated focus was analyzed at the distal end facet. An off-axis digital holography setup was built to enable this measurement. Figure 4 shows the temporal shape of the phase-conjugated pulse at the distal end of the fiber, measured in the same way as Fig. 2(a). When the mode was coherence gated [at in Fig. 2(a)] and phase conjugated, we measured that 88% of the optical power exiting the fiber arrived in the mode [Fig. 4(a)]. In fact, 70% of the core pulses arrive within 0.5 ps at the distal end [Fig. 4(a), inset]. The spread is a result of varying group delay in each core.30 In contrast, 70% of the pulses arrive within 1.25 ps at the proximal end during the hologram recording phase [Fig. 2(a), inset]. When coherence gating the mode, some of the optical power after DPC coupled into the mode, but most, 62%, of the power propagated in the mode [Fig. 4(b)]. The loss of power could be attributed to slight misalignment or to phase-only wavefront modulation, which contributed to the lower focal spot SBR when using the mode. These results demonstrate the ability of DPC to control and couple the pulse directly into the mode. As mentioned above, slight variations in core properties cause a spread in group delay between cores.30 Intercore group delay is not compensated by DPC, but coherence-gated DPC allows selective phase conjugation of pulses that have traveled with similar group delay. Thus, on the distal end, they arrive within a similar time frame. Of course, large differences in group delay between cores result in some cores not contributing to the phase conjugation. We estimate that only of the cores contribute to the formation of the pulsed wavefront at the focus spot resulting in a loss of peak intensity by a factor of 4. Fig. 4The temporal profile of the total power of the coherence-gated output from the distal end of the MCF after phase conjugation. (a) The pulse profile when phase conjugating the mode [at in Fig. 2(a)]. The inset shows a histogram of the distribution of the time point of peak intensity of the coherence function of the pulses from each core within the first 3.2 ps. (b) The profile when phase conjugating the mode [at in Fig. 2(b)]. 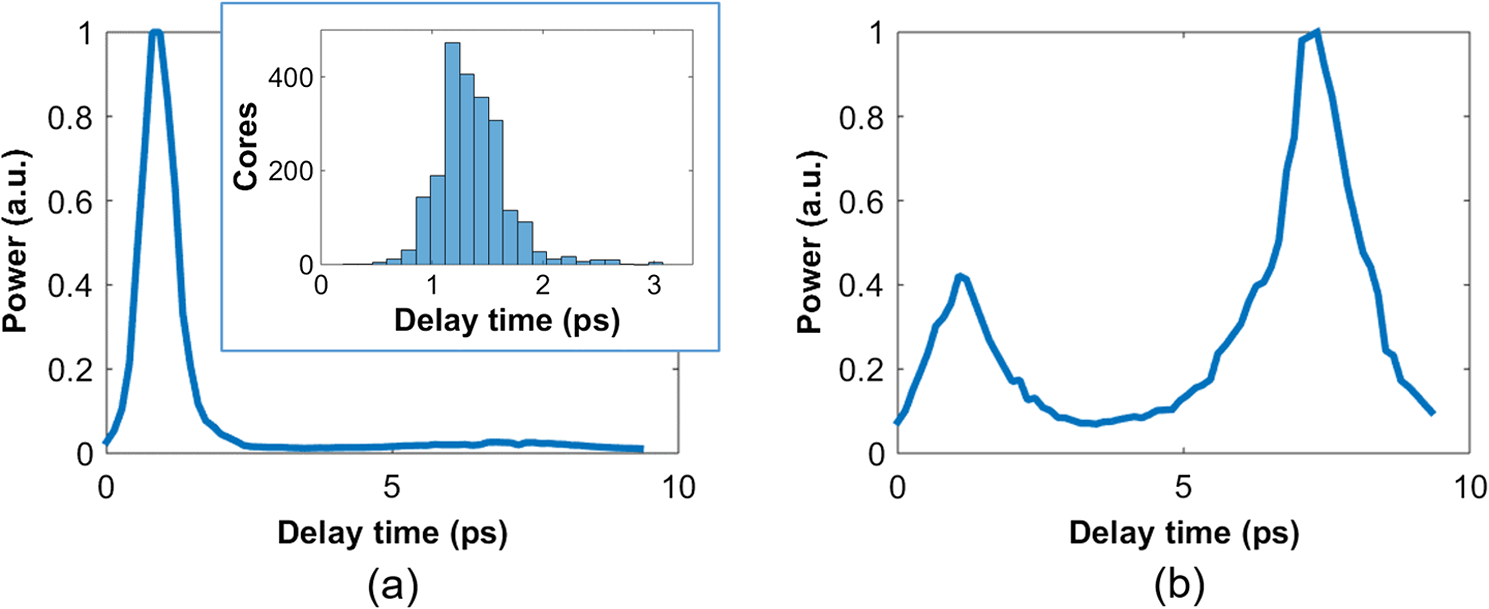 3.3.Pulse LengthTo measure the pulse width of the focused pulse, the optical system was altered to function as an interferometric second-order autocorrelator. A Michelson interferometer with a variable delay in one arm was added into the reference path31 to create two coaligned pulses propagating with varying delay times. A two-photon screen ( thick SU-8 with Rhodamine 6G) was placed in the focal plane of the fiber to provide a nonlinear signal for pulse autocorrelation. The measured pulse width of the optical focus using the phase-conjugated mode [coherence gate at the peak in Fig. 2(a)] was 390 fs. The pulse length was measured to be 270 fs before propagation through the fiber. The increased pulse length in this case is not due to the variability of the group delay from one core to another. Instead, it is the result of chromatic dispersion in each core. In principle, this could be compensated by prechirping the pulse. 4.Digital Scanning and Field of ViewTPF imaging through the MCF is enabled by scanning the focused femtosecond pulse across the object. This was implemented by recording and saving the phase conjugating hologram for each calibration focus spot in the sample plane. The distal end of the MCF was attached to a stage, which moved transversely in increments. In this way, the focal spot position moved relative to the fiber facet. Once the holograms were saved in the computer memory, they were ready to be sequentially displayed on the SLM to scan a focus spot. The field of view for imaging with this technique is limited by the angular spread of the phase-conjugated mode. As the focus spot transversely moves away from the center of the fiber, fewer cores can contribute to the focus spot and the aperture at the fiber facet shrinks and loses its circular shape, as shown already in DPC operation at large distances from the fiber facet.32 Furthermore, the hologram records the phase value from each individual core, which essentially discretizes the phase by sampling the quadratic phase field of the diverging calibration beam. When the quadratic phase is too strong, the core spacing undersamples the field, causing aliasing effects, and focusing into neighboring diffraction orders away from the desired focus. The field of view was analyzed by simulating the spatial dependence of the focus intensity with the mode. To do this, the phase conjugating field at the distal facet of the MCF was modeled and propagated with a beam propagation simulation. The resulting focus intensities reveal the usable and optimal range for imaging. The core positions were modeled according to the experimentally measured positions of the MCF. We simulated the propagation of a monochromatic beam () from the MCF distal facet by a distance to reconstruct the focus spot. We selected the phase of the field at each core by sampling the phase of a spherical wave centered at the focus position. A phased-array pattern was then calculated using the radiation pattern of the mode centered at each core. Figure 5(a) shows an intensity map of the peak intensity of the focus radially () within a range of and axially () from the fiber facet to . The simulation reveals a peak intensity hot spot located between 300 and from the facet. This is the point where all the cores significantly contribute to the focus reconstruction corresponding to the of the phase conjugating mode. Also, creating a focus further from the facet minimizes the percentage of power in the diffraction orders. At , the simulation shows 15% of the total power in the focal spot, this value increases to 37% at . It is important to note that we expect lower percentages with a pulsed laser due to group delay variability between cores and mode coupling. Beyond the peak intensity hot spot, the focusing NA begins to decrease as the aperture diameter remains constant and increases, thus the increasing focus spot size decreases the intensity. Figure 5(b) shows the experimentally obtained intensity distribution of the DPC generated focus spot at . Figure 5(c) shows the profile of experimentally obtained focal spot intensities at compared to the simulated intensity profile at that distance. Fig. 5(a) The relative intensity of a phase-conjugated focus spot at varying radial distance from fiber center () and distance from fiber facet (). (b) The experimentally obtained intensity distribution of the DPC generated focus spot at . (c) The simulated intensity profile of the red dashed line shown in (a) compared with experimentally acquired intensity data, both correspond to .  5.Two-Photon Fluorescence ImagingIn TPF microscopy, the signal detected from a voxel of a fluorescent object is proportional to , where is the peak intensity of the excitation beam. In the experimental setup, the overall average optical power from the laser is reduced by a factor of almost 30 by the time it reaches the distal end of the fiber (2.8 W to 100 mW). This is mostly due to the diffraction efficiency of the SLM. In addition, only 1% of the transmitted power is concentrated on the focused spot. This leads to an overall reduction by a factor of 3000 in the available peak intensity from the raw laser beam to the focused femtosecond pulse we obtain at the distal end of the fiber. Nevertheless, we obtain a peak intensity of with a 390-fs pulse. We used these pulses to demonstrate TPF imaging and optical sectioning through the MCF by imaging a three-dimensional (3-D) sample of polystyrene beads stained with Rhodamine 6G mounted in polydimethylsiloxane (PDMS). An focal plane was calibrated with steps between focus spots. An imaging plane at was selected for optimal fluorescence collection. We measured the collection efficiency of the MCF for the fluorescence signal to be 20% collection and transmission of light within the fiber NA. With the phase conjugating holograms saved, the sample was placed in the focal plane and the saved holograms were sequentially projected to scan the focal spot. The holograms were projected by the SLM at a 7-Hz rate. The central focus spot had 1-mW average power. For detection, the excited TPF signal collected by the MCF is deflected by a dichroic mirror (700-nm longpass) to a photomultiplier tube detector (Hamamatsu, H11526-20-NN) [Fig. 1(b)]. For simplicity in this initial demonstration, the axial scan was performed in four planes by moving the fiber in steps. The obtained image (Fig. 6) shows slices of the high-resolution, high-contrast TPF image. The and slices of the image demonstrate axial sectioning, with a depth of field determined by the of the mode, in this case, .1 The and slices in Fig. 6 were obtained by interpolation of the four data points using the software ImageJ. Fig. 6Two-photon fluorescent image of polystyrene beads stained with Rhodamine 6G dispersed in PDMS. The image was acquired using DPC with the MCF to sequentially create focus spots spaced by . These were scanned at four axial planes separated by . The fluorescence detection was performed at the proximal side of the MCF. Power in focus: 1 mW at image center. Pixel dwell time: 140 ms. The scale bar is . 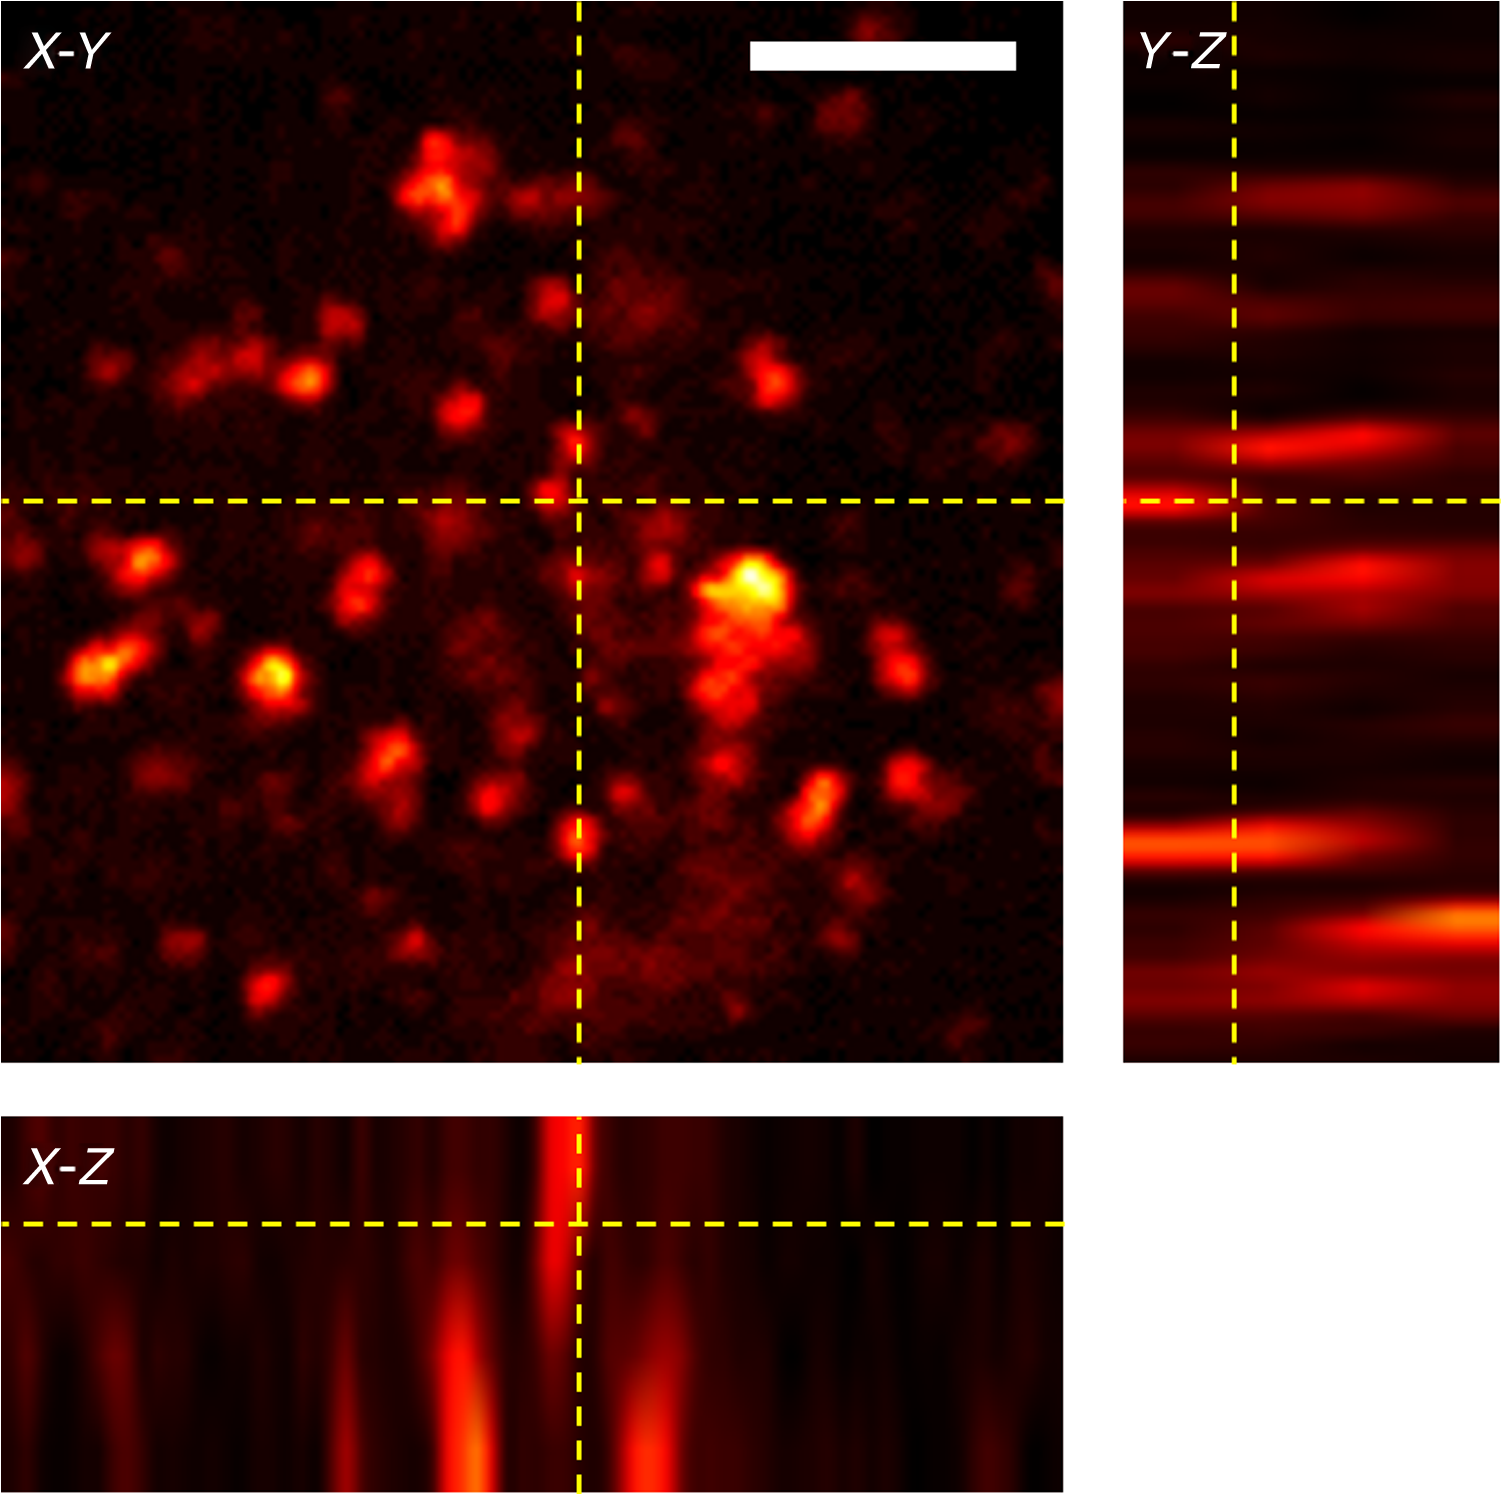 To further demonstrate TPF imaging through the MCF, we imaged clustered cells. We prepared human colon carcinoma (HCT 116) cells by staining them with Rhodamine 6G and mounting them on a microscope slide under a cover slide. The cell clusters provided a good object to test the resolvability of individual cells with the resolution provided by the MCF. Figures 7(a) and 7(b) show a highly dense clustering of HCT 116 cells. In the TPF image, individual cells are clearly distinguishable. Figures 7(c) and 7(d) show a less-dense clustering of cells, in which the TPF image shows individual cells and good agreement with the white light, widefield image. Fig. 7(a) and (c) Two-photon fluorescent image of HCT 116 cells stained with Rhodamine 6G. The images were acquired using DPC with the MCF to sequentially create focus spots spaced by . The fluorescence detection was performed at the proximal side of the MCF. Power in focus: 1 mW at image center. Pixel dwell time: 140 ms. (b) and (d) The corresponding white light, widefield images of the cells. The scale bars are . 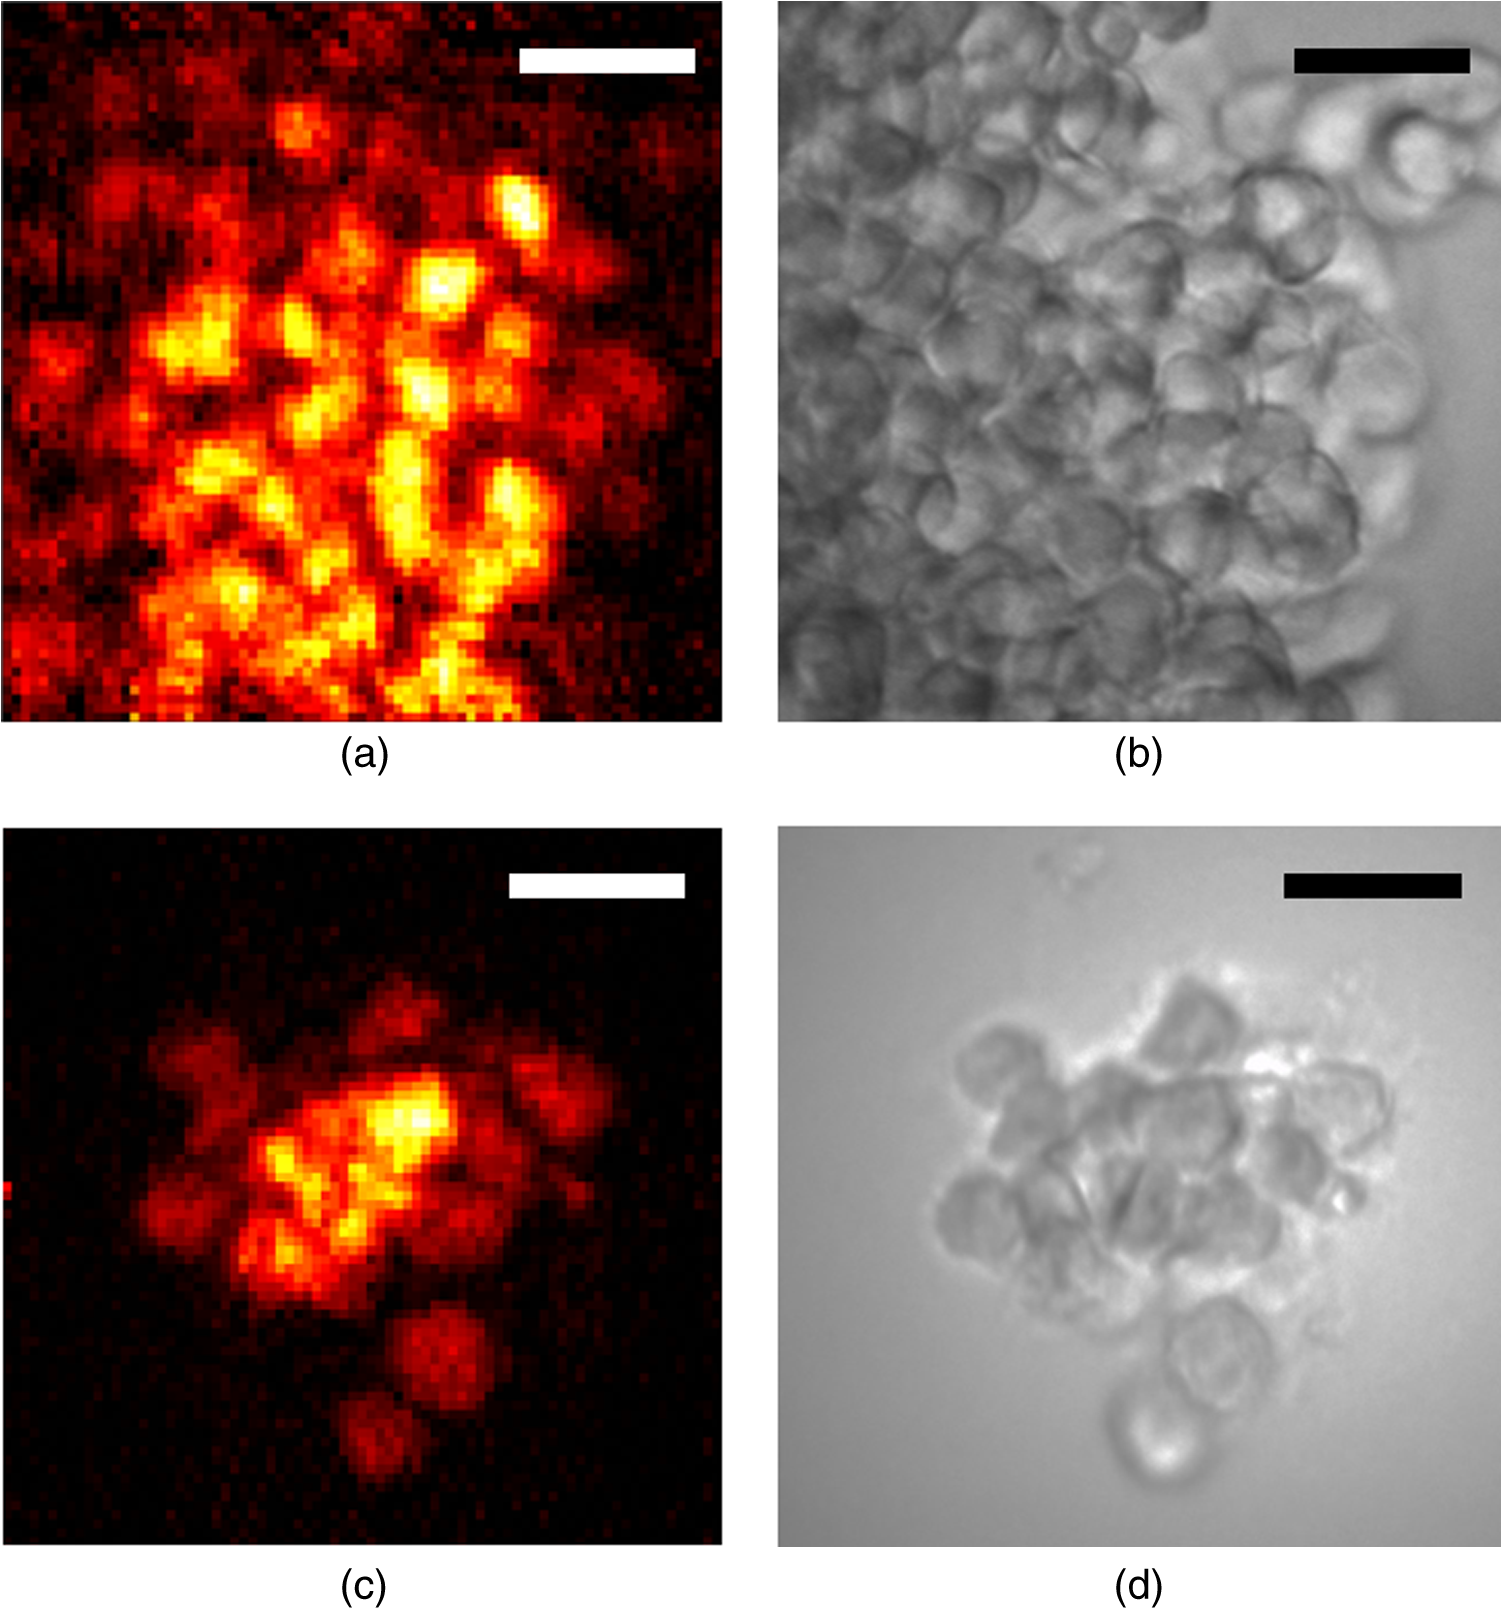 6.Discussion and ConclusionWe have presented wavefront shaping for focusing ultrashort pulses through commercially available MCFs. In this paper, we utilized DPC for the wavefront calibration and focusing. DPC allows for a single-shot calibration for focusing to a single point at the distal end of the fiber. DPC focusing with the MCF yielded SBR of , which was sufficient for TPF imaging through the MCF. It should be noted that the image was formed despite the suboptimal collection efficiency of the MCF, a result of the cores covering only of the fiber facet. To overcome this problem, Andresen et al.17 designed a double-clad fiber to increase the collection efficiency of their MCF endoscope. Of course, implementing a similar approach for increased light collection efficiency would require a custom designed fiber. Furthermore, in this implementation, we did not include any chromatic dispersion compensation because of the relatively short length of the fiber. Although, we could expect further improvement in the excited TPF signal by prechirping the pulse. The commercially available MCFs allowed for an imaging field of view and resolution currently not possible with highly spaced core MCFs. The small core diameters propagate only a few modes, thus limiting modal dispersion. Additionally, we have shown that the commercially available MCFs provide benefits due to their quasiperiodic and high-density core arrangement. Specifically, these offer an increased field of view due to the suppression and spreading of the diffraction orders. To understand what limits the field of view, we simulated focusing at different axial and radial distances and found that the optimal focusing distance is determined by the distance at which the mode and MCF diameters allow for focal spot contribution from all cores. This is in contrast to MMFs and confocal use of MCFs, which operate optimally near the distal end facet. We also explored the unique characteristics of coherence-gated DPC with the fundamental mode and the higher order mode. We found that when phase conjugating the mode of the MCF that most of the energy stayed in the after propagating through the fiber. The MCF length that we used had a minimal spread in intercore group delay. Further lengthening the fiber would increase the delay between cores and reduce the number of cores participating in the phase conjugation. On the other hand, a shorter fiber would increase the number of cores contributing and would increase the focal spot power. Future work on the multiphoton MCF endoscope should enable dual mode imaging and high speed scanning. Traditionally, MCFs have been used for widefield endoscopic imaging. Combining a widefield imaging modality with TPF imaging would provide a powerful tool for endoscopic use. Also, in a previous paper,27 we showed that the mode exhibits a large scan range when a linear phase gradient is applied to the DPC hologram. This “memory effect” ability could be utilized to increase the imaging speed with high speed galvo-mirror scanning within a single calibration point, or with high speed digital mirror SLMs.33 It should be noted that the DPC process through the MCF is sensitive to bending, although significantly less than MMFs.27 This sensitivity would confine the use of the endoscope to a rigid housing, while research progresses on a solution to the bending problem. With the current prospects, the MCF endoscope shows potential use in high-resolution, TPF imaging inside difficult to reach spaces, such as in cochlear, retinal, or brain imaging. In conclusion, we have demonstrated lensless focusing of ultrashort pulses through a commercially available MCF for TPF imaging. We characterized the focusing of ultrashort pulses through an MCF using coherence-gated DPC. Importantly, we showed that DPC can put most phase-conjugated power back into the coherence-gated mode. Thus, implying that coherence-gated DPC can overcome the limits of modal dispersion. Finally, we demonstrated optical sectioning with TPF imaging on a 3-D matrix of dispersed fluorescent beads and we also showed cellular imaging through the MCF. These results indicate the potential of high-density MCFs for integration into high-resolution TPF endoscope imaging. AcknowledgmentsWe thank Thomas Lanvin for providing cell samples. This project was partially conducted with support from the Bertarelli Program in Translational Neuroscience and Neuroengineering (No. 10271) and the Wyss Center for Bio- and Neuro-Engineering (No. 10455). D.B.C. acknowledges support from the “EPFL Fellows” fellowship program cofunded by Marie Curie, FP7 Grant Agreement No. 291771. ReferencesW. R. Zipfel, R. M. Williams and W. W. Webb,
“Nonlinear magic: multiphoton microscopy in the biosciences,”
Nat. Biotechnol., 21 1369
–1377
(2003). http://dx.doi.org/10.1038/nbt899 NABIF9 1087-0156 Google Scholar
F. Helmchen and W. Denk,
“Deep tissue two-photon microscopy,”
Nat. Methods, 2 932
–940
(2005). http://dx.doi.org/10.1038/nmeth818 1548-7091 Google Scholar
I. Pavlova et al.,
“Multiphoton microscopy as a diagnostic imaging modality for lung cancer,”
Proc. SPIE, 7569 756918
(2010). http://dx.doi.org/10.1117/12.841017 PSISDG 0277-786X Google Scholar
S. W. Perry, R. M. Burke and E. B. Brown,
“Two-photon and second harmonic microscopy in clinical and translational cancer research,”
Ann. Biomed. Eng., 40 277
–291
(2012). http://dx.doi.org/10.1007/s10439-012-0512-9 ABMECF 0090-6964 Google Scholar
E. E. Hoover and J. A. Squier,
“Advances in multiphoton microscopy technology,”
Nat. Photonics, 7 93
–101
(2013). http://dx.doi.org/10.1038/nphoton.2012.361 NPAHBY 1749-4885 Google Scholar
J. N. D. Kerr and W. Denk,
“Imaging in vivo: watching the brain in action,”
Nat. Rev. Neurosci., 9 195
–205
(2008). http://dx.doi.org/10.1038/nrn2338 NRNAAN 1471-003X Google Scholar
W. Gobel et al.,
“Miniaturized two-photon microscope based on a flexible coherent fiber bundle and a gradient-index lens objective,”
Opt. Lett., 29 2521
(2004). http://dx.doi.org/10.1364/OL.29.002521 OPLEDP 0146-9592 Google Scholar
M. T. Myaing, D. J. MacDonald and X. Li,
“Fiber-optic scanning two-photon fluorescence endoscope,”
Opt. Lett., 31 1076
–1078
(2006). http://dx.doi.org/10.1364/OL.31.001076 OPLEDP 0146-9592 Google Scholar
D. R. Rivera et al.,
“Compact and flexible raster scanning multiphoton endoscope capable of imaging unstained tissue,”
Proc. Natl. Acad. Sci. U. S. A., 108 17598
–17603
(2011). http://dx.doi.org/10.1073/pnas.1114746108 Google Scholar
O. Ferhanoglu et al.,
“A 5-mm piezo-scanning fiber device for high speed ultrafast laser microsurgery,”
Biomed. Opt. Express, 5 2023
(2014). http://dx.doi.org/10.1364/BOE.5.002023 BOEICL 2156-7085 Google Scholar
B. A. Flusberg et al.,
“Fiber-optic fluorescence imaging,”
Nat. Methods, 2 941
–950
(2005). http://dx.doi.org/10.1038/nmeth820 1548-7091 Google Scholar
H. H. Hopkins and N. S. Kapany,
“A flexible fibrescope, using static scanning,”
Nature, 173 39
–41
(1954). http://dx.doi.org/10.1038/173039b0 Google Scholar
D. Kim et al.,
“Toward a miniature endomicroscope: pixelation-free and diffraction-limited imaging through a fiber bundle,”
Opt. Lett., 39 1921
(2014). http://dx.doi.org/10.1364/OL.39.001921 OPLEDP 0146-9592 Google Scholar
K. L. Reichenbach and C. Xu,
“Numerical analysis of light propagation in image fibers or coherent fiber bundles,”
Opt. Express, 15 2151
(2007). http://dx.doi.org/10.1364/OE.15.002151 OPEXFF 1094-4087 Google Scholar
X. Chen, K. L. Reichenbach and C. Xu,
“Experimental and theoretical analysis of core-to-core coupling on fiber bundle imaging,”
Opt. Express, 16 21598
(2008). http://dx.doi.org/10.1364/OE.16.021598 OPEXFF 1094-4087 Google Scholar
A. J. Thompson et al.,
“Adaptive phase compensation for ultracompact laser scanning endomicroscopy,”
Opt. Lett., 36 1707
(2011). http://dx.doi.org/10.1364/OL.36.001707 OPLEDP 0146-9592 Google Scholar
E. R. Andresen et al.,
“Toward endoscopes with no distal optics: video-rate scanning microscopy through a fiber bundle,”
Opt. Lett., 38 609
–611
(2013). http://dx.doi.org/10.1364/OL.38.000609 OPLEDP 0146-9592 Google Scholar
E. R. Andresen et al.,
“Two-photon lensless endoscope,”
Opt. Express, 21 20713
–20721
(2013). http://dx.doi.org/10.1364/OE.21.020713 OPEXFF 1094-4087 Google Scholar
I. N. Papadopoulos et al.,
“Focusing and scanning light through a multimode optical fiber using digital phase conjugation,”
Opt. Express, 20 10583
–10590
(2012). http://dx.doi.org/10.1364/OE.20.010583 OPEXFF 1094-4087 Google Scholar
T. Čižmár and K. Dholakia,
“Exploiting multimode waveguides for pure fibre-based imaging,”
Nat. Commun., 3 1027
(2012). http://dx.doi.org/10.1038/ncomms2024 NCAOBW 2041-1723 Google Scholar
S. Bianchi and R. Di Leonardo,
“A multi-mode fiber probe for holographic micromanipulation and microscopy,”
Lab Chip, 12 635
–639
(2012). http://dx.doi.org/10.1039/C1LC20719A LCAHAM 1473-0197 Google Scholar
Y. Choi et al.,
“Scanner-free and wide-field endoscopic imaging by using a single multimode optical fiber,”
Phys. Rev. Lett., 109 203901
(2012). http://dx.doi.org/10.1103/PhysRevLett.109.203901 PRLTAO 0031-9007 Google Scholar
A. M. Caravaca-Aguirre et al.,
“Real-time resilient focusing through a bending multimode fiber,”
Opt. Express, 21 12881
(2013). http://dx.doi.org/10.1364/OE.21.012881 OPEXFF 1094-4087 Google Scholar
E. E. Morales-Delgado et al.,
“Delivery of focused short pulses through a multimode fiber,”
Opt. Express, 23 9109
(2015). http://dx.doi.org/10.1364/OE.23.009109 OPEXFF 1094-4087 Google Scholar
E. E. Morales-Delgado, D. Psaltis and C. Moser,
“Two-photon imaging through a multimode fiber,”
Opt. Express, 23 32158
(2015). http://dx.doi.org/10.1364/OE.23.032158 OPEXFF 1094-4087 Google Scholar
Y. Kim et al.,
“Adaptive multiphoton endomicroscope incorporating a polarization-maintaining multicore optical fibre,”
IEEE J. Sel. Top. Quantum Electron., 22 1
–8
(2015). http://dx.doi.org/10.1109/JSTQE.2015.2488283 IJSQEN 1077-260X Google Scholar
N. Stasio et al.,
“Light control in a multicore fiber using the memory effect,”
Opt. Express, 23 30532
(2015). http://dx.doi.org/10.1364/OE.23.030532 OPEXFF 1094-4087 Google Scholar
G. P. J. Laporte et al.,
“Enhanced resolution in a multimode fiber imaging system,”
Opt. Express, 23 27484
(2015). http://dx.doi.org/10.1364/OE.23.027484 OPEXFF 1094-4087 Google Scholar
K. Okamoto, Fundamentals of Optical Waveguides, 2nd ed.Academic Press, San Diego
(2005). Google Scholar
E. R. Andresen et al.,
“Measurement and compensation of residual group delay in a multi-core fiber for lensless endoscopy,”
J. Opt. Soc. Am. B, 32 1221
(2015). http://dx.doi.org/10.1364/JOSAB.32.001221 JOBPDE 0740-3224 Google Scholar
O. Katz et al.,
“Focusing and compression of ultrashort pulses through scattering media,”
Nat. Photonics, 5 372
–377
(2011). http://dx.doi.org/10.1038/nphoton.2011.72 NPAHBY 1749-4885 Google Scholar
N. Stasio et al.,
“Towards new applications using capillary waveguides,”
Biomed. Opt. Express, 6 4619
(2015). http://dx.doi.org/10.1364/BOE.6.004619 BOEICL 2156-7085 Google Scholar
D. B. Conkey, A. M. Caravaca-Aguirre and R. Piestun,
“High-speed scattering medium characterization with application to focusing light through turbid media,”
Opt. Express, 20 1733
(2012). http://dx.doi.org/10.1364/OE.20.001733 OPEXFF 1094-4087 Google Scholar
BiographyDonald B. Conkey is a postdoctoral fellow at the École Polytechnique Fédérale de Lausanne (EPFL). He received his MS and PhD degrees from the University of Colorado at Boulder. His research interests include biomedical imaging, plasma-mediated ablation, holography, endoscopy, and light control through scattering materials. Nicolino Stasio received his MS cum laude in biomedical engineering from Sapienza University of Rome in 2012. In 2013, he joined the Laboratory of Optics at the EPFL as a PhD student. His interests are optical fiber-based endoscopy, biomaging, and digital holography. Edgar E. Morales-Delgado received his bachelor’s degree in telecommunications engineering from the National Autonomous University of Mexico in 2010, including exchange programs at Stanford University and Rose Hulman Institute of Technology. He completed his MSc in electrical engineering at King Abdullah University of Science and Technology and became a doctoral assistant in photonics at EPFL in 2013. Research interests include microscopy, biomedical and endoscopic imaging, wavefront shaping, digital holography, additive manufacturing, and augmented reality displays. Marilisa Romito received her bachelor’s degree in physics from the University of Calabria in 2011 and her master’s degree in physics of matter in 2014, magna cum laude. Her research interests include ultrashort pulse laser ablation, multiphoton microscopy, optofluidics, and liquid crystals. Christophe Moser is an associate professor of optics. He obtained his PhD at the California Institute of Technology, and cofounded and was the CEO of Ondax for 10 years before joining EPFL in 2010. His interests are holography for imaging, endoscopy, head-mounted displays, and optics for solar concentration. Demetri Psaltis is a professor of optics, director of the Optics Laboratory, and dean of the Engineering Schools at the EPFL. He joined the California Institute of Technology in 1980 and moved to EPFL in 2006. His current research interests include imaging, holography, biophotonics, and optofluidics. He is a fellow of the IEEE, Optical Society of America, European Optical Society, and the Society for Photo-Optical Systems Engineering, and has received numerous awards for his work. |