
|
|
1.IntroductionGene therapy aims to insert foreign DNA into cells for replacement or inhibition of faulty or missing genetic material. Viral vectors represent a way which is the most efficient and the most insecure at the same time, due to side effects of increased immune and inflammatory response, toxicity, and cancer induction.1,2 As an alternative, applying nonviral vectors for gene therapy is gradually increasing. The use of DNA plasmids (pDNA) has a number of advantages over viral vectors, including good safety records, production of the pDNA to a great extent, possibility of repeated administration, and no limitation on DNA insert size. Two physical methods, electroporation (EP) and sonoporation (SP), appear to be very promising for pDNA transfer into almost all biological tissues, with the most interest for muscle3–9 and tumor10–13 targeting. Both SP and EP share a concept of a “pore” which is used for explanation of pDNA translocation across the cell membrane. The initial explanation for DNA electrotransfer was that transport of the DNA is facilitated by electrophoretic forces.14 In later studies, the mechanism of pDNA electrotransfer was updated with pDNA binding to the cell surface,15 and the experimental setup for the electrophoretic motive force increasing efficiency of pDNA entry into the skeletal muscles was realized by combining short (microsecond duration) high voltage (HV) and long (millisecond duration) low voltage (LV) pulses.16,17 Currently, the mechanism of pDNA electrotransfection across the membrane can be determined as a process of several steps, consisting of electric pulse induced cell membrane destabilization, pDNA electrophoresis toward electroporated membrane, pDNA–membrane interaction/adsorbtion on electroporated membrane, formation of pDNA aggregates in the membrane, and pDNA translocation into the cytoplasm during the postpulse phase.18 These postpulse events were recently demonstrated to be associated with endocytosis.19 SP is a noninvasive option for pDNA delivery into cells and tissues located deeper within a body. The key mechanism of SP is a contrast agent microbubble (MB) cavitation induced by ultrasound (US).7,9,12 Cavitation is a process, which includes formation of a gas bubble, its oscillation and growth in size (with the constant addition of gas dissolved in a liquid media), and bubble collapse. Respectively, the MB oscillation is known as a stable cavitation and the MB collapse is called an inertial cavitation. Both stable and inertial MB cavitation produce pores, which had been visualized as mechanical defects on the cellular membrane ranging from hundreds of nanometers to submicron size.20,21 Large size pores produced by MB inertial cavitation allow the direct delivery of pDNA into the cytoplasm bypassing the pathway of endocytosis.22,23 Nevertheless, some authors attribute sonotransfection also to the clathrin-dependent mechanism of endocytosis.24 Despite the success for SP assisted pDNA transfection, short expression duration of delivered gene and low-transfection efficiency remains the main drawbacks for the application of SP for clinical gene therapy. The aim of this study was to develop a simple, reliable, low cost, and animal life preserving method to monitor the marker gene expression in a small animal model. Up to now, such in vivo fluorescence detection without exogenous intervention (optical biopsy) had been applied by using spectrophotometers and to the larger scale—fluorescence imaging devices. The fluorescence reflectance imaging is the simplest and most applied method associated with noninvasive macroscopic fluorescence detection in vivo, requiring tissue illumination with the expanded light beam and then capturing the fluorescence emitted from the tissue subsurface. The invention of new imaging strategies improved quantitative and depth related information on fluorophores in vivo, even with possible combination of the methods with complementing features, including in vivo confocal microscopy, in vivo flow cytometry, multispectral planar imaging, fluorescence lifetime imaging, fluorescence molecular tomography. The development of novel imaging probes became focused on the indirect reporter strategy—when a reporter gene which encodes the fluorescent protein is introduced into the cell. Transcription of the gene results in fluorescent protein production. Some gene therapy pharmacokinetic studies employing fluorescent protein imaging in vivo are focused to: the promoter activation/inactivation, e.g., investigating gene expression kinetics by tracking fluorescent protein signal appearance rate and half-life; or using fluorescence color-changing proteins for the time determination since the promoter activation; protein interaction investigation by employing fluorescence resonance energy transfer; real-time mRNA labeling within transgenic animals (most commonly mice).25 EP and SP were selected as methods for enhanced green fluorescent protein (EGFP) coding plasmid delivery in vivo. We tested the combined fluorescence spectroscopy and multispectral imaging setup for a real-time and noninvasive detection of EGFP expression levels. While tissue optical biopsy is applied for almost any type of fluorophore detection in line with the recent advances for gene therapy applications, surprisingly, the assessment of gene expression levels after EP or SP in vivo is mainly performed only employing fluorescence stereomicroscopy19,24,26 or highly sophisticated commercial live animal imaging systems.27–29 By using fluorescence spectroscopy point measurements and multispectral imaging, we examined the EGFP fluorescence intensity levels in live mouse tibialis cranialis muscle, which is close to the mouse skin surface. To estimate the sensitivity of in vivo data, we compared it with ex vivo data, measuring the same fluorescence parameters at the muscle surface or in the transverse muscle section. We had investigated different parameters for the noninvasive quantification of EGFP coding plasmid transfection efficiency: area of EGFP positive fibers, integral intensity, and mean intensity of EGFP fluorescence. 2.Materials and Methods2.1.AnimalsC57BL/6 line mice (female and male, 4–20 weeks old) were purchased from Biochemistry Institute (Vilnius University, Lithuania) and used for the experiments. All animals were kept in the same room at light/dark cycle, 20 to 22°C temperature, humidity and ad libitum access to food and water. Before the experiment, the fur on the hind leg limbs of the mice was removed with a depilatory cream. Prior to plasmid intramuscular injection and subsequent EP or SP, all mice were anesthetized by intraperitoneal injection of ketamine (; Richter Pharma AG, Wels, Austria) and xylazine (; Eurovet Animal Health B.V., Bladel, Netherlands). The animals woke up within 1 h and appeared normally active. All experiments were approved by the Lithuanian Republic Alimentary and Veterinary Public Office (Nr. 0236). 2.2.PlasmidPlasmid pEGFP-Nuc Vector coding green fluorescent protein (GFP) mutant EGFP was used in all experiments. Mice undergoing EP received of EGFP coding plasmid which was diluted in of 0.9% NaCl. Mice undergoing SP received of EGFP coding plasmid, which was initially prepared in of 0.9% NaCl and then mixed with of Sonovue (Bracco, Switzerland) MB. Sonovue MB were prepared in 0.9% NaCl according to manufacturer recommendations and counted under the hematocytometer revealing a final concentration of . EGFP coding plasmid was injected into a tibialis cranialis muscle of both mouse legs using insulin syringe from the distal to proximal direction, totally for each muscle. 2.3.DNA ElectrotransferTwo stainless steel electrodes smeared with ECG conductive gel were applied on both sides of tibialis cranialis muscle, above the skin and 4 to 5 mm apart. Muscle EP was performed using electroporator manufactured in Kaunas University of Technology, Lithuania. Three different combinations of electric pulses were used: (1) one square-wave HV pulse with a length of and amplitude of ; (2) 8 LV pulses at 1 Hz frequency with a length of 20 ms and amplitude of ; (3) combination of 1 HV + 4 LV pulses, with the LV pulse length of 100 ms and pulse amplitude reduced to . The time delay between HV and LV pulses was 1 s. 2.4.DNA SonotransferFor muscle SP, 1 MHz US at power density of [20% or 100% duty cycle (DC)] was delivered for 5 min through 6 mm transducer, using Sonitron 2000 (Artison Corp., OK) sonoporator. US conductive gel was used to ensure a good contact between the transducer and the skin above the tibialis cranialis muscle. 2.5.Experimental GroupsFour to six mice were selected randomly for each of six experimental groups: (1) the control group mice receiving only EGFP coding plasmid; (2) EP group receiving EGFP coding plasmid followed by 1 HV electric pulse; (3) EP group receiving EGFP coding plasmid followed by 1 HV + 4 LV electric pulses; (4) EP group receiving EGFP coding plasmid followed by 8 LV electric pulses; (5) SP group receiving EGFP coding plasmid followed by US irradiation at 100% DC, and (6) SP group receiving EGFP coding plasmid followed by US irradiation at 20% DC. EP or SP was applied on the muscle 5 min after EGFP coding plasmid injection. 2.6.Fluorescence Point Measurements and Multispectral ImagingEGFP fluorescence in vivo was observed at 2, 3, 7, 14, and 30 days then 3, 6, and 12 months after electro- or sonotransfection, using optical biopsy setup depicted in Fig. 1. Fluorescence spectra were measured with a fiber optic spectrofluorimeter (AvaSpec ULS2048L, Avantes, Netherlands) which was equipped with a Y-shaped fiber bundle (FC-UV400-2-SR, Avantes, Netherlands). The central fiber of the fiber bundle was used to conduct the excitation light to the tissue, and the six circularly arranged peripheral fibers were used to collect the fluorescence signal. DPSS (473 nm) laser (5-473-DPSS-0.1, CW, max. output 100 mW, Altechna, Lithuania) was used for skin and muscle fluorescence excitation, and a long pass filter () was inserted into the detection light path to cut off the scattered excitation light. Nine spectra were measured at the skin surface perpendicularly to a muscle fiber length: three at the distal, three at the central, and three at the proximal location of muscle using 300 ms integration time. Spectra from the same muscle location were averaged and mean intensity at 512 to 515 nm was calculated. EGFP fluorescence kinetics is presented as a mean value (averaged from distal, central, and proximal locations) of the mean. Mice in all experimental groups were killed 12 months after electro- or sonotransfection by using gas. Then, the skin above the muscle was cut and removed. Fluorescence spectra on the surface of the muscle were acquired as described previously, with respect to distal, central, and proximal muscle location. EGFP fluorescence spectra ex vivo were averaged and represented as mean value (at 515 nm) of the mean. In parallel, the multispectral imaging system depicted in Fig. 1 was employed to visualize the distribution of EGFP fluorescence on the muscle surface and on the skin above the muscle. The system consisted of a multispectral imaging camera Nuance EX (model: N-MSI-EX, CRi), a fiber-optic cable for delivering laser excitation (473 nm) to the skin surface and LP filter () blocking the scattered laser light. The images were acquired over the whole mouse leg in the wavelength range 450 to 950 nm with the scanning step of 10 nm and the filtering bandwidth of 20 nm (FWHM). The subsequent processing of the images was performed using CRi Nuance software. 2.7.Tissue Collection, Fixation, and ProcessingImmediately after the measurements ex vivo, the tibialis cranialis muscles were dissected, weighed (Kern, ABS 80-4, Germany) and snap frozen in 2-methylbutan precooled in liquid nitrogen. 2.7.1.Protein extractionMuscles were placed in tubes, and ice-cold lysis buffer (Tris-HCl 50 mM, EDTA 1 mM, EGTA 1 mM, Triton X-100 1%) with 2% of protease inhibitor cocktail was added for 10 mg of muscle. Then, the muscles were minced with a small scissors for 2 min at a comfortable rate for breaking it into small pieces. Muscles homogenization was finished by applying homogenizer for 10 s at medium intensity. All homogenized samples were placed into a freezer at for 2 h. Then, the samples were removed from the freezer and were shaken at 4°C for 60 min. Thereafter, the samples were centrifuged at 13,000 g in 4°C for 10 min and a supernatant was taken for the fluorescence point measurements. 2.7.2.Preparation of samples for histological examinationThe frozen muscles were sliced in half at a perpendicular direction to a fiber length. Then, the muscles were mounted on a specimen disc using an embedding medium (Tissue-Tek, OCT compound, Sakura Finetek USA Inc., Torrance, California) and transferred into a cryostat chamber (Leica CM1850, Leica Instruments GmbH, Vetzlar, Germany). The temperature of each sample was equilibrating for 30 min, then the specimen disc was attached to the holder and the muscle was sectioned with a thickness of (3 sections per muscle). Then the sections were mounted on an adhesive microscope slide and allowed to dry for 5 min before fixation. Muscle sections were fixed using the formalin vapor fixation protocol reported by Jockusch et al.30 Free EGFP is extremely soluble; therefore the fixation was needed for the monitoring of EGFP labeled muscle fluorescence. Formalin vapor fixation prevents the loss of EGFP from the cytoplasmic areas and prevents it from spilling over the section. 30 For vapor fixation, the filter paper was soaked with 37% formaldehyde (F8775, Sigma) and exposed in a tightly closed plastic dish, for 4 h at together with the microscope slide mounted muscle sections. Fluorescence of transverse muscle sections was observed by Leica DM 3000 fluorescence microscope (excitation: 450 to 490 nm; dichroic: ; emission: LP 515-nm; Leica, Vetzlar, Germany) equipped with HC PL Fluoritar 50650 objective () and Leica DFC 490 camera at magnification. 2.8.Analysis of Multispectral ImagesAcquired multispectral images of muscles were processed and analyzed using the MATLAB (MathWorks, Natick, Massachusetts) software. Some of the in vivo multispectral images of a single leg of a mouse were not precisely aligned because of small leg movements [Fig. 2(a)]. Image registration was required in such cases. During registration process, all images were aligned in respect to the image of lowest wavelength of 450 nm. SURF feature detector31 was used to find, describe, and compare key points between images of adjacent wavelengths (e.g., 450, 460, 470,…, 950 nm). Corresponding points were matched to acquire transformation matrix that would allow registering image of higher wavelength to adjacent image of lower wavelength. Result of registration of images of Fig. 2(a) is shown in Fig. 2(b). Fig. 2Image processing steps: (a) initially acquired RGB image (zoomed) with unalignment between concurrent images at different wavelengths; (b) RGB image after registration; (c) manual selection of muscle region; insert: muscle blob for parameter acquisition; (d) automatic segmentation of fluorescent and nonfluorescent regions; (e) manual segmentation of fluorescent and nonfluorescent regions employing spectrum analysis for each pixel in muscle area. User defines two points: (1) in the fluorescent region, (2) in nonfluorescent region; insert: typical spectra of fluorescent and nonfluorescent points.  To acquire parameters of in vivo images, manual segmentation of muscle region was carried out. Figure 2(c) shows graphical user interface made in MATLAB. The interface allows the user to select points in the RGB image depicting the border of the muscle. The software calculates the area of selected muscle region by counting pixels inside the specified border. Using blob analysis functions of MATLAB Image Processing Toolbox, a minor axis length of muscle blob is found. This length approximately corresponds to the diameter of the muscle. The goal of the next processing step was to find the fluorescent region in the muscle. Initial segmentation was accomplished by thresholding muscle blob for an image of 510 nm wavelength. This wavelength (green light) corresponds to the maximum of EGFP spectral band; therefore green fluorescent regions (with the presence of EGFP) were likely much more intensive than the nonfluorescent regions (NFs). Automatic threshold was found by using Otsu’s method.32 In this iterative method, pixels are divided by threshold so that the sum of the spread of foreground and background pixels is at its minimum. The result of automatic segmentation is shown in Fig. 2(d). Red border delineates the fluorescent region. Automatic segmentation does not always return satisfactory results. If the border delineation of the fluorescent region is uncertain, the manual segmentation is possible. In this step, user defines two points (1, 2) in the image—one corresponds to fluorescent region (F), and the other to NF. Figure 2(e) shows the segmentation result after spectrum analysis for each pixel in the muscle area [same input image as in Fig 2(d)]. The regions around defined points are used to find mean spectrum (), , of both points. Similarly, spectrums are acquired for each current pixel of muscle region (). Spectrum of current pixel is compared with spectrums of fluorescent point and nonfluorescent point acquiring distances and : where is the number of spectral bands. Then, distances are normalized Parameter approaches value “,” if spectrum of currently analyzed pixel is similar to spectrum of fluorescent region and different from spectrum of nonfluorescent region. If the point is more similar to nonfluorescent region, then approaches value of “.”The software combines the parameter and the result from previous automatic segmentation for final segmentation of the muscle: where is weight of pixel from Otsu’s segmentation and is weight of pixel from spectral analysis. If the pixel was segmented as fluorescent in automatic segmentation, then has a value of 1, if it was segmented as nonfluorescent pixel, . of pixel is dependent on value of . If and , then . If , then . Otherwise . The final decision of pixel segmentation is this: if , then pixel is segmented as fluorescent pixel. Therefore, a pixel can be segmented as fluorescent either if it has a spectrum which is much more similar to fluorescent region than nonfluorescent region, or it is slightly more similar to fluorescent region.When the muscle is segmented, parameters of fluorescent regions are acquired. The software calculates area of fluorescent region and muscle diameter. Algorithm also calculates mean and sum intensity values of pixels of fluorescent region in the 510 nm wavelength image. 3.Results3.1.Noninvasive Evaluation of Enhanced Green Fluorescent Protein Transfection Efficiency in Mouse Tibialis Cranialis MuscleTransfection efficiency of EGFP coding plasmid was assessed by two different noninvasive methods: fluorescence multispectral imaging and fluorescence spectroscopy point measurements. Briefly, the principle of multispectral imaging is to acquire concurrent monochrome images of the same object (EGFP fluorescent tibialis cranalis muscle) by using multiple optical band-pass filters [Fig. 3(a)]. The number of tibialis cranialis muscle fluorescence images, each of them taken with a different band-pass filter, forms the image cube with the fluorescence spectrum available at each pixel of an image plane. The initially acquired fluorescence image of mouse leg [Fig. 3(b)] was analyzed using 510 and 520 nm spectral bands, allowing the recovery of the spectral properties of EGFP fluorophore. As it is shown in Fig. 3(c), the muscle localized EGFP emits the specific fluorescence in 510–520 nm spectral region, making the pattern and location of EGFP clearly distinguishable from the skin autofluorescence. Fig. 3(a) Schematic representation of the image cube and (b) the initial fluorescence image stack of EGFP transfected tibialis cranialis muscle acquired in 450 to 950 nm spectral region. (c) The image of tibialis cranialis muscle taken with a (FWHM) band-pass filter used for further analysis to reveal parameters for the noninvasive quantification of EGFP transfection efficiency. The green signal within the marked area indicates the muscle fibers expressing EGFP (image scale bar: 5 mm). (d) Fluorescence spectroscopy point measurements before spectra normalization and (e) after normalization to the same intensity (1) at 613 nm; 64 fluorescence spectra from day 3 of EGFP pharmacokinetics are depicted. 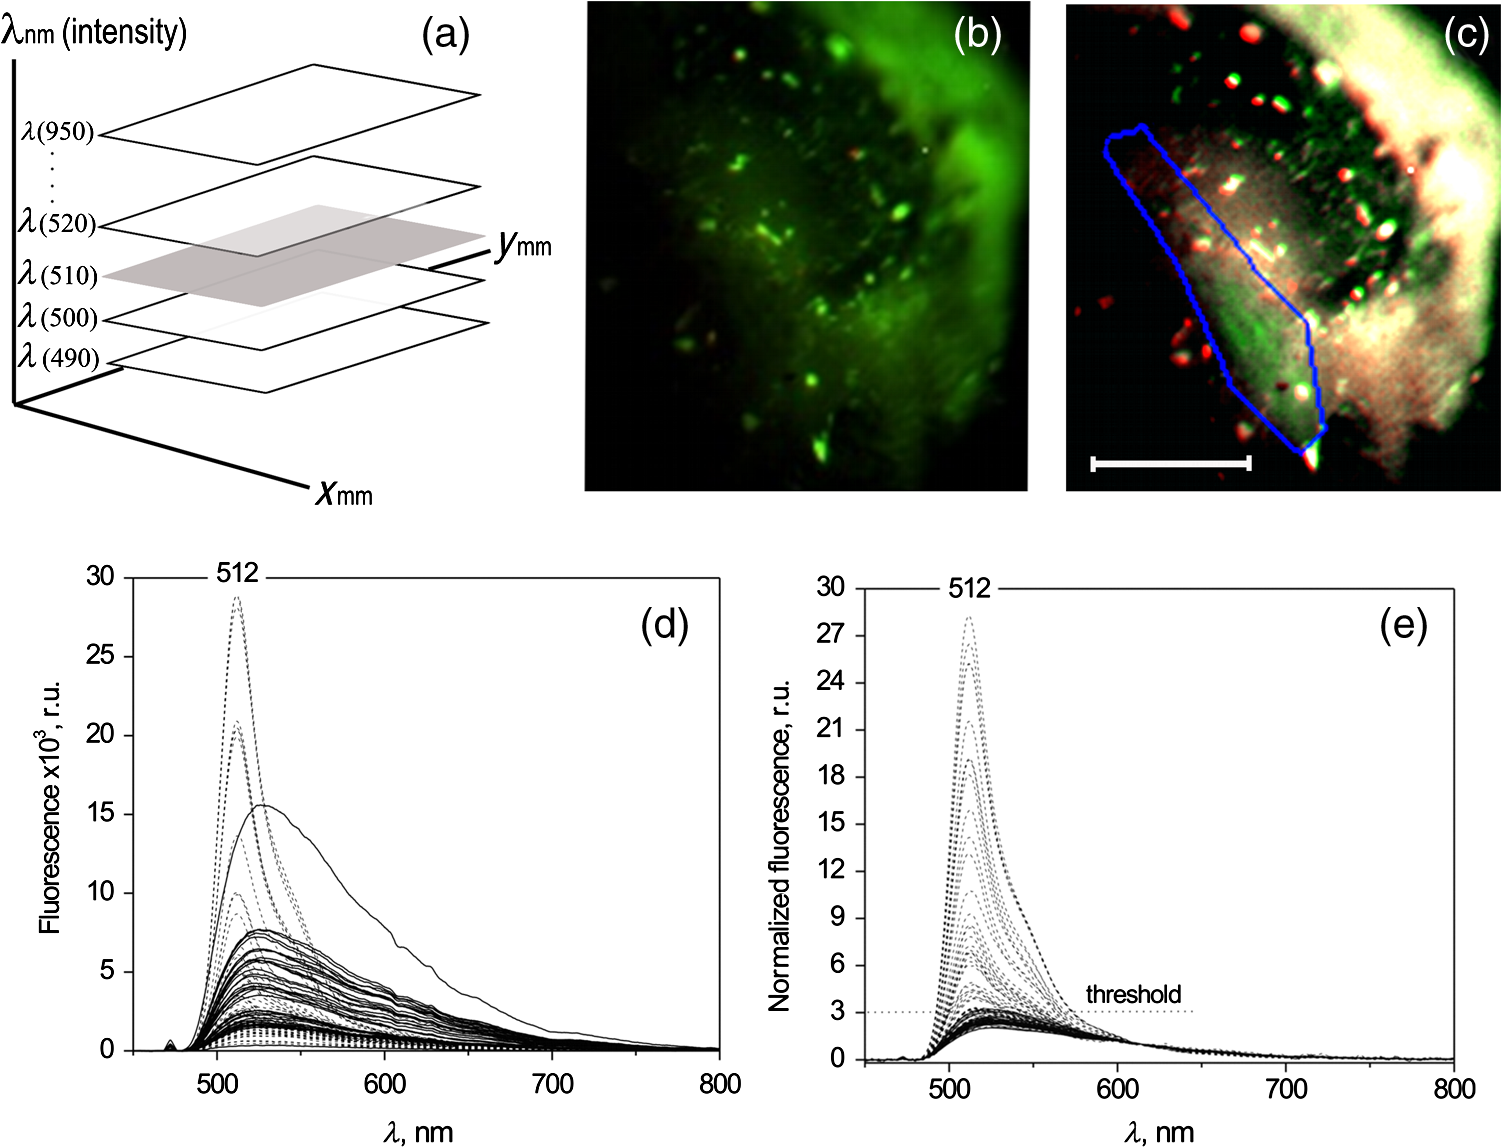 Skin characteristics not to retain EGFP33 make a superficial tibialis cranialis muscle a very suitable model for noninvasive estimation of EGFP expression levels. Under excitation at 473 nm, the autofluorescence of tibialis cranialis muscle as well as the skin above the muscle are characterized by the broad and poorly structured emission bands in 490 to 800 nm spectral region [Fig. 3(d)]. Differently from skin autofluorescence, the spectra of EGFP inside the transfected muscles possess a new fluorescence band with a peak at 512 to 515 nm which differs from tissue autofluorescence both in shape and intensity. In order to distinguish spectral differences related to EGFP emission, all fluorescence spectra were normalized to the same intensity at 613 nm [Fig. 3(e)]. Spectra normalization allowed to compensate the variation of autofluorescence intensity as well as to resolve the spectral overlap between tissue autofluorescence (.) and EGFP fluorescence (.). Initially, we tested the correlation of EGFP fluorescence intensity between in vivo, when the detection fiber is on the skin covering the transfected muscle, and ex vivo, when skin is removed from the muscle and the detection fiber is at the same place of muscle surface. Mice for this experiment were selected randomly and independently from EP or SP protocol. The obtained data [Fig. 4(a)] showed strong linear correlation between EGFP fluorescence measured from the surface of skin and that measured at the surface of muscle (). According to Fig. 4(a), the skin which covered the muscle from above, reduced EGFP fluorescence intensity of muscle surface by a factor of 1.4 on average. Fig. 4(a) Comparison between EGFP fluorescence intensity point measurements from the skin covering muscle in vivo and muscle surface ex vivo; 32 mice with both legs transfected were first measured in vivo (at the day 360) and then killed for ex vivo measurements. (b) Fluorescence data revealing the linear correlation of GFP fluorescence intensity to GFP concentration increase. (c) The linear correlation between EGFP fluorescence detected in vivo and in muscle homogenate; 4 mice were randomly selected for homogenate preparation: control group–1; SP 20% DC–1; EP 8 LV–1; EP 1 HV + 4 LV–1 mice.  As the absolute control, the homogenates of the transfected muscles were made and the fluorescence of EGFP in muscle homogenate was compared with the average EGFP fluorescence intensity measured at the surface of the same muscle. At the initial step of this investigation, the commercially available recombinant GFP (Pierce, Thermo Scientific) was dissolved in homogenate of control mice muscle (with no pDNA transfected) and used as the calibration etalon. In Fig. 4(b), the fluorescence intensity at 512 nm is plot against the etalon GFP concentration, revealing the linear dependence in 4 nM to interval. During the next step, using the same experimental setup and the same spectra registration parameters we measured fluorescence of the muscle homogenate transfected with EGFP [Fig. 4(c)]. To match EGFP concentration with the etalon GFP concentration calibration curve, the -axis of Fig. 4(b) should be multiplied by , where (or ) is the transmittance of etalon GFP (or EGFP) to the excitation wavelength, and (or ) are the fluorescence quantum yields of the etalon GFP (or EGFP). Such correction of Y-scale for Fig. 4(b) may allow calibrating the fluorescence of EGFP in muscle homogenate with EGFP concentration. Similarly to the EGFP fluorescence correlation obtained between muscle surface and skin surface [Fig. 4(a)], data in Fig. 4(c) show strong correlation of EGFP fluorescence intensity measured at muscle surface and in muscle homogenate (). We conclude that the strong correlations between EGFP levels detected at the skin surface and the EGFP levels ex vivo allow the application of noninvasive fluorescence diagnostics for the in vivo evaluation of EGFP transfection efficiency in mice tibialis cranialis muscle. 3.2.Long-Term Evaluation of Enhanced Green Fluorescent Protein Fluorescence IntensityFurther in this study we applied EP and SP using various electric field or US output parameters optimized by different groups3,19,26,34,35 for pDNA delivery into skeletal muscle. By using noninvasive fluorescence spectroscopy point measurements, we monitored the time dependence of EGFP fluorescence intensity in tibialis cranialis muscle for the period of 1 year. Data on day 7 and 360 were analyzed for statistical significance (Table 1). Table 1Data in Fig. 5(a) analyzed for significance 7 days and 360 days after transfection.
Note: ***Represents a statistically significant increase of GFP fluorescence intensity (p<0.001), NS: not significant increase. Fig. 5Noninvasive monitoring of EGFP pharmacokinetics in vivo by using fluorescence spectroscopy point-measurements. (a) Interindividual variability of EGFP expression after muscle electro- or sonotransfection represented by the percentage of EGFP positive muscles comparing to all of EP or SP affected muscles. (b) For EP assisted EGFP coding plasmid delivery, 8 LV (closed squares), 1 HV (crossed squares) and 1 HV + 4 LV (open squares) electric pulses were used. For SP assisted delivery either 100% DC US (filled triangles) or 20% DC US (open triangles) was applied. The number of mice in experimental groups: control group–4; SP 20% DC group–6; SP 100% DC–4; EP 1 HV–6; EP 8 LV–6; EP 1 HV + 4 LV–6 mice. 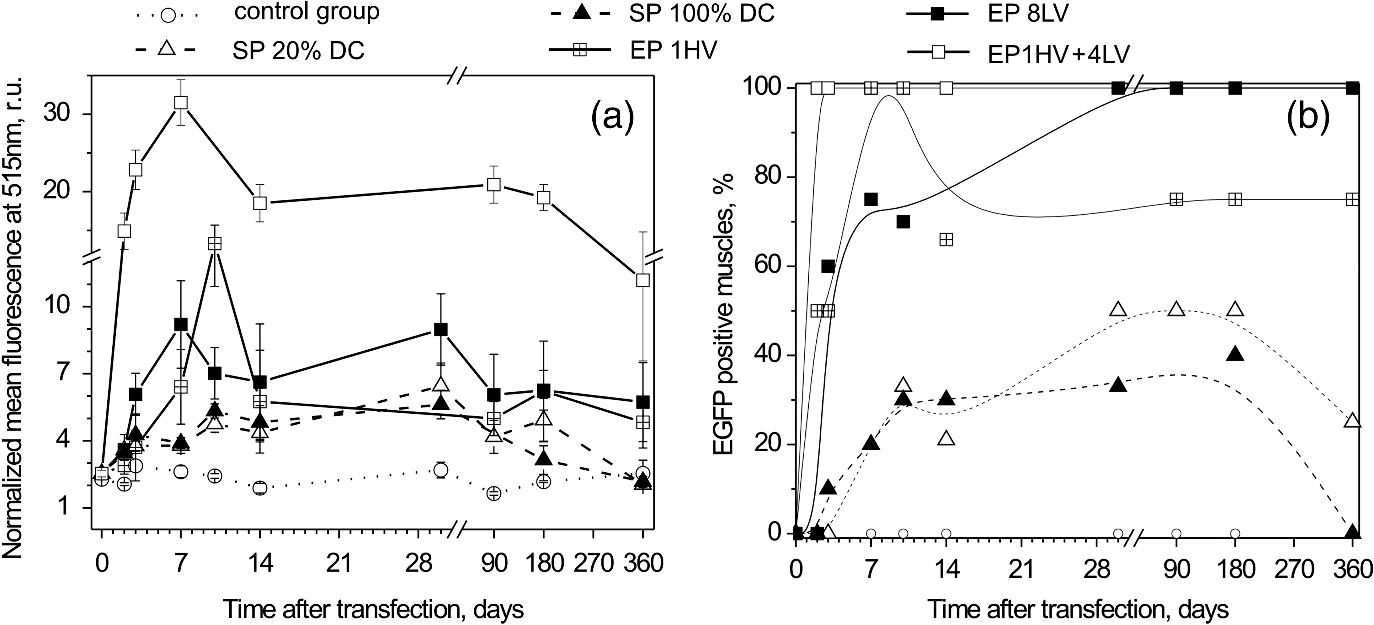 No EGFP fluorescence signal was detected in the control animal group when the plasmid was injected into muscle without any further EP or SP treatment [Fig. 5(a)]. Fluorescence intensity comparison between the control group and other experimental groups revealed that EP (1 HV, 8 LV or 1 HV + 4 LV) resulted in a statistically significant () increase of EGFP fluorescence over the one year period of observation. At our experimental setup, the most efficient pDNA transfection was achieved by using 1 HV + 4 LV EP protocol. The peak of EGFP fluorescence intensity was obtained 7 days after electrotransfection, and it was significantly higher in comparison with any other EP groups. Then during the second week of observation EGFP fluorescence intensity decreased by half and remained stable throughout the next half year period. The peak of EGFP fluorescence in 1 HV group was achieved 10 days after electrotransfection but it was significantly lower in comparison to the peak fluorescence intensity in 1 HV + 4 LV group (). Considering the accumulation phase of EGFP, the less intense EGFP fluorescence was detected in 8 LV group, peaking from the 1st to 4th week after electrotransfection. Figure 5(b) represents the interindividual variability of EGFP expression. The most efficient electric pulse protocol for electrotransfection was 1 HV + 4 LV with 100% of the muscles already positive for EGFP at second day post–electric pulse delivery [Fig. 5(b)]. For 1 HV or 8 LV groups, our noninvasive observations revealed that 75% to 100% of the muscles were positive for EGFP at 7th day after electric pulse delivery [Fig. 5(b)]. Muscle transfection by using SP resulted in relatively low EGFP peak fluorescence intensity, with no statistical significance between 20% and 100% US DC applied. Moreover, using SP less than 50% of the muscles were transfected. The elevated levels of EGFP fluorescence remained approximately constant between days 10 and 30 after sonotransfection. Two weeks after SP, the mean fluorescence intensity of EGFP reached the similar values as in 1 HV or 8 LV groups. During the clearance period, the average fluorescence intensity at 512 nm gradually decreased to the value of 2.3 r.u. (which is similar to the control group autofluorescence). During the clearance stage of EGFP (day 360; 20% US DC group), 25% of sonotransfected muscles still had a few low fluorescent fibers [Fig. 6(k)] however this result did not contribute to the overall increase of muscle fluorescence intensity above the control levels. Fig. 6Detection of EGFP expression in muscles across the skin one year after muscle transfection. The top panel: (a–c) in vivo representative images of electrotransfected muscles by 1 HV + 4 LV, 8 LV or 1 HV pulse application or (d, e) sonotransfected muscles by applying 20% or 100% US DC. (f) Leg of mouse injected with EGFP plasmid without exposure to EP or SP is depicted. The bottom panel (g–l) depicts the same tibialis cranialis muscles after removal of the skin (image scale bar: 5 mm). 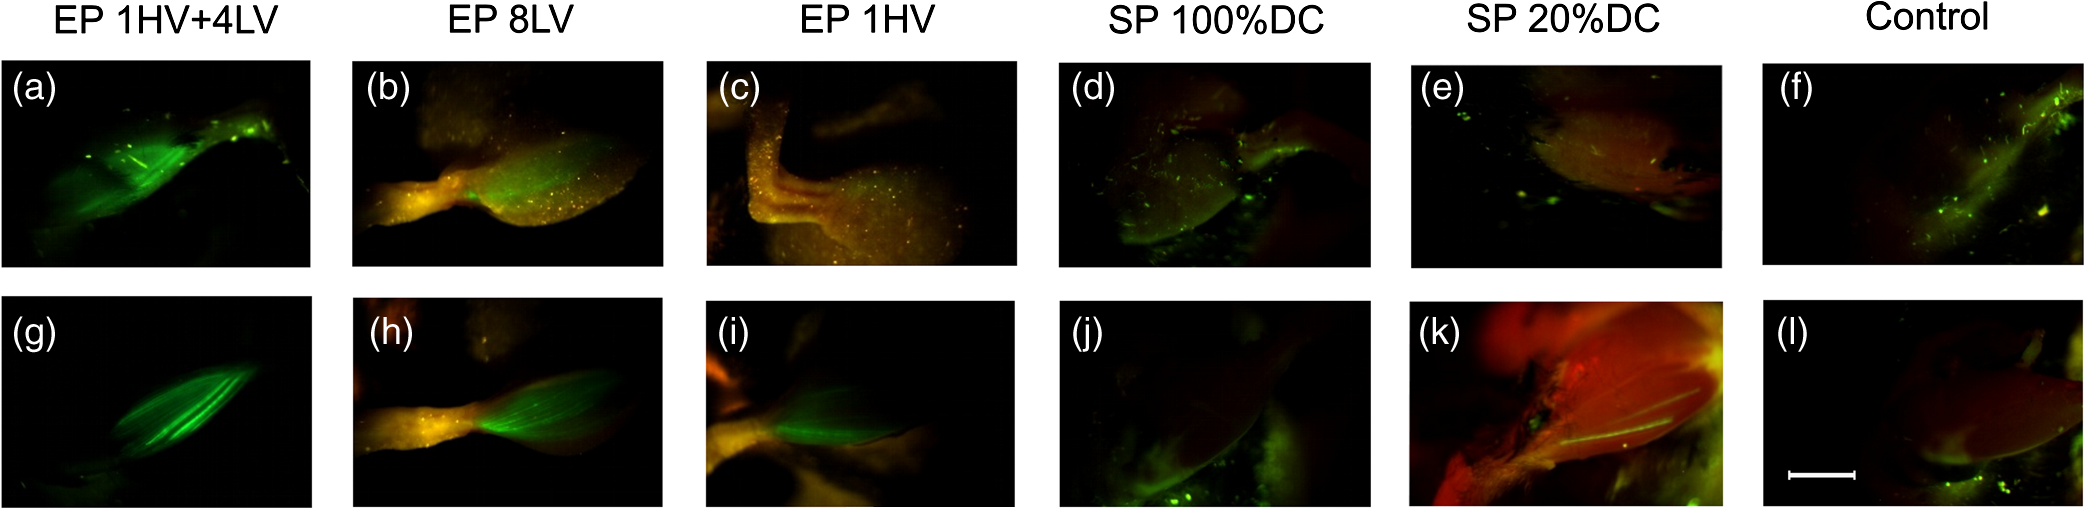 3.3.Comparison of EGFP Fluorescence Intensity in Ex Vivo Muscles with In Vivo ResultsFinally, all mice were killed 1 year after pDNA transfection and EGFP fluorescence distribution was evaluated at tibialis cranialis muscle surface and within the volume of the muscle. The multispectral images of muscle surface showed that the largest area of EGFP fluorescence was obtained when eight LV electric pulses were used for EP (Table 2). EGFP fluorescent area covered up to 68% of the muscle surface in 8 LV group [Fig. 6(h)] and this area was significantly larger compared with the EGFP fluorescent area obtained using other electric pulse protocols ( for 1 HV + 4 LV and for 1 HV) or SP protocol () with 20% US DC [Figs. 6(g), 6(i), and 6(k)]. The remaining sonotransfected muscles (all in 100% US DC group) as well as the muscles in control group [Figs. 6(j) and 6(l)] were not fluorescent with EGFP. Similar to fluorescence spectroscopy results, the present multispectral imaging data revealed very high interindividual variability of EGFP expression after SP. Table 2Results of multispectral image analysis: comparison of GFP fluorescent area and GFP fluorescence intensity levels one year after applying different transfection protocols.
In contrast to the transfection area data, the highest average and integral fluorescence signals of EGFP were induced by using 1 HV + 4 LV electric pulses. Application of 8 LV or 1 HV pulses, as well as SP, resulted in lower fluorescence intensities of EGFP detected at the muscle surface (Table 2). Such findings could have been prognosticated from the noninvasive multispectral imaging data in vivo [Figs. 6(a)–6(f)]. A linear regression was found to describe the relationship between Table 2 listed parameters measured in vivo (represented by -axis) and at muscle surface (-axis), revealing the regression slope of for EGFP fluorescence mean; for EGFP fluorescence area and for EGFP fluorescence integral values. Histological samples were prepared from each muscle examined ex vivo. We sliced the muscle perpendicularly to the longitudinal axis of the fibers, and analyzed the same parameters in the transverse muscle section: area of EGFP fluorescent region, mean intensity, and integral intensity of EGFP positive pixel values. These results are presented in Table 2. In agreement with our previous findings, the highest number of EGFP positive fibers in the transverse sections of the muscle as well as the most intense fluorescence of the fibers had been detected when 8 LV or 1 HV + 4 LV electric pulses were used for pDNA transfection [Figs. 7(c), 7(d) representative images]. Meanwhile, after plasmid injection followed by SP (20% DC) the long-term transfection was limited to the presence of single EGFP positive fibers within the muscle [Fig. 7(b)]. EGFP fluorescence was not detected in the control group [Fig. 7(a)] and SP (100% DC) group. Fig. 7Transverse sections of tibialis cranialis muscle (left panel): (a) control mice; (b) mice one year after sonotransfection using , 5 min, 20% DC, 1 MHz US; (c, d) mice one year after electrotransfection using 8 LV or 1 HV + 4 LV pulses. The size of a single transverse section image is limited by the microscope field of view (image scale bar: ). The intense green color stained fibers in EP and SP groups express EGFP. Results of image processing (right panel): (e) dependency of EGFP positive fiber integral fluorescence measured at the skin above the muscle in vivo (filled squares) or at the muscle surface (open squares) with respect to EGFP integral fluorescence measured in transverse muscle sections ex vivo; (f) dependency of EGFP positive fiber fluorescence area measured in vivo (filled squares) or at the muscle surface (open squares) with respect to EGFP fluorescence area measured in transverse muscle sections ex vivo. Number of samples for transverse muscle sections: 56 (from 28 mice). 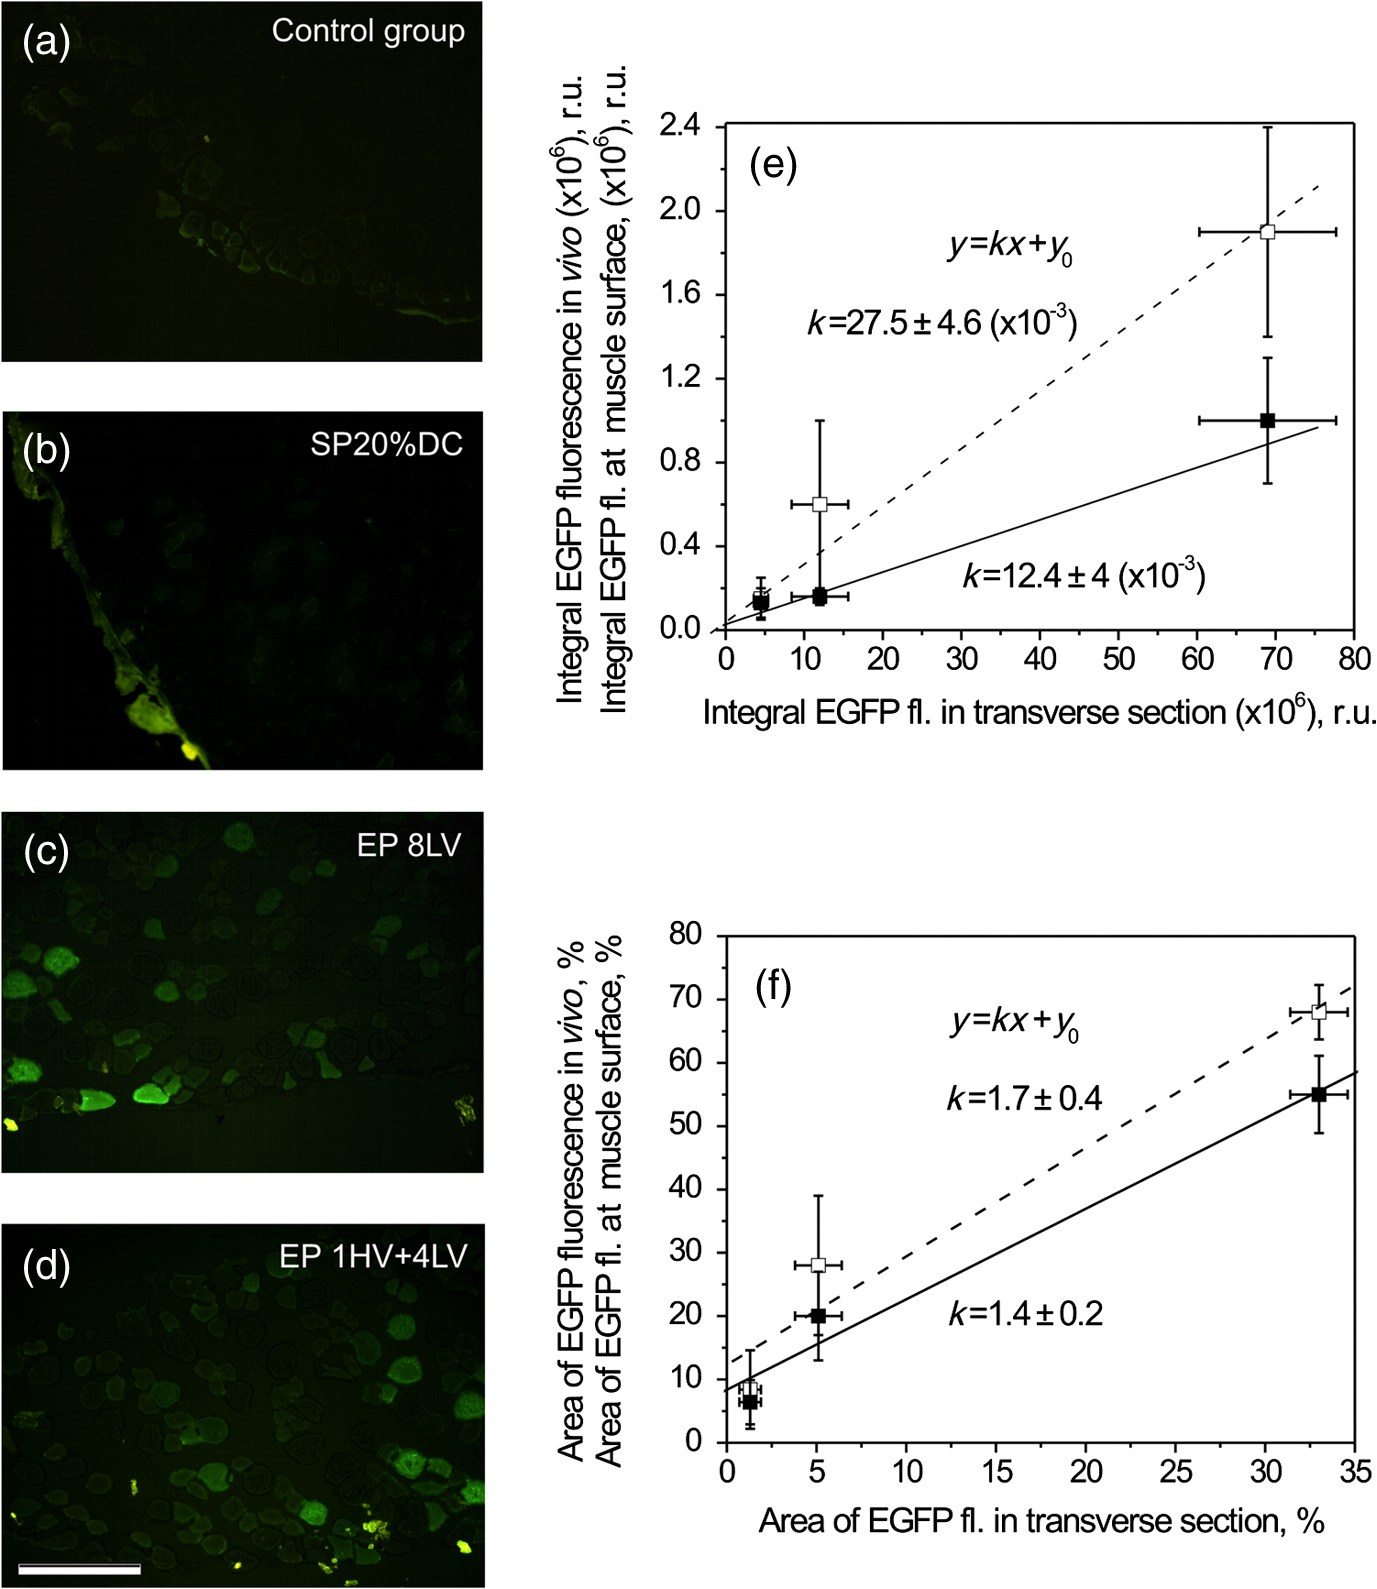 The analysis of fluorescence intensity parameters obtained in transverse muscle sections showed the strong linear correlation of integral EGFP fluorescence in transverse muscle sections with the integral fluorescence detected in vivo (), as well as detected on the surface of muscle ex vivo (), Fig. 7(e). The mean fluorescence intensity registered in transverse muscle section was a less sensitive metric for correlation with EGFP multispectral imaging data in vivo or ex vivo, due to its low-dynamic range. In comparison to integral fluorescence intensity, the dynamic range of mean fluorescence intensity (expressed as the ratio between the largest and smallest values from Table 2) was lower by one order of magnitude. Finally, Fig. 7(f) shows the linear correlation between EGFP fluorescent fiber area (which represents the certain number of fluorescent muscle fibers) in transverse section and EGFP fluorescent fiber area measured in vivo () or at muscle surface (). The following conclusion is that multispectral imaging data of EGFP fluorescence in live mice tibialis cranialis muscle can also provide information related to the number of EGFP fluorescent fibers and EGFP fluorescence intensity levels within the muscle. 4.DiscussionOur study updates the strategies for gene transfection efficiency quantification in vivo. Using the EGFP coding plasmid, we demonstrate the suitability of fluorescence spectroscopy and multispectral imaging for noninvasive quantification of transfection efficiency in mice tibialis cranialis muscle. Muscle tissue is a promising target for gene therapy, especially for the production of proteins as systemic therapeutic products, which can be released into the circulatory system, e.g., for another tissue targeting.5,24 Our study showed that both EP and SP increased EGFP expression levels. By applying fluorescence spectroscopy point measurements, we were able to monitor EGFP fluorescence pharmacokinetics in tibialis cranialis muscle during 1 year life period of mice. In agreement with Mir et al.,3 Tevz et al.,26 and Yamasita et al.36 studies on long-term gene electrotransfection pharmacokinetics, we revealed the peak levels of EGFP in muscle one week after EP. It is well known that the efficiency of pDNA expression greatly depends on the electropulsation parameters. However, the time dependency of pDNA expression peak levels may not. Yamasita et al.36 used a completely different electropulsation setup, six 100 ms long pulses of the indicated voltage (10 or 25 V), however revealing the same peak time for a protein expression after EP as in Tevz et al.26 and in our study. Our study demonstrates the importance of electrophoresis for higher pDNA transfection efficiency which is in agreement with previous findings of Šatkauskas et al.18,19 The combination of 1 HV + 4 LV pulses resulted in highest EGFP concentration levels as compared to the application of 1 HV or 8 LV pulses. Therefore, the successful electrotransfer using 1 HV + 4 LV protocol represented the condition when HV pulse destabilizes the membrane of the muscle fiber first and after that 4 LV pulses produce the electrophoretic movement of pDNA. The observation that no HV is necessary to obtain an efficient gene transfer is not surprising. It can also be explained by the electrophoretical displacement of pDNA: 8 LV pulses act directly on the charged pDNA molecules and force them to migrate through the cell membrane.6 The data reported in this study also support the results of electrotransfection that have already been discussed by other research groups:3,6,26 (1) the 1 HV + 4 LV protocol for gene elctrotransfection was the most efficient for both long-term and short-term expression; (2) the fluorescence intensity of the electrotransfected area reached the peak within a week, then EGFP fluorescence in muscle decayed exponentially and reached plateau which was detectable during the long-time period; (3) EP reduced the interindividual variability of EGFP expression (e.g., in comparison with SP). To our knowledge, only Yamasita et al.’s36 study on electrosonoporation and the present study provide comparison between the long-term electrotransfection and sonotransfection efficiency in vivo when using the same experimental setup as well as the same dose and type of pDNA. By applying various electric field or US output parameters, both studies indicate that gene expression levels after EP can be up to 10-fold higher than after SP. Yamasita et al.36 showed the similar time dependence of mIL-12 serum levels between SP and EP peaking 7 days after pDNA transfer. In agreement with those findings, multiple studies on US enhanced gene transfer pharmacokinetics in vivo37 also refer that marker gene expression usually peaks at 4 to 7 days after muscle sonotransfection, and then decays exponentially. Nevertheless, differently from those reports, our study revealed the prolonged accumulation of EGFP with a fluorescence intensity plateau up to four weeks after pDNA sonotransfer. In support, the long-term expression of luciferase encoded by the pEPI-1-Luc plasmid has also been detected by Li et al.38 By comparing sonotransfection time dependencies, authors of the study38 explained that the prolonged functional gene expression of luciferase depended on the type of plasmid used. Considering the time of gene expression peak, it can be important for selection of the transfection protocol for clinical application. For example, gene expression peaking and maintaining plateau for longer time duration might be suitable for gene therapy treatment of muscular disorders (such as Duchenne muscular dystrophy) while the early time and sharp gene expression peak might be more favorable for cancer treatment. Note that a long-term EGFP expression was induced by SP (at least of one year) which is important for future clinical applications. However, in contrast to EP, the potential of SP was limited by low-transfection efficiency [Fig. 5(a)] as well as by highly variable interindividual levels of EGFP [Fig. 5(b)]. The complexity of SP dosimetry makes it difficult to conclude which SP parameters need further optimization to achieve therapeutic gene transfer levels. Literature indicates some factors that influence the efficiency and duration of SP induced gene expression. It has been shown that efficient gene delivery in vivo depends on the properties of MB28,39 and pDNA concentration, e.g., larger amounts of pDNA may be required to obtain higher sonotransfection efficiency.35 However, the optimization of these parameters was beyond the scope of our study. Other studies aimed at comparison of sonotransfection efficiency in response to different US output parameters.40,41 Authors of the last study had investigated the effect of DC and power density on efficiency of naked DNA transfection into muscle. Gene expression was more efficient in response to the DC or the power density increase.41 In contrast to these findings, our data showed that efficiency of sonotransfection into skeletal muscle did not increase when US DC was switched from 20% to 100%, considering both short-term and long-term gene expression. Generally, gene transfection efficiency increase with US energy fluency (US power density × US exposure time, ) increase reaching a peak at certain levels. However, further increase of US energy fluency decrease the transfection efficiency possibly as a result of US enhanced cellular toxicity9,42 or MB cavitation induced pDNA damage.43 Considering the selection of US power density, many gene delivery studies use 0.5 to (termed as low power density US) which had also been approved for medical applications. Guided by efficient skeletal muscle transfection results,35,44,45 US power density was selected in this study. Nevertheless, our measurements indicated that the selected conditions for SP were far from the optimal; it could be concluded from the EGFP fluorescence pharmacokinetics (Fig. 5). In case of EP application, when using electric pulses above the threshold for skeletal muscle EP (which is at for 8 HV pulses , 1 Hz)46 the sharp peak of EGFP fluorescence was detected during the first week post-transfection. In contrast, when applying the pulses below this threshold, the EGFP fluorescence pharmacokinetics was characterized by the fluorescence intensity plateau. Similarly, no clear fluorescence peak was expressed in EGFP pharmacokinetics after the sonotransfection, so is likely that US and MB cavitation impact to the muscle was below the threshold of muscle SP and therefore further adjustment of SP parameters are needed, e.g., using the strategy of implicit dosimetry for SP.21,47 Up to now, several methods for in vivo transfection detection and quantification are being used. This includes fluorescent stereomicroscope measurements and bioluminescent imaging. Due to the lack of sensitivity, fluorescent stereomicroscope allows follow up transfection efficiency only qualitatively if the skin is not removed. Bioluminescent imaging allows the noninvasive detection and quantification of transfection efficiency and can be used to detect luciferase encoding plasmids. Nevertheless, due to high-price, the technique is not available to all labs. The same is true for other sophisticated in vivo imaging systems, like iBox Scientia, IVIS SpectrumCT or others that can integrate microCT, three-dimensional optical tomography for fluorescence and bioluminescence, with prices ranging from about 72K to 628K euros. Therefore, the potential of reducing costs for imaging apparatus had been challenged by replacing the Nuance EX multispectral imaging camera (that costs around 70K euros) with a less expensive industrial camera. A simple device for fluorescence in vivo imaging was developed, and tested on mice tibialis cranialis muscle using the same experimental conditions.48 For qualitative and quantitative evaluation of EGFP levels, Jakovels et al.48 used the ratio of fluorescence intensities at G and R color channels which was related to EGFP location in situ. With the addition of fiber optics system, a total cost estimate for building such a suitable imaging and spectra acquisition device is about 4.4K euros. In conclusion, fluorescence spectroscopy and multispectral imaging were accurate methods for evaluation of EGFP expression levels and the duration of EGFP expression in small animal superficial tibialis cranialis muscle. The area of EGFP, the integral and the mean fluorescence intensity of EGFP detected on the skin surface covering muscle of live mouse correlated with the amount of EGFP inside the muscle. Therefore, fluorescence spectroscopy and multispectral imaging methods are suggested for noninvasive evaluation of reporter gene expression in vivo, allowing further recommendations for gene transfection protocols at the reduced number of experimental animals required for reporter gene pharmacokinetics measurements. AcknowledgmentsThis work has been supported by the European Social Fund within the project “Innovative biomedical image acquisition processing technologies (InBiT)” (No. 2013/0009/1DP/1.1.1.2.0/13/APIA/VIAA/014). ReferencesR. Tomanin and M. Scarpa,
“Why do we need new gene therapy viral vectors? Characteristics, limitations and future perspectives of viral vector transduction,”
Curr. Gene. Ther., 4 357
–372
(2004). http://dx.doi.org/10.2174/1566523043346011 Google Scholar
S. E. Raper et al.,
“Fatal systemic inflammatory response syndrome in a ornithine transcarbamylase deficient patient following adenoviral gene transfer,”
Mol. Genet. Metab., 80 148
–158
(2003). http://dx.doi.org/10.1016/j.ymgme.2003.08.016 Google Scholar
L. M. Mir et al.,
“High-efficiency gene transfer into skeletal muscle mediated by electric pulses,”
Proc. Natl. Acad. Sci., 96 4262
–4267
(1999). http://dx.doi.org/10.1073/pnas.96.8.4262 Google Scholar
P. Hojman et al.,
“Gene expression profiles in skeletal muscle after gene electrotransfer,”
BMC Mol. Biol., 8 56
(2007). http://dx.doi.org/10.1186/1471-2199-8-56 Google Scholar
H. Gollins et al.,
“High-efficiency plasmid gene transfer into dystrophic muscle,”
Gene Ther., 10 504
–512
(2003). http://dx.doi.org/10.1038/sj.gt.3301927 GETHEC 0969-7128 Google Scholar
F. M. André et al.,
“Efficiency of high- and low-voltage pulse combinations for gene electrotransfer in muscle, liver, tumor, and skin,”
Hum. Gene Ther., 19 1261
–1272
(2008). http://dx.doi.org/10.1089/hum.2008.060 Google Scholar
S. Tsunoda et al.,
“Sonoporation using microbubble BR14 promotes pDNA/siRNA transduction to murine heart,”
Biochem. Biophys. Res. Commun., 336
(1), 118
–127
(2005). http://dx.doi.org/10.1016/j.bbrc.2005.08.052 Google Scholar
J. L. Lee et al.,
“Prolonging the expression duration of ultrasound-mediated gene transfection using PEI nanoparticles,”
J. Controlled Release, 160
(1), 64
–71
(2012). http://dx.doi.org/10.1016/j.jconrel.2012.03.007 Google Scholar
Q. L. Lu et al.,
“Microbubble ultrasound improves the efficiency of gene transduction in skeletal muscle in vivo with reduced tissue damage,”
Gene Ther., 10
(5), 396
–405
(2003). http://dx.doi.org/10.1038/sj.gt.3301913 GETHEC 0969-7128 Google Scholar
I. Spanggaard et al.,
“Gene electrotransfer of plasmid antiangiogenic metargidin peptide (AMEP) in disseminated melanoma: safety and efficacy results of a phase I first-in-man study,”
Hum. Gene Ther. Clin. Dev., 24 99
–107
(2013). http://dx.doi.org/10.1089/humc.2012.240 Google Scholar
M. Cemazar et al.,
“Control by pulse parameters of DNA electrotransfer into solid tumors in mice,”
Gene Ther., 16 635
–644
(2009). http://dx.doi.org/10.1038/gt.2009.10 GETHEC 0969-7128 Google Scholar
D. L. Miller and J. M. Song,
“Tumor growth reduction and DNA transfer by cavitation-enhanced high-intensity focused ultrasound in vivo,”
Ultrasound Med. Biol., 29
(6), 887
–893
(2003). http://dx.doi.org/10.1016/S0301-5629(03)00031-0 USMBA3 0301-5629 Google Scholar
R. Suzuki et al.,
“Cancer gene therapy by IL-12 gene delivery using liposomal bubbles and tumoral ultrasound exposure,”
J. Controlled Release, 142
(2), 245
–250
(2010). http://dx.doi.org/10.1016/j.jconrel.2009.10.027 Google Scholar
S. I. Sukharev et al.,
“Electroporation and electrophoretic DNA transfer into cells: the effect of DNA interaction with electropores,”
Biophys. J., 63
(5), 1320
–1327
(1992). http://dx.doi.org/10.1016/S0006-3495(92)81709-5 Google Scholar
M. Golzio, J. Teissie and M. P. Rols,
“Direct visualization at the single-cell level of electrically mediated gene delivery,”
Proc. Natl. Acad. Sci., 99
(3), 1292
–1297
(2002). http://dx.doi.org/10.1073/pnas.022646499 Google Scholar
S. Šatkauskas et al.,
“Mechanisms of in vivo DNA electrotransfer: respective contributions of cell electropermeabilization and DNA electrophoresis,”
Mol. Ther., 5 133
–140
(2002). http://dx.doi.org/10.1006/mthe.2002.0526 Google Scholar
S. Šatkauskas et al.,
“Electrophoretic component of electric pulses determines the efficacy of in vivo DNA electrotransfer,”
Hum. Gene Ther., 16 1194
–1201
(2005). http://dx.doi.org/10.1089/hum.2005.16.1194 Google Scholar
S. Šatkauskas, P. Ruzgys and M. S. Venslauskas,
“Towards the mechanisms for efficient gene transfer into cells and tissues by means of cell electroporation,”
Expert Opin. Biol. Ther., 12
(3), 275
–286
(2012). http://dx.doi.org/10.1517/14712598.2012.654775 Google Scholar
B. Markelc et al.,
“Inhibitor of endocytosis impairs gene electrotransfer to mouse muscle in vivo,”
Bioelectrochemistry, 103 111
–119
(2015). http://dx.doi.org/10.1016/j.bioelechem.2014.08.020 BEBEBP 0302-4598 Google Scholar
S. Mehier-Humbert et al.,
“Plasma membrane poration induced by ultrasound exposure: implication for drug delivery,”
J. Controlled Release, 104
(1), 213
–222
(2005). http://dx.doi.org/10.1016/j.jconrel.2005.01.007 JCREEC 0168-3659 Google Scholar
Y. Y. Qiu et al.,
“The correlation between acoustic cavitation and sonoporation involved in ultrasound-mediated DNA transfection with polyethylenimine (PEI) in vitro,”
J. Controlled Release, 145 40
–48
(2010). http://dx.doi.org/10.1016/j.jconrel.2010.04.010 JCREEC 0168-3659 Google Scholar
Y. Taniyama et al.,
“Development of safe and efficient novel nonviral gene transfer using ultrasound: enhancement of transfection efficiency of naked plasmid DNA in skeletal muscle,”
Gene Ther, 9 372
–380
(2002). http://dx.doi.org/10.1038/sj.gt.3301678 GETHEC 0969-7128 Google Scholar
I. Lentacker et al.,
“Understanding ultrasound induced sonoporation: definitions and underlying mechanisms,”
Adv. Drug Delivery Rev., 72C 49
–64
(2014). http://dx.doi.org/10.1016/j.addr.2013.11.008 ADDREP 0169-409X Google Scholar
K. C. Tsai et al.,
“Differences in gene expression between sonoporation in tumor and in muscle,”
J. Gene Med., 11
(10), 933
–940
(2009). http://dx.doi.org/10.1002/jgm.v11:10 Google Scholar
D. M. Chudakov et al.,
“Fluorescent proteins and their applications in imaging living cells and tissues,”
Physiol. Rev., 90
(3), 1103
–1163
(2010). http://dx.doi.org/10.1152/physrev.00038.2009 Google Scholar
G. Tevz et al.,
“Gene electrotransfer into murine skeletal muscle: a systematic analysis of parameters for long-term gene expression,”
Technol. Cancer Res. Treat., 7
(2), 91
–101
(2008). http://dx.doi.org/10.1177/153303460800700201 Google Scholar
P. F. Forde et al.,
“Development and characterization of an enhanced nonviral expression vector for electroporation cancer treatment,”
Mol. Ther. Methods Clin. Dev., 1 14012
(2014). http://dx.doi.org/10.1038/mtm.2014.12 Google Scholar
C. M. Panje et al.,
“Ultrasound-mediated gene delivery with cationic versus neutral microbubbles: effect of DNA and microbubble dose on in vivo transfection efficiency,”
Theranostics, 2
(11), 1078
–1091
(2012). http://dx.doi.org/10.7150/thno.4240 Google Scholar
C. W. Lo et al.,
“Tertiary-amine functionalized polyplexes enhanced cellular uptake and prolonged gene expression,”
PLoS One, 9
(5), e97627
(2014). http://dx.doi.org/10.1371/journal.pone.0097627 POLNCL 1932-6203 Google Scholar
H. Jockusch, S. Voigt and D. Eberhard,
“Localization of GFP in frozen sections from unfixed mouse tissues: immobilization of a highly soluble marker protein by formaldehyde vapor,”
Journal of Histochem. Cytochem., 51
(3), 401
–404
(2003). http://dx.doi.org/10.1177/002215540305100315 Google Scholar
H. Bay, T. Tuytelaars and L. van Gool,
“SURF: speeded up robust features,”
in Computer Vision-ECCV 2006,
404
–417
(2006). Google Scholar
N. Otsu,
“A threshold selection method from gray-level histograms,”
Automatica, 11
(285–296), 23
–27
(1975). ATCAA9 0005-1098 Google Scholar
M. Tamošiūnas et al.,
“Application of fluorescence spectroscopy and multispectral imaging for non-invasive estimation of GFP transfection efficiency,”
Proc. SPIE, 9421 94210M
(2014). http://dx.doi.org/10.1117/12.2083895 PSISDG 0277-786X Google Scholar
K. C. Tsai et al.,
“Differences in gene expression between sonoporation in tumor and in muscle,”
J. Gene Med., 11
(10), 933
–940
(2009). http://dx.doi.org/10.1002/jgm.v11:10 Google Scholar
T. Li et al.,
“Gene transfer with echoenhanced contrast agents: comparison between Albunex, Optison, and Levovist in mice–initial results,”
Radiology, 229 423
–428
(2003). http://dx.doi.org/10.1148/radiol.2292020500 RADLAX 0033-8419 Google Scholar
Y. Yamashita et al.,
“Muscle-targeted interleukin-12 gene therapy of orthotopic hepatocellular carcinoma in mice using in vivo electrosonoporation,”
Mol. Cancer Ther., 3
(9), 1177
–1182
(2004). Google Scholar
C. M. H. Newman and T. Bettinger,
“Gene therapy progress and prospects: ultrasound for gene transfer,”
Gene Ther., 14 465
–475
(2007). http://dx.doi.org/10.1038/sj.gt.3302925 GETHEC 0969-7128 Google Scholar
Y. S. Li et al.,
“Optimising ultrasound-mediated gene transfer (sonoporation) in vitro and prolonged expression of a transgene in vivo: potential applications for gene therapy of cancer,”
Cancer Lett., 273
(1), 62
–69
(2009). http://dx.doi.org/10.1016/j.canlet.2008.07.030 CALEDQ 0304-3835 Google Scholar
R. R. Sun et al.,
“Development of therapeutic microbubbles for enhancing ultrasound-mediated gene delivery,”
J. Controlled Release, 182 111
–120
(2014). http://dx.doi.org/10.1016/j.jconrel.2014.03.002 Google Scholar
H. D. Liang et al.,
“Optimisation of ultrasound-mediated gene transfer (sonoporation) in skeletal muscle cells,”
Ultrasound Med. Biol., 30
(11), 1523
–1529
(2004). http://dx.doi.org/10.1016/j.ultrasmedbio.2004.08.021 Google Scholar
P. Schratzberger et al.,
“Transcutaneous ultrasound augments naked DNA transfection of skeletal muscle,”
Mol. Ther., 6
(5), 576
–583
(2002). http://dx.doi.org/10.1016/S1525-0016(02)90715-X Google Scholar
H. Koike et al.,
“An efficient gene transfer method mediated by ultrasound and microbubbles into the kidney,”
J. Gene Med., 7
(1), 108
–116
(2005). http://dx.doi.org/10.1002/(ISSN)1521-2254 Google Scholar
E. K. Wasan, D. L. Reimer and M. B. Bally,
“Plasmid DNA is protected against ultrasonic cavitation-induced damage when complexed to cationic liposomes,”
J. Pharm. Sci., 85
(4), 427
–433
(1996). http://dx.doi.org/10.1021/js9504752 Google Scholar
S. Sonoda et al.,
“Gene transfer to corneal epithelium and keratocytes mediated by ultrasound with microbubbles,”
Invest. Ophthalmol. Vis. Sci., 47 558
–564
(2006). http://dx.doi.org/10.1167/iovs.05-0889 Google Scholar
X. Wang et al.,
“Gene transfer with microbubble ultrasound and plasmid DNA into skeletal muscle of mice: comparison between commercially available microbubble contrast agents,”
Radiology, 237 224
–229
(2005). http://dx.doi.org/10.1148/radiol.2371040805 RADLAX 0033-8419 Google Scholar
J. Gehl et al.,
“In vivo electroporation of skeletal muscle: threshold, efficacy and relation to electric field distribution,”
Biochim. Biophys. Acta, 1428 233
–240
(1999). http://dx.doi.org/10.1016/S0304-4165(99)00094-X Google Scholar
M. Tamošiūnas et al.,
“Microbubble sonodestruction rate as a metric to evaluate sonporation efficiency,”
J. Ultrasound Med., 31
(12), 1993
–2000
(2012). JUMEDA 0278-4297 Google Scholar
D. Jakovels et al.,
“Assessment of efficiencies of electroporation and sonoporation methods by using fluorescence RGB imaging method,”
Proc. SPIE, 9032 90320E
(2013). http://dx.doi.org/10.1117/12.2044385 PSISDG 0277-786X Google Scholar
BiographyMindaugas Tamošiūnas is a docent in Department of Biochemistry and a researcher in biophysical research group at Vytautas Magnus University, Kaunas, Lithuania. He is focused on drug and gene electrotransfer and sonotransfer, laser-tissue interactions, steady state and time-resolved fluorescence spectroscopy, and multispectral imaging as well as on development of implicit dosimetry for sonoporation and photodynamic therapy. Roberts Kadikis is a researcher at the Institute of Electronics and Computer Science and a PhD student of electronics at Riga Technical University. He received his master’s degree in electronics from Riga Technical University in 2011. His current research interests are biomedical image processing, computer vision, and machine learning. Inga Saknīte received her doctoral degree in physics from the University of Latvia in 2016. Currently, she is working as a researcher in the Biophotonics Laboratory, Institute of Atomic Physics and Spectroscopy, University of Latvia. Her research interests include reflectance spectroscopy and spectral imaging of skin in the visible and near-infrared spectral ranges. She is a member of SPIE, OSA, and EPS. Juozas Baltušnikas received his doctoral degree in biology in 2015 from Lithuanian Sports University. Currently, he is a junior research fellow at Lithuanian Sports University, Institute of Sports Sciences and Innovation. His main research interests are systemic targeted delivery of drugs, transcriptional gene regulation, muscle fiber plasticity and diversity, and muscle hypertrophy. Audrius Kilikevičius received his PhD in biology at Lithuanian Sports University. His thesis research was focused on genetic and genomic determinants of muscle traits and response to physical training. Currently, he is interested in site-specific epigenome and genome editing for therapy of muscular disease. Alexey Lihachev received his doctoral degree in physics in 2011 from the University of Latvia. Currently, he is the leading researcher at Biophotonics Laboratory, Institute of Atomic Physics and Spectroscopy, University of Latvia. His main research interests focus on time and spectral resolved tissue fluorescence. Ramona Petrovska is a researcher in the Molecular Pharmacology Laboratory, Latvian Biomedical Research and Study Centre. She received her master’s degree in virology and microbiology from the University of Latvia in 1982. Her current research interests include cancer cell biology, morphology, GPCR expression in different cell lines and screening of potentially therapeutic ligands. Dainis Jakovels received his doctoral degree in physics in 2014 from the University of Latvia. Currently, he is a senior researcher in the Biophotonics Laboratory, Institute of Atomic Physics and Spectroscopy, University of Latvia. His main research interests are light and tissue interaction, spectral imaging, skin chromophore mapping, and multispectral imaging. He is a member of SPIE and OSA. Saulius Šatkauskas is a professor and head of the biophysical research group at Vytautas Magnus University in Kaunas, Lithuania. His main research is focused on electroporation and sonoporation-based drug and gene delivery. In addition, part of his research work is devoted to developmental neuroscience. |
|||||||||||||||||||||||||||||||||||||||||||||||||||||||||||||||||||||||||||||||||||||||||||||||||||||||||||||||||||||||||||||||||||||||||||


