
|
|
|
Imaging tissues with structured light (SL) in a wide field allows for isolating contributions and enhancing contrast of superficial versus deep tissues. SL imaging involves projecting patterns (typically lines or sinusoids) onto the tissue surface and imaging the resulting pattern. The highly scattering nature of tissues blurs the projected pattern, and measuring the degree of blurring allows for determination of the tissue’s optical properties using a technique known as spatial frequency domain imaging.1 In addition, the pattern’s frequency () strongly dictates the imaging depth: higher frequencies blur at shallower depths than lower frequencies, resulting in images that can be “gated” to shallower depths.2–4 Polarization gating has traditionally been used for wide-field imaging applications in skin. In particular, cross-polarization imaging has been demonstrated to gate superficial tissues for skin imaging, showing enhanced contrast for imaging pathologies.5 In cross-polarization imaging, the imaging depth depends on the tissue’s depolarization properties; however, with structured illumination, the depth can be dynamically tuned by changing the spatial frequency of the pattern. In this way, the gating mechanism relies on the combination of the illumination and the tissue’s inherent scattering properties (or the distribution of scattering cross-sections). Here, we demonstrate how this gating effect can be used to alter contrast for imaging skin. Acquiring and rendering skin images with SL necessitated two technical developments: building a clinic-friendly handheld imaging device and rendering images in color. Below, we describe the basics of the SL imaging approach and how we implemented it within a compact handheld device. Then, we show color SL images from skin of different pathologies, demonstrating the altered contrast offered using this technique. Our analysis is based on a qualitative assessment of the images, and we note that our approach in general is a qualitative imaging approach. While previous diffuse optical techniques in skin have focused on quantitative assessment of tissue optical properties,6,7 this approach is intentionally qualitative, utilizing the pathlength gating effect of SL to alter imaging contrast. In SL imaging, three two-dimensional spatial patterns with phase shifts of 0 deg, 120 deg, and 240 deg are projected onto the tissue surface, and the corresponding reflectance intensity images , , and are acquired. A DC and AC image, and , are obtained through the demodulation process shown as1 The reflectance intensity images are functions of spatial frequency and wavelength . The DC image is equivalent to a reflectance image using planar illumination; thus, it is invariant with . The AC image is known as the SL image and is strongly spatial frequency–dependent. The imaging depth of the SL image is inversely related to .1 The imaging depth can be determined as1 at where diffuse light dominates the reflectance. As increases above , becomes strongly dependent on . For optical properties of skin ( and ), frequencies in the range of 1 to limit to 100 to .4 In the visible range, both the DC and AC images vary as a function of the wavelength-dependent tissue optical properties, absorbing more strongly in the blue region than in the red region. However, as the spatial frequency increases, the AC image is less sensitive to absorption due to the reduced sampling depth and limited pathlength.To render a color SL image, we imaged the sample using three wavelengths of 470, 530, and 655 nm to represent the red (r), green (g), and blue (b) channels, respectively. We used two spatial frequencies, and . Both the DC and AC intensity images were normalized to a 99% reflectance standard (Labsphere) image to obtain the corresponding reflectance images shown in Eqs. (3) and (4) before color rendering. Thus, color reflectance images were represented using reflectance images , , and as where , , and were the relative contributions of the r, g, and b channels, respectively. By adjusting , , and , the color rendering can be fine-tuned to achieve a more natural color balance.Acquiring SL images of skin required a portable handheld device for facilitating image collection in the clinical setting. Many areas of the skin can be hard to reach, so the device needed to be small and adaptable to many positions. In addition, because three images were required to render a single SL image, motion artifacts between frames needed to be controlled. Our solution was to separate the device into two modules (Fig. 1): the light engine [Fig. 1(a)] and the handheld imaging head [Fig. 1(b)]. These two components were connected via a liquid light guide (Newport, California). Fig. 1System schematic for (a) LED light source and (b) imaging head, (c) color picture of LED light source configuration, (d) color picture of imaging head, and (e) three-dimensional rendering of imaging head. 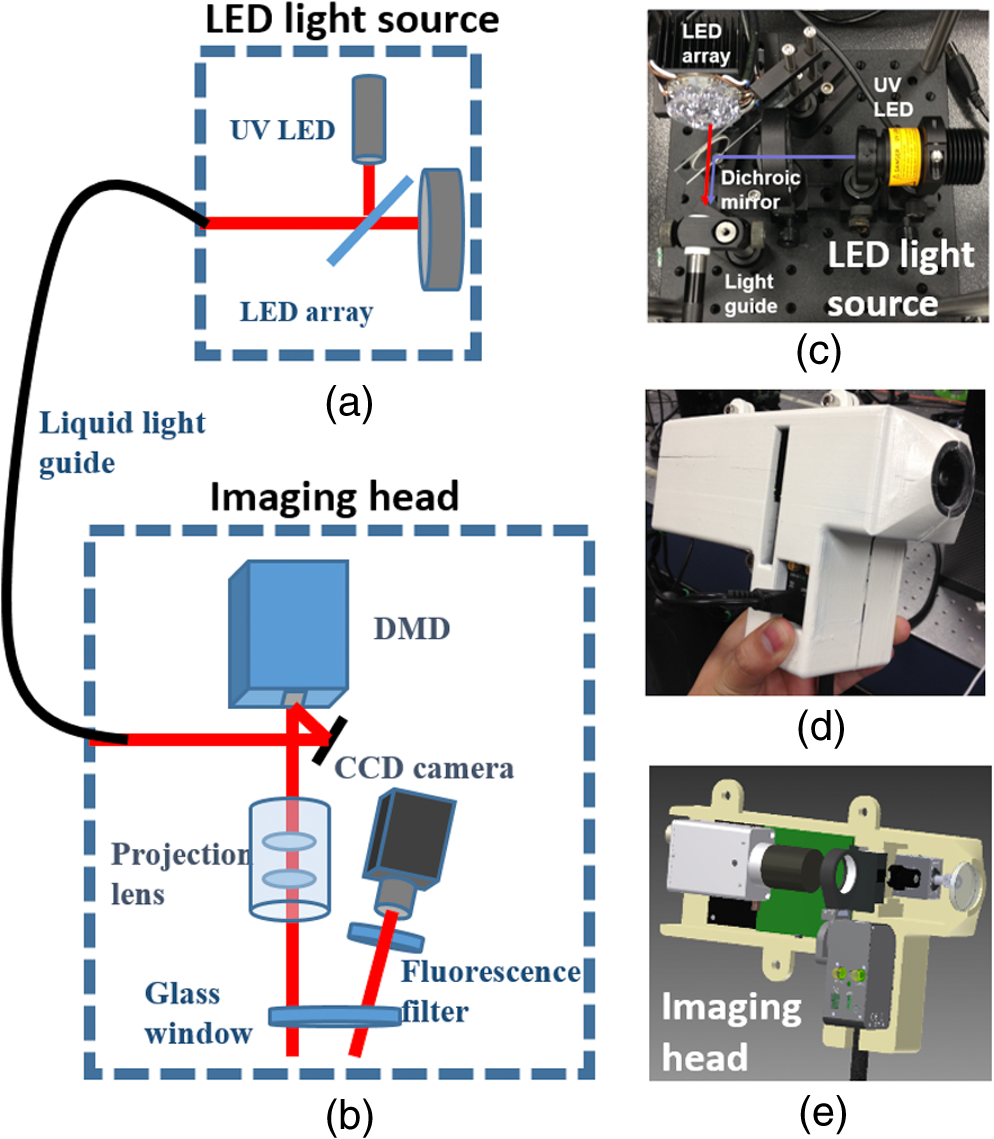 The imaging head consisted of the projector optics and a digital camera. We used a digital light projection evaluation module (Lightcrafter, Texas Instruments) to generate and project the patterns. The projector’s light engine was removed so that light from the liquid light guide could be directly coupled to the projector unit. A CCD camera (AVT Stingray 145B) with a 25-mm lens was used to acquire images. The optical axis of the camera was tilted about 5 deg from the projection axis to avoid specular reflection from the imaging window at the front aperture of the imaging head. This window served two purposes: (1) to reduce skin features such as skin folds and roughness by gently pressing the skin and (2) to reduce the specular reflection by applying water-based surgical lubricant (HR Pharmaceuticals Inc.) between glass and the skin. The glass window has a raised edge around it to minimize the pressure within the viewing area. The custom-built light engine [Fig. 1(c)] housed a total of seven individual controllable LEDs, six within an LED array (Part # SP-02, Luxeon Star LEDs), and one individual UV LED (M395L3, Thorlabs). Each LED could be individually controlled, operating at 395, 470, 505, 530, 590, 617, and 655 nm. This handheld imaging system has the ability to perform both reflectance imaging and fluorescence imaging (excitation of 395 nm and a bandpass filter, HQ450/60m, Chroma). This study used only reflectance imaging at three wavelengths: red (655 nm), green (530 nm), and blue (470 nm). We conducted clinical skin imaging on a total of 48 lesions of varying pathologies from 31 patients at the University of Texas Dell Medical School. The protocol was reviewed and approved by the Institutional Review Board. Here, we show a few representative lesions that highlight SL imaging in skin. Figure 2(a) shows a round-shaped lesion clinically diagnosed as a granuloma annulare (GA). GA is a vascular-related inflammatory lesion with associated necrosis affecting collagen and elastin tissue,8 indicating physiological changes that affect both absorption and scattering properties. The DC images, Fig. 2 (a-1, 4, 7), exhibit high absorption at 470 and 530 nm and low absorption at 655 nm, where the lesion shape can no longer be identified. By contrast, the SL images at and show enhanced contrast between the surrounding normal skin and the lesion at all three wavelengths; see Fig. 2 (a-2, 3, 5, 6, 8, and 9). Interestingly, we observed strong contrast at 655 nm under structured illumination; see Fig. 2 (a-8 and 9). As blood contrast is absent at this longer wavelength, the contrast in this image originates from tissue scattering, likely from the necrotizing effects on the collagen and elastin. By rendering color images for each individual spatial frequency, we obtained the color SL reflectance images shown in Fig. 2 (a-10, 11, 12). The color DC image, Fig. 2(a-10), exhibits similar shape and color as well as pigmented skin features compared to the standard color image shown in Fig. 2(a) and is akin to a standard dermatoscope image commonly used by dermatologists. At , the shape of the lesion can be easily identified, with much of the contrast originating from scattering. Fig. 2(a) Standard color image of GA; a(1-9) SL reflectance images at 470, 530, and 655 nm for spatial frequencies of (DC), , and for GA; a(10-12) color SL reflectance images of GA; (b-e)-1 rendered DC images and (b-e)-2 show color SL images for four lesions.  Using this same approach, we compared rendered DC images (i.e., dermatoscope images) and color SL images from several other pathologies [Figs. 2(b-e)]. All SL images of skin lesions at revealed additional contrast over rendered DC color images that was more sensitive to scattering and less sensitive to absorption. The lesion shown in Fig. 2(b-1) was clinically diagnosed as basal cell carcinoma (BCC). The rendered DC color image, Fig. 2(b-2), indicates that the BCC lesion was irregularly shaped and had high blood content. The corresponding color SL image shows less red within the lesion, with only a few areas within the lesion still exhibiting red (or blood). While the SL approach reduces contributions of absorption, it does not completely eliminate it when the absorption coefficient is high. Interestingly, this BCC does not show high scattering contrast, indicating the lesion has not undergone significant structural change. The lesion in Fig. 2(c-1) is a benign neoplasm. The SL image reveals structural heterogeneity within the lesion and scattered bright/dark spots in the surrounding tissue [Fig. 2(c-2) magnified inset] that are not seen in the rendered DC color image. The connective-tissue–rich keloid scar shown in Fig. 2(d-1) appears dim on the rendered DC color image; however, the SL image [Fig. 2(d-2)] shows a bright spot in the lesion’s center, likely from scattering of the collagen-dense center of the scar. The atypical nevus shown in Fig. 2(e-1) shows a dark spot within its center under rendered DC color imaging; however, that same dark spot disappears in the SL. This dark spot may be due to melanin pigment located deeper in the tissue so that the shallow imaging depth of SL does not distinguish it. All SL images seem to alter the contrast in the normal tissue, highlighting what appears to be glands and hair follicles, all not noticeable in the rendered DC color images. While we have only shown a subset of the images we acquired, we can summarize the qualitative nature of the remaining images. SL imaging seems to highlight structural heterogeneity, likely originating from scattering contrast. SL images show decreased absorption contrast (from blood and melanin); however, this absorption contrast is not completely eliminated in highly pigmented lesions. The frequency used to render the SL images is within the range that has shown sensitivity to the scattering phase function in addition to the overall scattering coefficient.4 The scattering anisotropy is not visible in a standard planar illuminated image; thus, the SL images show contrast that would not otherwise be visible. All SL images appear to have a blue hue as compared to their rendered DC color counterparts. This effect is likely due to blue light having a shorter penetration depth in tissue than red light. Therefore, superficial images would have a stronger contribution of blue light reflectance than red light. In this paper, we described an approach to visualizing skin pathologies by generating color SL reflectance images. Color SL reflectance images are composite SL reflectance images at 470, 530, and 655 nm. Although individual channels cannot be identified in a color image, it provides a natural method to perceive skin lesions with the ability to identify the source of contrast and different skin features. We demonstrated color SL imaging on skin lesions; however, it is equally applicable in many applications where qualitative tissue visualization may be needed. AcknowledgmentsThis research work was supported by a grant from the National Institutes of Health under Grant No. R21EB015892. ReferencesD. J. Cuccia et al.,
“Quantitation and mapping of tissue optical properties using modulated imaging,”
J. Biomed. Opt., 14
(2), 024012
(2009). http://dx.doi.org/10.1117/1.3088140 JBOPFO 1083-3668 Google Scholar
B. Yang et al.,
“Polarized light spatial frequency domain imaging for non-destructive quantification of soft tissue fibrous structures,”
Biomed. Opt. Express, 6
(4), 1520
–1533
(2015). http://dx.doi.org/10.1364/BOE.6.001520 BOEICL 2156-7085 Google Scholar
S. C. Kanick et al.,
“Sub-diffusive scattering parameter maps recovered using wide-field high-frequency structured light imaging,”
Biomed. Opt. Express, 5
(10), 3376
–3390
(2014). http://dx.doi.org/10.1364/BOE.5.003376 BOEICL 2156-7085 Google Scholar
N. Bodenschatz et al.,
“Model-based analysis on the influence of spatial frequency selection in spatial frequency domain imaging,”
Appl. Opt., 54
(22), 6725
–6731
(2015). http://dx.doi.org/10.1364/AO.54.006725 Google Scholar
S. L. Jacques, J. C. Ramella-Roman and K. Lee,
“Imaging skin pathology with polarized light,”
J. Biomed. Opt., 7
(3), 329
–340
(2002). http://dx.doi.org/10.1117/1.1484498 JBOPFO 1083-3668 Google Scholar
D. J. Rohrbach et al.,
“Characterization of nonmelanoma skin cancer for light therapy using spatial frequency domain imaging,”
Biomed. Opt. Express, 6
(5), 1761
–1766
(2015). http://dx.doi.org/10.1364/BOE.6.001761 BOEICL 2156-7085 Google Scholar
N. Rajaram et al.,
“Pilot clinical study for quantitative spectral diagnosis of non‐melanoma skin cancer,”
Lasers Surg. Med., 42
(10), 876
–887
(2010). http://dx.doi.org/10.1002/lsm.21009 LSMEDI 0196-8092 Google Scholar
K. Wolff and R. Johnson, Fitzpatrick’s Color Atlas and Synopsis of Clinical Dermatology, McGraw-Hill Medical, New York
(2009). Google Scholar
|


