
|
|
1.IntroductionOvarian cancer is the most deadly female reproductive malignancy with over 21,000 cases and over 14,000 deaths annually in the US.1 Ovarian cancer typically presents with nonspecific symptoms. Current screening methods [physical examination, transvaginal ultrasound (US), the CA-125 blood test] have not proven to be effective when used for annual screening in the general population in large clinical trials,2 although one noted a possible reduction in mortality after 7 to 14 years of annual screening for some population groups.2 The lack of specific symptoms or a proven effective screening method results in only 15% of cases discovered at an early stage when 5-year survival rates are over 90%. Thus, overall 5-year survival rates are just 45%.1 Certain high-risk women (BRCA1/2 gene mutations, family history of breast or ovarian cancer) are recommended to undergo prophylactic oophorectomy to remove the ovaries and fallopian tubes. This drastic measure decreases risk, but side effects include increased mortality for women who undergo the procedure before age 45 without hormone replacement.3,4 Early detection is extremely difficult because early changes may be too subtle to be resolved with whole-body imaging techniques, such as magnetic resonance imaging, computed tomography, or US.5,6 Additionally, emerging consensus suggests that perhaps over 50% of the most lethal form of the disease, high-grade serous ovarian cancer, originates in the fallopian tube.7,8 The need for an effective screening method is universal to all women, but is particularly critical for high-risk women. Without any high-risk factors, the lifetime risk of developing ovarian cancer is 1% to 2%. Women with a family history but no BRCA mutation have a risk of 4% to 7%, while women with family history and a BRCA mutation have a 23% to 54% lifetime risk.9 For high-risk patients, a reliable detection method may delay prophylactic salpingo-oophorectomy with regular monitoring. Advanced optical imaging techniques are a promising approach to provide the resolution and functional imaging needed for a sensitive and specific screening test. Optical techniques can be miniaturized for endoscopy, are robust, and are relatively inexpensive. Ovarian cancer has been imaged by several microscopic optical modalities in the past, including optical coherence tomography (OCT),10–14 confocal microscopy,15–18 multiphoton microscopy (MPM),19,20 photoacoustic imaging (PAI),13,21–23 and fluorescence spectroscopy/imaging.24–27 OCT captures high-resolution depth images of tissue microstructure and has demonstrated ability to distinguish normal tissue from ovarian cancer in vivo in animal models28 and laparoscopically in vivo in human patients.10 Fluorescence confocal imaging has been integrated into a microlaparoscope and has the ability to detect cancerous tissue in vivo.16–18 High-quality images of nuclear size and shape are obtained by the use of contrast agents, which have not yet been approved by the U.S. Food and Drug Administration (FDA) for in vivo use. MPM, including second-harmonic generation and multiphoton excited fluorescence, can image cell and connective tissue structure and metabolic tissue properties. It has demonstrated promise for distinguishing healthy from diseased human tissue ex vivo,19,20,29 as well as in vivo in mouse models.28,30,31 PAI combines high-resolution US imaging with contrast from optical absorption. Visible red or near-infrared illumination wavelengths are commonly used to provide large imaging depths. Using multiple wavelengths allows mapping of changes in hemoglobin concentration and oxygen saturation related to tumor angiogenesis.13,21–23,32 The above techniques have high-resolution, small fields of view and are point- or line-scanning imaging methods or require reconstruction, and thus have limited utility for navigation or rapid, large-area visualization. Some, such as MPM and PAI, typically utilize complex laser systems, which are less suitable for a robust, inexpensive clinical imaging system, although new fiber-based laser systems may enable small portable systems.33–38 All of the above high-resolution optical techniques may have promise for detecting early-stage ovarian cancer assuming the imaging system can be placed near or in contact with the epithelium of the ovary and fallopian tube. Although high-resolution techniques show promise, they may need to be coupled with a lower-resolution, wider field of view and long depth-of-field modality to navigate the ovarian and fallopian tube epithelium and identify suspicious areas. In an open surgery, a high-resolution modality endoscope can be visually directed to the tissue of interest, whereas in a laparoscopic procedure a white-light imaging system (either integrated with the high-resolution system into a dual-modality endoscope or in a second endoscope) can be used for navigation. However, the subtle changes of early-stage ovarian cancer may not be visible to the human eye or a standard white-light endoscope. Thus, in this case, the guidance imaging system simply guides the high-resolution system to the ovary so the high-resolution modality can optically biopsy discrete locations on the ovary and fallopian tubes. Furthermore, open and even laparoscopic surgeries are too invasive to be a widely used screening method. A less-invasive imaging method could utilize the natural orifice of the vagina, uterus, and fallopian tube for a miniature endoscopic imaging system. The system could combine a wide field of view, highly sensitive navigation, and surveillance technique with a more specific high-resolution technique. Fluorescence imaging is a promising candidate for the large field of view, highly sensitive imaging technique. Systems visualizing autofluorescence have been demonstrated.11–13 Autofluorescence imaging is advantageous because it does not require any dyes or contrast agents that may complicate regulatory approval. Previous studies by the investigators and others have characterized normal, cancerous, and benign ex vivo ovarian tissue autofluorescence using fiberoptic probes. One study excited tissue with a 325-nm pulsed laser and evaluated the emission spectrum from 350 to 600 nm for normal, benign, and malignant samples.26 Another study used a probe with tunable narrowband excitation and emission windows to develop complete excitation–emission matrices for excitation from 270 to 550 nm and emission from 290 to 700 nm with high spectral resolution.24 Wide-field spectral imaging with limited wavelengths has also been performed on both ovarian and fallopian tube tissue. Ovarian tissue was imaged using a 365-nm source to excite the tissue and an imaging system capable of recording eight emission bands between 400 and 640 nm.25 Another study imaged normal and cancerous fallopian tube samples by capturing a series of images including white-light reflectance, narrowband green reflectance, green autofluorescence (405- and 436-nm excitation), and blue autofluorescence (405-nm excitation).27 All these studies indicate autofluorescence imaging that shows promise for detection of ovarian cancer. Building upon these previous studies, an imaging system was developed with a wide field of view, multiple excitation wavelengths, and multiple emission bands. Multispectral fluorescence imaging (MFI) creates a series of coregistered fluorescence and reflectance images with a specific set of excitation wavelengths and emission bands that are selected to match the expected characteristics of known endogenous tissue fluorophores. These fluorophores may change in concentration and spatial location as normal tissue transitions to a cancerous or benign abnormality state. The reflectance images taken at several narrowband wavelengths effectively sample the blood absorption spectrum of hemoglobin, as well as indicate the overall remittance of light from scatterers in the tissue. Cancerous tissue tends to have increased vessel density leading to higher optical absorption and decreased reflectance and fluorescence.25,27 In cervical tissue, it has been shown that increased proteolytic activity associated with dysplasia reduces collagen fluorescence.39 The fluorescence images are obtained at multiple excitation wavelengths between 255 and 550 nm with emission bands between 340 and 650 nm. Miniaturization of the system to endoscopy is possible. The system has been successfully used to obtain high-contrast images of colon polyps40 and is utilized in this study to visualize ovarian and fallopian tube surgical biopsies. 2.Materials and Methods2.1.PatientsPatients at the University of Arizona Medical Center undergoing oophorectomy, salpingo-oophorectomy, total abdominal hysterectomy with bilateral salpingo-oophorectomy, and debulking surgeries were asked to donate surgical discard tissue to this imaging study. Additionally, the patients were requested to fill out a questionnaire including questions about age and menopause status. The study and questionnaire were approved by the Institutional Review Board of the University of Arizona and tissue was collected for 9 months. Informed consent was obtained from 28 patients during the study. Tissue was not available for four consented patients. Samples from the remaining 24 patients were imaged on the MFI system. 2.2.Tissue SamplesSurgical discard tissue was made available after samples necessary for clinical pathology were removed. Collected tissue samples for the study were small pieces of the ovary, fimbria, or distal fallopian tube. The imaged surface area of resected tissues was typically . Surface area for small samples of all tissue types was typically 0.2 to , while the largest imaged surface areas were 3.3 and for fallopian tube and ovarian samples, respectively. 2.3.Multispectral Fluorescence Imaging SystemThe laboratory-built MFI system used to collect images has been described in detail previously.40 The system uses a xenon arc lamp (300 W, Lambda LS, Sutter Instruments, Novato, California) and 10-position filter wheel to select discrete narrowband ( FWHM) illumination wavelengths between 260 and 650 nm. The illumination light is transmitted through a custom quartz fiber bundle with feedback fibers to monitor source power. The fiber illuminates a field of view. A color-corrected UV imaging lens images the sample onto a thermoelectrically cooled, UV-enhanced camera with intensified CCD (PhotonMAX: 512B, Princeton Instruments, Trenton, New Jersey). A second 10-position filter wheel with long pass filters selects the detected wavelengths. Software written in LabVIEW (National Instruments, Austin, Texas) automatically collects a series of raw images of interest by controlling the two filter wheels and camera. The imaging system uses image subtraction of long pass-filtered images to create effective bandpass images. For example, a 410- to 500-nm emission image is created by subtracting a 500-nm long pass image from a 410-nm long pass image. In total, the software uses the collected raw images to generate 18 output images for each sample: 12 autofluorescence images and 6 reflectance images [Fig. 1(a)]. The emission and excitation combinations used for autofluorescence images are selected based on expected characteristics of endogenous fluorophores.24 The reflected light images are designed to sample the absorption spectrum of hemoglobin41 [Fig. 1(b)]. Fig. 1Summary of MFI image types. (a) Plot of 18 image types collected by system. Six reflectance images are represented by asterisks having equal excitation and emission wavelengths. Twelve fluorescence images are represented by boxes with height representing 20-nm FHWM illumination bandwidth and width representing the bandwidth of the collected emission. (b) The absorption spectrum of hemoglobin from 250 to 650 nm (data41). Vertical dotted lines correspond to six recorded reflectance images from the MFI system. , oxygenated hemoglobin and Hb, deoxygenated hemoglobin. 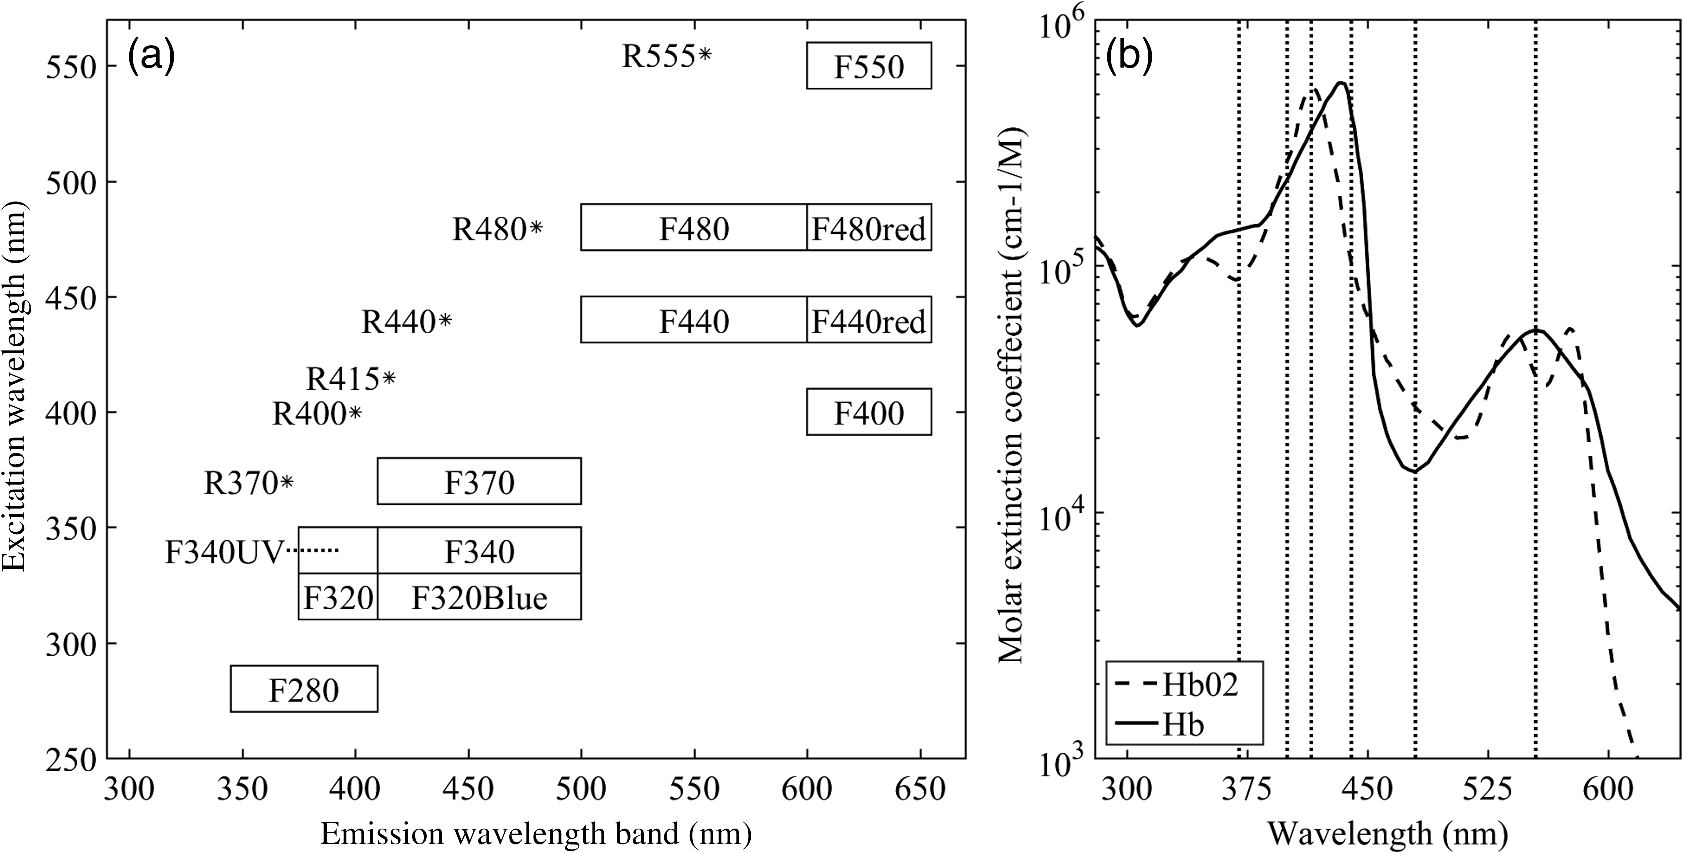 2.4.Tissue ImagingSurgical discard tissue was placed in saline immediately following surgery and transported to the MFI system. Between one and eight samples were obtained and imaged per patient with between one and five samples placed in the field of view of the system at a time. Tissues were typically imaged within 1 h of removal, but at most within 2 h of removal. Tissue was kept moist with saline before and after imaging. 2.5.Histology and Pathological EvaluationImmediately after imaging, each tissue sample was affixed to the filter paper to maintain orientation and fixed in 10% buffered formalin or Histochoice (Ameresco). Tissues were histologically processed into paraffin blocks and cut into sections. Slides were stained with hematoxylin and eosin (H&E) and a histological diagnosis of the imaged tissue obtained independent of patient diagnosis by a pathologist at the University of Arizona Cancer Center Tissue Acquisition and Cellular/Molecular Analysis Shared Resource. 2.6.Image ProcessingSystem calibration was performed to enable comparison of intensity measurements for each piece of tissue. Immediately before or after each imaging session, a uniform reflector was imaged to normalize intensity across the field of view. Additionally, illumination power measurements and images of known fluorophores were used to normalize changes in lamp power spectrum over time. Imaging was performed in a dark room to minimize background light. As a further correction, images of tissue were obtained at each filter setting with the illumination lamp on and off. The lamp-off image was subtracted from the lamp-on image to correct for changes in ambient lighting. Exposure times were verified to be the same for all images within each image type. All normalization procedures were performed on the raw intensity values from the camera detector using MATLAB™ (The MathWorks, Natick, Massachusetts). Images with the desired excitation wavelength and emission band were saved as 32-bit floating point tagged image file format (TIFF) files to maintain absolute intensity values. The result obtained was 18 recorded images per imaging sequence; six fluorescence images with UV excitation wavelengths, six fluorescence images with visible excitation wavelengths, and six reflected light images. An example image set is shown in Fig. 2. Only after all normalization procedures were performed, the tissue image gray scale values were statistically compared. Fig. 2Example of the 18 images collected on a set of tissues. Within each image, the two tissue samples on the left are histologically normal fallopian tube samples and the two samples on the right are histologically normal ovary samples. Image gray scale values have been compressed to 8 bits for display, and contrast window and level have been adjusted between rows to account for significant differences in image intensity. Thus, the intensities within a row of images are comparable, but the intensities between rows are not. 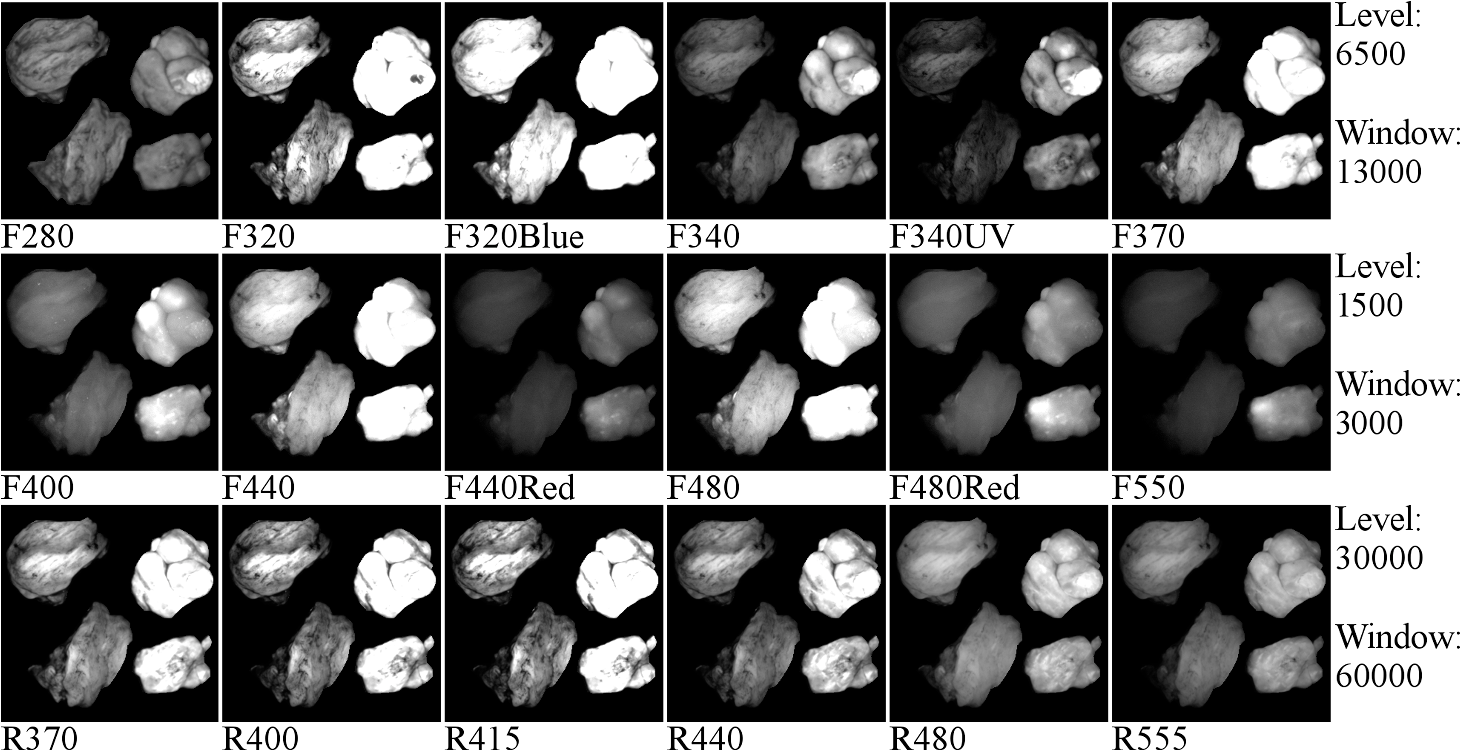 Using image analysis software (ImageJ, National Institute of Health), each set of 18 images was combined into a coregistered image stack. Each tissue within each stack was manually outlined with a many point polygon. These steps allowed simultaneous measurement of intensity statistics (mean, median, min, max, and standard error) for all tissue samples and all image types in each image stack. The area (pixels) of each tissue was also recorded. All data were then combined into a master table providing the intensity statistics, tissue type, tissue pathology, imaging date, and patient age and menopause status, if disclosed on the questionnaire, for each tissue sample. 2.7.Statistical AnalysisThree types of statistical analysis—descriptive statistics, logistic regression (LR), and quadratic discriminant analysis (QDA)—were conducted. Because of the small number of histologically confirmed cancer samples from the fallopian tube, we limited the analysis of fallopian tube samples to descriptive statistics. LR has fewer assumptions than discriminant analysis and gives a probability of an outcome based on independent variables. It is useful for evaluating data in which one or more independent variables (e.g., image type mean intensities) determine a binary outcome (e.g., cancerous versus noncancerous ovarian tissue). QDA is a method of statistical classification that uses a set of training data to build quadratic classifiers designed to predict classification (e.g., normal, benign, and cancerous pathology) given the independent variables (e.g., image type mean intensities) associated with the sample. In this study, QDA models used all sample data as a training set and were validated using resubstitution. 2.7.1.Descriptive statisticsFor ovarian and fallopian tube samples, the mean and standard error of image intensities were calculated and compared between tissue in the broad pathological categories—normal, benign, and cancerous—for each image type. For ovarian tissue, robust standard error with clustering on patient was also calculated. In general, robust standard error calculations assume independence for each sample. Since multiple tissue samples from the same patient were often obtained the variance–covariance matrices used to determine robust standard error for each tissue were clustered on the patients. Clustering allows for intragroup (multiple tissues from one patient) correlation to be accounted for appropriately.42 2.7.2.Logistic regression analysis on ovarian tissueThe University of Arizona Cancer Center Biostatistics Shared Service performed LR on ovarian sample image data using Stata13 (StataCorp LP, College Station, Texas). The ultimate goal was to determine which, if any, small combinations of image types could accurately predict whether an ovarian tissue sample was cancerous or noncancerous (normal and benign ovarian samples combined) given the mean intensities of the image types, patient age, and patient menopause status. Univariate logistic regression (ULR) was used to compare the mean intensity values of cancer versus noncancer samples for each image type in order to determine how well each individual image type performed. Previous research on cervical tissue has shown an effect of age and follicle stimulating hormone, an indicator of menopause, on fluorescence and reflectance spectroscopy.43 Age and menopause status were examined for significant impact on image intensity in the ULR models for all image types so corrections could be made if necessary. Finally, two multivariate logistic regression (MLR) models were determined with best predictive values from small subsets of image types. One model was determined using fluorescence image types and the other used reflectance image types. In each model, a small subset of image types was generated by exploring the relationships between image types using correlation and bivariate LR. Pairs of image types with very high correlation were determined and only the better fitting of the image types was retained in the model. This process was repeated to determine a small subset of image types with low cross-correlation for each MLR model. The receiver operating characteristic (ROC) curves and respective area under the curve (AUC) for each model was calculated using STATA’s built-in postestimation command. Both ULR and MLR were performed using robust variance estimates clustered on patient, to account for the potential correlation of tissues within the same patient. 2.7.3.Quadratic discriminant analysis on ovarian tissueQDA was used to build -dimensional quadratic surfaces to separate the data by pathology given image mean intensities from of the image types. Recording and analyzing 18 image types was impractical for future clinical devices. QDA was used to determine which subsets of image types are most efficient at predicting the correct pathology. Each subset was tested using resubstitution of the data into the model. 3.ResultsThe number of samples, number of patients, mean age, and age range for each tissue classification (tissue type and pathology) is shown in Table 1. Tissue samples were not available for 4 of the 28 consented patients. At least one sample of ovarian tissue was received from 24 patients, resulting in 47 pieces of ovarian tissue. Of the 47 samples, 35 were pathologically normal, 7 were cancerous (serous adenocarcinoma), and 5 had a noncancerous benign condition (two mucinous cystadenoma and three simple cysts). Fallopian tube samples were collected and imaged from 21 patients. In total, 31 fallopian tube samples were imaged with 21 being normal, 1 cancer (serous adenocarcinoma), and 9 benign (mild fibrosis). The age range was between 22 and 73 years with a mean age of 49.5. Table 1Characteristics of patients and tissues imaged.
3.1.Tissue Sample Intensity Descriptive StatisticsThe mean fluorescence and reflectance image intensity and standard error for normal, benign, and cancerous ovarian and fallopian tube tissue samples are shown in Figs. 3(a) and 3(b), respectively. The absolute intensity values of fallopian tube samples are generally a factor of 2 to 3 times lower than the ovarian samples for all image types, but relative changes between pathologies are similar. For all image types and both tissue types, the image intensity from samples with benign conditions had a higher mean intensity than the normal samples, whereas cancerous samples had lower mean image intensity than normal samples. Fig. 3Mean (a) ovarian and (b) fallopian tube tissue intensity and standard error for each pathological group normalized to the normal group mean intensity for each image type. Standard error bars for ovarian tissue are robust standard error. Error bars are not shown for cancerous fallopian tube due to a sample size of one. 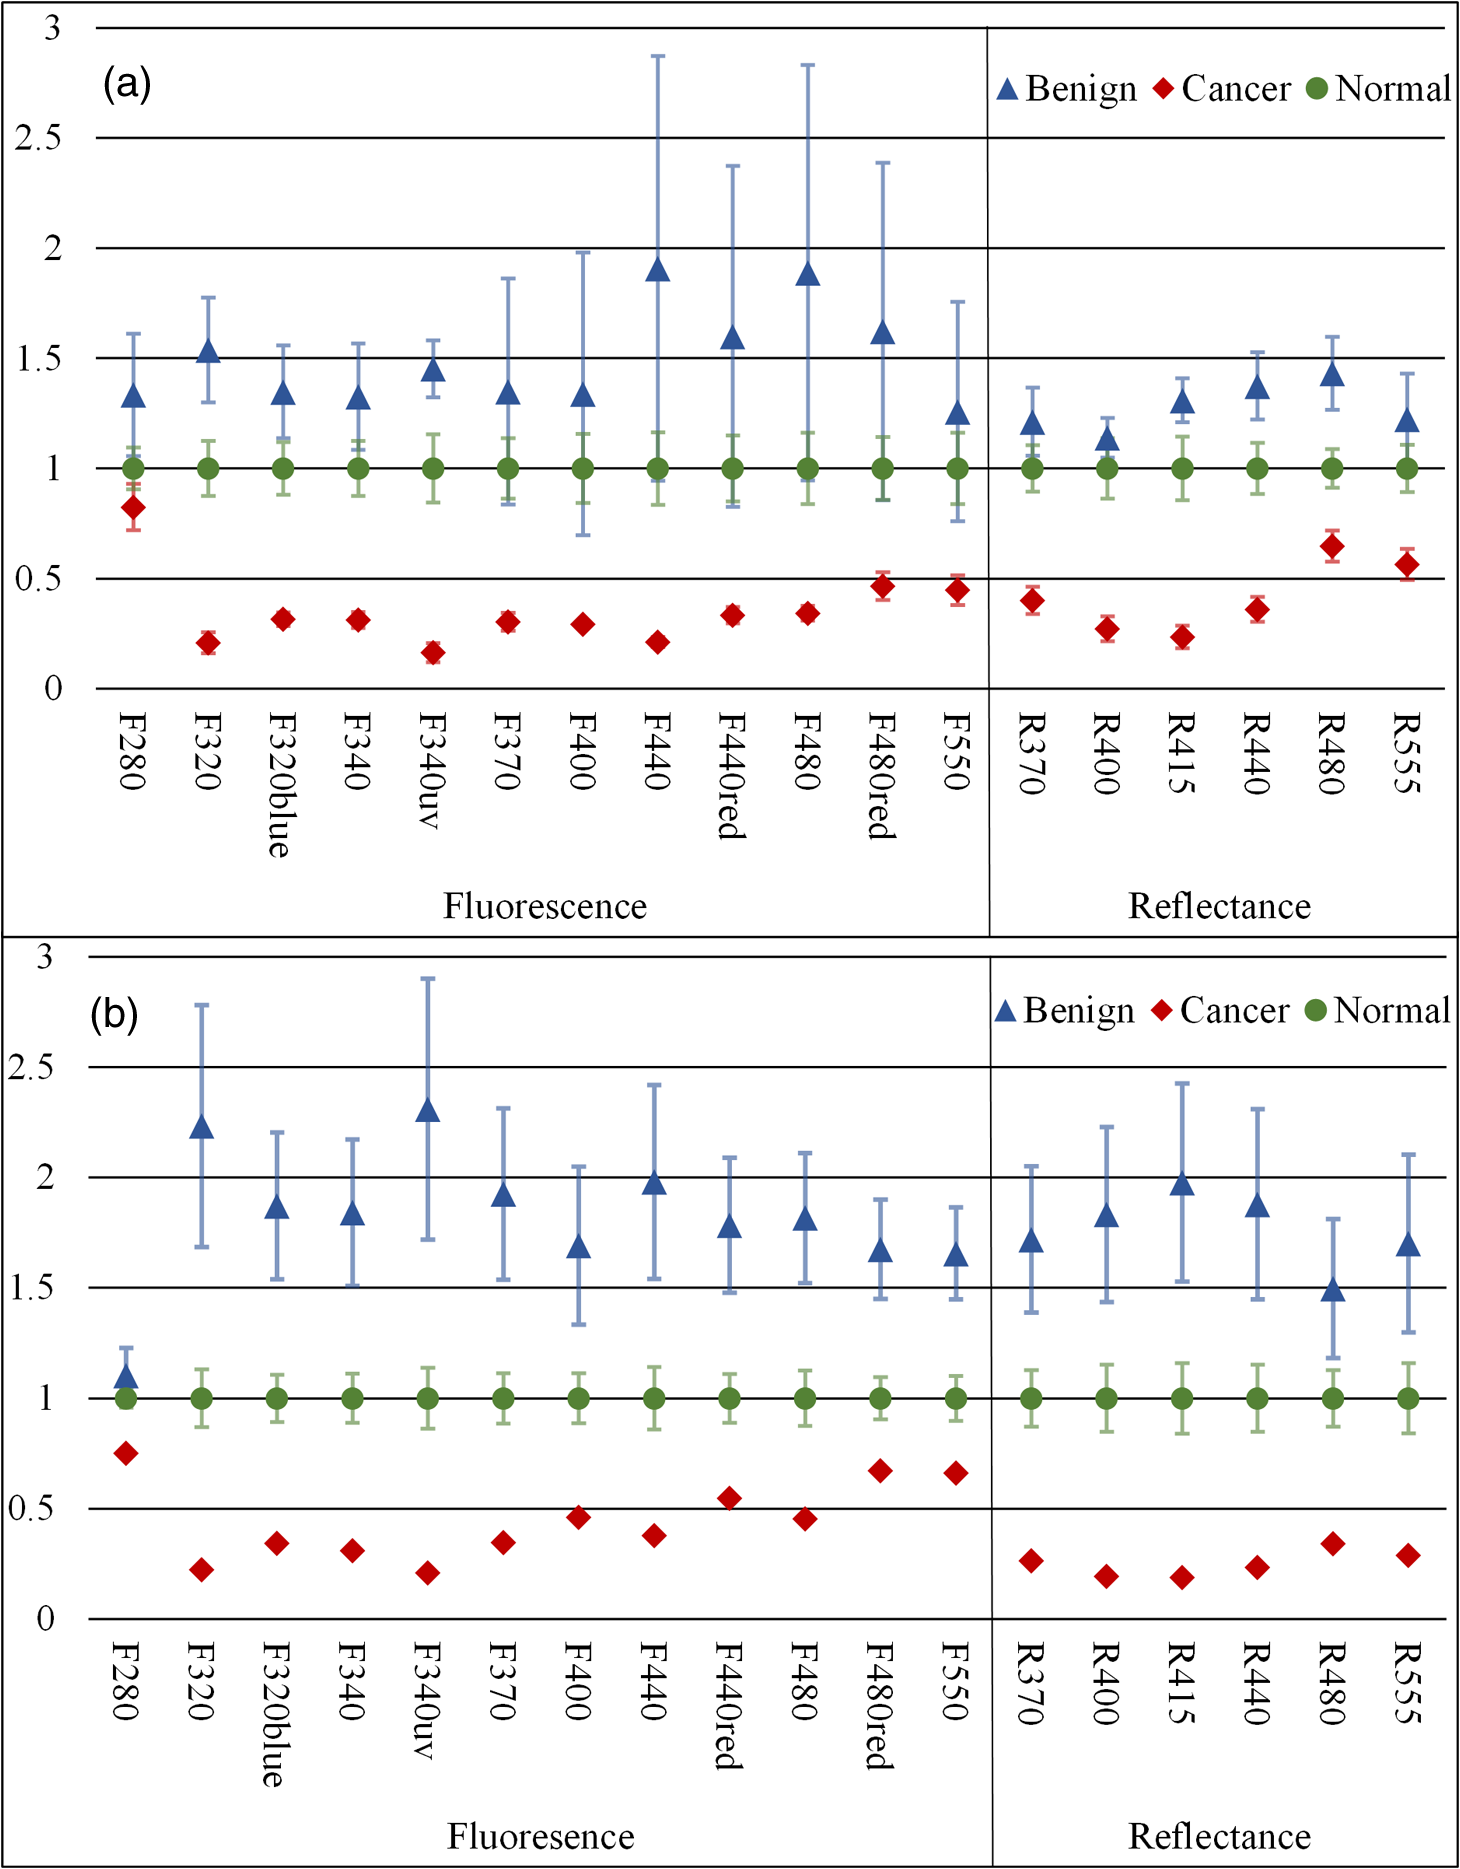 3.2.Logistic RegressionULR models were used to determine age and menopause effects as well as statistical significance between intensities for cancerous and noncancerous ovarian tissue for each image type. Twelve patients were known to be premenopause, seven patients were known to be postmenopause, and five patients had uncertain menopausal status (two undisclosed, two perimenopause, and one prior hysterectomy). All patients provided age information, which was considered a categorical variable ( and ). The cutoff was chosen because it completely separated all known pre and postmenopausal patients. Age did not have a statistically significant impact on measured intensity in all image type ULR models (). Thus, age and menopausal status were removed from all following statistical analyses for simplicity. All ULR models demonstrated statistical significance () between cancer and noncancerous ovarian tissue except fluorescence using 280-nm excitation (). MLR models were developed to evaluate the predictive power of small subsets of image types. For the fluorescence data, the best fitting MLR model was determined to use image types F440 and F480 (). For the reflectance data, the best fitting MLR model used image types R440 and R480 (). The ROC curves, generated using STATA’s built-in postestimation commands, for the fluorescence and reflectance models’ ability to predict whether an ovarian tissue sample was cancerous are shown in Fig. 4. The AUCs were 0.9036 and 0.9464 for the fluorescence and reflectance models, respectively. LR analysis examined cancer against noncancerous samples; thus, an image type’s ability to discriminate between normal and benign pathologies was not considered. 3.3.Quadratic Discriminant AnalysisQDA was applied to the ovarian data with the mean intensities from each of the 18 image types being the independent variables. Age and menopause status were omitted based on the results from the ULR models. QDA was run on every possible subset of image types from size 2 to 18. There are possible subsets for a set of 18 elements. Eliminating the one way to choose zero elements from the set and 18 ways to choose one element resulted in 262,125 subsets of image types analyzed with QDA. Multivariate normality, an assumption of QDA, was tested for each subset using the Mardia kurtosis test. For a subset of image types, QDA determines the two -dimensional surfaces that best separates all tissue samples by pathology. After the model was created from the tissue sample image intensities, each sample was tested by resubstitution into the model to determine whether the model accurately classified the tissue. The classification accuracy and type of misclassifications for each QDA model were recorded. A good subset of image types was defined as one that had a -value in the kurtosis test and had at most one tissue sample misclassified by resubstitution. There were 56 subsets that passed the Mardia kurtosis test and had zero resubstitution error. The subsets ranged in size between 5 and 9 image types. Similarly, there were 1256 subsets with one resubstitution mistake ranging in subset size 4 to 10. Subset sizes of 6 and 7 produced the majority of good subsets. The frequency that each image type appeared in a good image subset is shown in Fig. 5. 3.4.Qualitative VisualizationOf the seven image type subsets of size 5 determined by QDA to have zero resubstitution error, the representative subset of image types F320blue, F370, R400, R415, and R480 is shown in Fig. 6. Three representative tissue samples are shown of each broad category of pathology (normal, benign, and cancer). Of the five benign samples, the middle three in terms of average image intensity were chosen. The samples with the second, fourth, and sixth most intense images were chosen from the seven available cancer samples. The three normal samples were chosen at approximately the 25th, 50th, and 75th percentile in average image intensity of all normal samples. Thus, the samples are representative of the range of intensities from each pathologic group. The reflectance images have much higher intensity than fluorescence images so a logarithmic transformation has been applied to the image for display purposes. Fig. 6Representative images of ovarian tissue. Within each column, the top three tissues are cancer samples, the middle three are normal samples and the bottom three are benign samples. The three samples for each pathology are representative of the range of intensities measured for the given pathology. From left to right, the columns are image type F320blue, F370, R400, R415, and R480. The QDA model using these five image types had zero resubstitution errors. The images are saved as floating point TIFF files for statistical comparison. The significant differences in intensities and dynamic range between image types require the images to be log scaled for visualization with the same window and level settings. 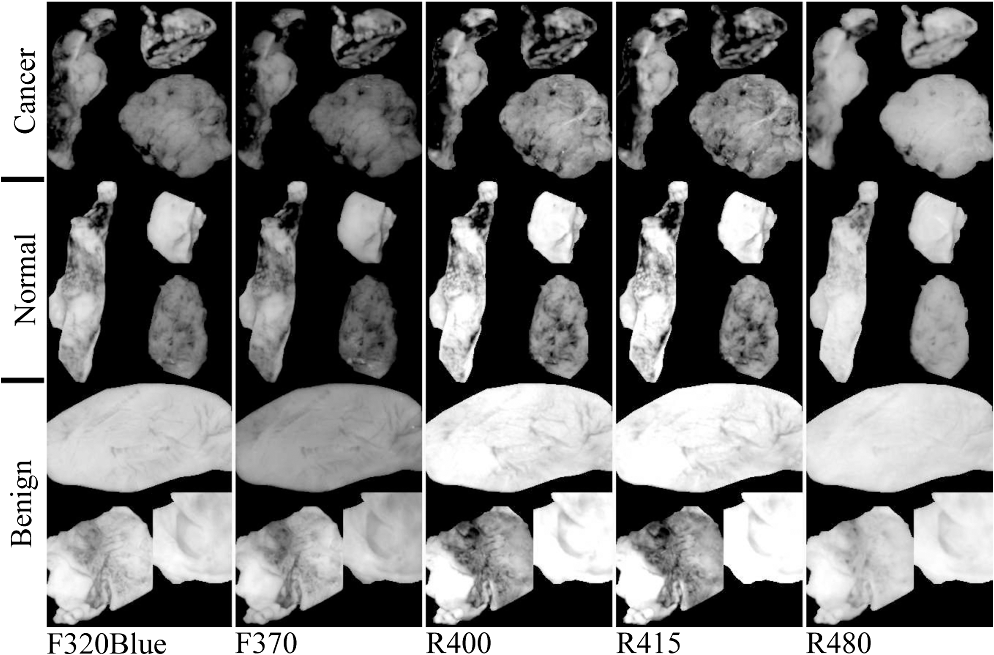 4.DiscussionThe results of the ex vivo study support further development of multispectral fluorescence and reflectance imaging to predict ovarian and fallopian tube tissue pathology. Both the LR and QDA models showed promising results. The MLR models showed strong classification performance () for detecting cancer that can be obtained using only the image intensity from reflectance or fluorescence images at excitation wavelengths of 440 and 480 nm, whereas QDA showed perfect classification of normal, cancerous, and benign tissues using as little as five reflectance and fluorescence image types. A limitation of this study was the small number of benign and cancerous tissue samples, which required tissue samples to be classified in broad pathological groups for analysis. Further, a detailed statistical analysis of fallopian tube data was not possible due to having only one cancerous sample. Further, study with a larger number of samples is needed to corroborate these findings; however, the good results and consistent trends provide confidence in MFI’s ability to discriminate between normal, benign, and cancerous ovarian tissue. The overall decreased image intensity in cancerous tissue and increased intensity in benign tissue aligns with expected changes in tissue optical properties.11 Tissue pathology determines tissue composition and thus the concentration and distribution of fluorophores as well as the optical absorption and scattering coefficients. The dominant absorber in the UV and visible spectrum is hemoglobin [Fig. 1(b)]. Neovascularization is a hallmark of cancer and is expected to increase the blood volume fraction and thus absorption in cancerous tissue. Examination of Fig. 3 shows that cancerous tissue has the lowest relative reflectance image intensity at 415 nm, near the hemoglobin absorption peaks, and the highest relative reflectance image intensity at 480 nm, which is near a trough in hemoglobin absorption. Cancerous ovarian tissue has been shown to have significantly less collagen content than normal tissue, which is correlated with decreased scattering coefficient.44 Thus, the increased absorption and decreased scattering are expected to decrease reflectance image intensity. Increased absorption will also cause decreased fluorescence image intensity due to overlap of the hemoglobin absorption spectrum with both the excitation and emission wavelengths. Upon visual evaluation of the H&E slides, all benign ovary (three mucinous cystadenoma and two simple cysts) and fallopian tube (nine mild fibrosis) samples had increased collagen relative to normal. The strong scattering and fluorescence of collagen may be the mechanism behind the benign samples having increased reflectance and fluorescence image intensity. All image types except F280 showed statistically significant discrimination between cancerous and noncancerous ovarian tissue in the ULR models. For the MLR and QDA models, image types with excitation or emission wavelengths at or around the hemoglobin absorption peaks and troughs generally showed the strongest discrimination. Image types R400 and R415, both sampling the left side of the blood absorption peak, were included in over 92% of the good QDA subsets. The illumination wavelengths of 440 and 480 nm were chosen in both the fluorescence and reflectance MLR models as the best predictors of tissue pathology. The process of determining variables for the MLR models eliminated image types with high covariance and thus redundant information. Since 440 nm is near the deoxyhemoglobin absorption peak while 480 nm is in a trough, the image types acquired with these illumination wavelengths may present the strongest and weakest effects of blood absorption, respectively, in these samples. Of the fluorescence image types, F480 was determined a strong discriminator by MLR and most frequently occurred in good QDA subsets. Unlike the other wavelengths with strong discrimination between pathology, the excitation, and emission band of F480 are expected to have relatively low influence from blood absorption. The fluorescence from F480 has been shown to be higher for normal than cancer tissue in previous fiber probe studies, due to the primary excited fluorophores of FAD and collagen.23 Of interest are the possible reasons, F280 was the only image type not showing significant discrimination between cancerous and noncancerous tissue in the ULR models. The excitation and emission bands are moderately affected by hemoglobin absorption. However, previous studies on colon tissue with the same imaging device have shown that optical penetration decays exponential with a decay at for 280-nm excitation and for 440-nm excitation.45 Biological tissue has increased scattering with decreased wavelength, and in the ultraviolet spectrum, tissue scattering significantly limits optical penetration. Anatomically, the ovarian epithelium is about thick and lacks vasculature in normal pathology. Thus, hemoglobin absorption effects are expected to be minimal for 280-nm excitation. Previous studies have indicated that excitation below 300 nm produces the highest fluorescence in cancerous ovarian tissue and lowest in benign tissue, when performing point spectroscopy.11 An excitation wavelength of 280 nm primarily excites the amino acid tryptophan, which is believed to be more abundant in cancerous tissue due to an increase in protein synthesis.11,24 Imaging geometries have been shown to be more sensitive to blood absorption effects compared to probe spectroscopy.46 Increased angiogenesis in cancerous samples may bring vasculature within of the surface. It is possible that the attenuating effects of blood absorption (enhanced in our illumination-detection geometry) are countering the increased fluorescence from amino acids in the cancerous samples, and the net result is a similar intensity for all pathologies at F280. Prior studies on colon cancer using the multispectral imager used in this study have also shown slightly decreased intensity for cancerous tissue for F280 images.40 Further examination of the QDA results provides additional insight. Of the top seven most frequently occurring image types (F320blue, F340, F480, R370, R400, R415, and R440), only 2 of the 1312 good subsets were constructed exclusively of these image types. The full set of seven and the subset excluding R440 both passed the kurtosis test and both only misclassified one benign ovary tissue sample as normal. Thus the best performing sets included some, but not all of the most frequently occurring image types. Of the image subsets of size five or six that had perfect resubstitution, all 18 image types occurred at least once. This finding is likely due to two reasons. First, the illumination and fluorescence emission wavelengths have already been chosen based on their ability to sample the most commonly occurring chromophores and fluorophores in tissue. Therefore, it is not surprising that they all perform well. Also, the MLR modeling identified high covariance between many image types, suggesting that similar performance could be obtained with varying image types. Although the primary analysis focused on the ovarian tissue samples, the fallopian tube samples’ descriptive statistics show trends very similar to those of the ovarian samples. The primary difference between the tissue types is the uniformly reduced image intensity for fallopian tube samples. The reduction in intensity may be primarily due to a naturally occurring higher concentration of hemoglobin and decreased collagen in the fallopian tube samples. In addition to the limited number of benign and cancerous samples discussed above, there were two other limitations of this study. First, since no effective method of detecting early-stage ovarian cancer exists, it is challenging to acquire early-stage cancer samples, and all cancerous samples used in this study were advanced stage. It is unknown, if early-stage cancer has the same imaging characteristics. Most of the surgeries contributing tissue to this study were prophylactic for high-risk women or to address other gynecological issues. In some cases, tissue was received from patients with confirmed ovarian cancer, but the particular samples received for the study did not show signs of cancer upon independent-pathological evaluation. These challenges make studying human ovarian cancer development difficult. The investigators have previously shown the ability to follow disease development in a mouse model of ovarian cancer;28 however, that carcinogen-driven model did not mimic the usual development of ovarian cancer in women. Imaging of a mouse model that accurately mimicked the development of human ovarian cancer would enable the determination of the earliest stage at which MFI could accurately detect cancer. Second, tissues were measured postresection and do not reflect the in vivo state. All samples were imaged within 2 h of removal and most typically from 30 to 60 min after removal. In research on resected human colon tissue, it has been noted that different fluorophores decay at different rates after resection. For example, reduced nicotinamide adenine dinucleotide decays exponentially with a half-life of 118 min, while collagen and FAD remain relatively constant.47,48 One sample in this study containing two ovaries and two fallopian tubes was imaged twice with a 4-min delay between acquisition sequences. With all other variables being equal, the average image intensity of ovarian samples 1 and 2 decreased by 0.09% and 0.90%, respectively, while the average image intensity of fallopian tube samples 1 and 2 decreased by 3.27% and 3.34%, respectively. These results suggest that future studies should endeavor to image samples as soon as possible after resection and at a consistent time after resection. They also suggest that there will be differences between image intensities seen in this ex vivo study and future in vivo studies. Future work will involve more sophisticated image processing and hardware modifications. Ratiometric imaging can be utilized to help decouple the effects of tissue absorption and scattering on fluorescence. For example, fluorescence images can be divided by green reflectance images (R555) to help isolate relative intrinsic fluorescence strength from blood absorption.45,49,50 Using this ratiometric imaging approach, it may be possible to create image contrast proportional to the changes in endogenous fluorescence demonstrated by spectroscopic analysis.11,24,40 Work to integrate the MFI imaging system into an endoscope designed to image inside the fallopian tubes and at the ovary is in progress.51 The xenon arc lamp can be replaced with laser sources coupled into a multimode illumination fiber. Based on laser availability, wavelengths of 250 nm (tripled Alexandrite), 375 nm (doubled Alexandrite), 442 nm (He:Cd), 543 nm (green He:Ne), and 638 nm (diode) are initially planned for an endoscopic system. These wavelengths provide images most similar to the F280, F370, F440, F440red, F555, R370, R440, and R555 image types utilized in this study. Running the QDA model with these eight image types produced six multivariate normal subsets with only two resubstitution errors (two benign tissue samples misclassified as normal—all normal and cancer samples were accurately classified), suggesting that these wavelengths are reasonable initial choices. With a large field of view, MFI will also serve for navigation. Endoscopic in vivo imaging adds the challenge of a complex tissue geometry being imaged over a wide field of view and with a large depth of focus. Correcting the dynamically changing nonuniform radiometric distribution across the image for comparison of absolute tissue intensities is impractical. In addition to the benefits of ratiometric imaging mentioned above, using real-time ratiometric imaging can help normalize the image intensities across the field. Proper ratiometric combination of image types can create images in which suspicious regions have high relative contrast compared to adjacent normal tissue. A high-resolution technique (OCT) can be added to interrogate suspicious areas, potentially heightening accuracy of the overall system. Adaption of the system for future in vivo fallopian tube and ovary endoscopic imaging may provide a minimally invasive and highly sensitive screening device for ovarian cancer without the use of exogenous contrast agents. AcknowledgmentsThis work was supported by the Department of Defense OCRP OC120140, The University of Arizona Cancer Center Support Grant No. P30CA023074. References
“Cancer Facts & Figures,”
20152016). http://www.cancer.org/research/cancerfactsstatistics/cancerfactsfigures2015/index Google Scholar
I. J. Jacobs et al.,
“Ovarian cancer screening and mortality in the UK Collaborative Trial of Ovarian Cancer Screening (UKCTOCS): a randomised controlled trial,”
Lancet, 387 917
–1026
(2015). http://dx.doi.org/10.1016/S0140-6736(15)01224-6 LANCAO 0140-6736 Google Scholar
L. T. Shuster et al.,
“Prophylactic oophorectomy in pre-menopausal women and long term health—a review,”
Menopause Int., 14
(3), 111
–116
(2008). http://dx.doi.org/10.1258/mi.2008.008016 Google Scholar
W. H. Parker et al.,
“Long-term mortality associated with oophorectomy compared with ovarian conservation in the nurses’ health study,”
Obstet. Gynecol., 121
(4), 709
–716
(2013). http://dx.doi.org/10.1097/AOG.0b013e3182864350 Google Scholar
K. Eagle and J. A. Ledermann,
“Tumor markers in ovarian malignancies,”
Oncologist, 2
(5), 324
–329
(1997). Google Scholar
B. C. Vanderhyden,
“Loss of ovarian function and the risk of ovarian cancer,”
Cell Tissue Res., 322
(1), 117
–124
(2005). http://dx.doi.org/10.1007/s00441-005-1100-1 Google Scholar
A. M. Karst, K. Levanon and R. Drapkin,
“Modeling high-grade serous ovarian carcinogenesis from the fallopian tube,”
Proc. Natl. Acad. Sci. U. S. A., 108
(18), 7547
–7552
(2011). http://dx.doi.org/10.1073/pnas.1017300108 Google Scholar
E. Kuhn, R. J. Kurman and I.-M. Shih,
“Ovarian cancer is an imported disease: fact or fiction?,”
Curr. Obstet. Gynecol. Rep., 1
(1), 1
–9
(2012). http://dx.doi.org/10.1007/s13669-011-0004-1 Google Scholar
M.-C. King et al.,
“Breast and ovarian cancer risks due to inherited mutations in BRCA1 and BRCA2,”
Science, 302
(5645), 643
–646
(2003). http://dx.doi.org/10.1126/science.1088759 SCIEAS 0036-8075 Google Scholar
L. P. Hariri et al.,
“Laparoscopic optical coherence tomography imaging of human ovarian cancer,”
Gynecol. Oncol., 114
(2), 188
–194
(2009). http://dx.doi.org/10.1016/j.ygyno.2009.05.014 GYNOA3 Google Scholar
M. A. Brewer et al.,
“Imaging of the ovary,”
Technol. Cancer Res. Treat., 3
(6), 617
–627
(2004). https://doi.org/10.1177/153303460400300612 Google Scholar
T. Wang, M. Brewer and Q. Zhu,
“An overview of optical coherence tomography for ovarian tissue imaging and characterization,”
Wiley Interdiscip. Rev. Nanomed. Nanobiotechnol., 7 1
–16
(2014). http://dx.doi.org/10.1002/wnan.1306 Google Scholar
Y. Yang et al.,
“Integrated optical coherence tomography, ultrasound and photoacoustic imaging for ovarian tissue characterization,”
Biomed. Opt. Express, 2
(9), 2551
–2561
(2011). http://dx.doi.org/10.1364/BOE.2.002551 BOEICL 2156-7085 Google Scholar
J. G. Fujimoto et al.,
“Optical biopsy and imaging using optical coherence tomography,”
Nat. Med., 1
(9), 970
–972
(1995). http://dx.doi.org/10.1038/nm0995-970 1078-8956 Google Scholar
A. A. Tanbakuchi et al.,
“Clinical confocal microlaparoscope for real-time in vivo optical biopsies,”
J. Biomed. Opt., 14
(4), 044030
(2009). http://dx.doi.org/10.1117/1.3207139 JBOPFO 1083-3668 Google Scholar
T.-Y. Wu et al.,
“Confocal microlaparoscope for imaging the fallopian tube,”
J. Biomed. Opt., 19
(11), 116010
(2014). http://dx.doi.org/10.1117/1.JBO.19.11.116010 JBOPFO 1083-3668 Google Scholar
A. A. Tanbakuchi et al.,
“In vivo imaging of ovarian tissue using a novel confocal microlaparoscope,”
Am. J. Obstet. Gynecol., 202
(1), 90.e1
–90.e9
(2010). http://dx.doi.org/10.1016/j.ajog.2009.07.027 AJOGAH 0002-9378 Google Scholar
M. D. Risi et al.,
“Pilot clinical evaluation of a confocal microlaparoscope for ovarian cancer detection,”
Int. J. Gynecol. Cancer, 26 248
–254
(2016). http://dx.doi.org/10.1097/IGC.0000000000000595 IJGCEN Google Scholar
N. D. Kirkpatrick, M. A. Brewer and U. Utzinger,
“Endogenous optical biomarkers of ovarian cancer evaluated with multiphoton microscopy,”
Cancer Epidemiol. Biomarkers Prev., 16
(10), 2048
–2057
(2007). http://dx.doi.org/10.1158/1055-9965.EPI-07-0009 Google Scholar
J. Adur et al.,
“Optical biomarkers of serous and mucinous human ovarian tumor assessed with nonlinear optics microscopies,”
PLoS One, 7
(10), e47007
(2012). http://dx.doi.org/10.1371/journal.pone.0047007 POLNCL 1932-6203 Google Scholar
H. Li et al.,
“Utilizing spatial and spectral features of photoacoustic imaging for ovarian cancer detection and diagnosis,”
J. Biomed. Opt., 20
(1), 016002
(2015). http://dx.doi.org/10.1117/1.JBO.20.1.016002 JBOPFO 1083-3668 Google Scholar
P. D. Kumavor et al.,
“Co-registered pulse-echo/photoacoustic transvaginal probe for real time imaging of ovarian tissue,”
J. Biophotonics, 6
(6–7), 475
–484
(2013). http://dx.doi.org/10.1002/jbio.201200163 Google Scholar
S. D. Kamath, S. Ray and K. K. Mahato,
“Photoacoustic spectroscopy of ovarian normal, benign, and malignant tissues: a pilot study,”
J. Biomed. Opt., 16
(6), 067001
(2011). http://dx.doi.org/10.1117/1.3583573 JBOPFO 1083-3668 Google Scholar
R. George et al.,
“Parallel factor analysis of ovarian autofluorescence as a cancer diagnostic,”
Lasers Surg. Med., 44
(4), 282
–295
(2012). http://dx.doi.org/10.1002/lsm.22014 LSMEDI 0196-8092 Google Scholar
T. E. Renkoski, K. D. Hatch and U. Utzinger,
“Wide-field spectral imaging of human ovary autofluorescence and oncologic diagnosis via previously collected probe data,”
J. Biomed. Opt., 17
(3), 036003
(2012). http://dx.doi.org/10.1117/1.JBO.17.3.036003 JBOPFO 1083-3668 Google Scholar
R. A. Bhat et al.,
“Autofluorescence of normal, benign, and malignant ovarian tissues: a pilot study,”
Photomed. Laser Surg., 27
(2), 325
(2009). http://dx.doi.org/10.1089/pho.2008.2261 Google Scholar
J. N. McAlpine et al.,
“Autofluorescence imaging can identify preinvasive or clinically occult lesions in fallopian tube epithelium: a promising step towards screening and early detection,”
Gynecol. Oncol., 120
(3), 385
–392
(2011). http://dx.doi.org/10.1016/j.ygyno.2010.12.333 GYNOA3 Google Scholar
J. M. Watson et al.,
“In vivo time-serial multi-modality optical imaging in a mouse model of ovarian tumorigenesis,”
Cancer Biol. Ther., 15
(1), 42
–60
(2014). http://dx.doi.org/10.4161/cbt.26605 Google Scholar
B. L. Wen et al.,
“Texture analysis applied to second harmonic generation image data for ovarian cancer classification,”
J. Biomed. Opt., 19
(9), 096007
(2014). http://dx.doi.org/10.1117/1.JBO.19.9.096007 JBOPFO 1083-3668 Google Scholar
D. Granot et al.,
“In vivo imaging of the systemic recruitment of fibroblasts to the angiogenic rim of ovarian carcinoma tumors,”
Cancer Res., 67
(19), 9180
–9189
(2007). http://dx.doi.org/10.1158/0008-5472.CAN-07-0684 Google Scholar
R. M. Williams et al.,
“Strategies for high-resolution imaging of epithelial ovarian cancer by laparoscopic nonlinear microscopy,”
Transl. Oncol., 3
(3), 181
–194
(2010). http://dx.doi.org/10.1593/tlo.09310 Google Scholar
U. Alqasemi et al.,
“Interlaced photoacoustic and ultrasound imaging system with real-time coregistration for ovarian tissue characterization,”
J. Biomed. Opt., 19
(7), 076020
(2014). http://dx.doi.org/10.1117/1.JBO.19.7.076020 JBOPFO 1083-3668 Google Scholar
C. J. Engelbrecht et al.,
“Ultra-compact fiber-optic two-photon microscope for functional fluorescence imaging in vivo,”
Opt. Express, 16
(8), 5556
(2008). http://dx.doi.org/10.1364/OE.16.005556 OPEXFF 1094-4087 Google Scholar
M. T. Myaing, D. J. MacDonald and X. Li,
“Fiber-optic scanning two-photon fluorescence endoscope,”
Opt. Lett., 31
(8), 1076
(2006). http://dx.doi.org/10.1364/OL.31.001076 OPLEDP 0146-9592 Google Scholar
J. C. Jung and M. J. Schnitzer,
“Multiphoton endoscopy,”
Opt. Lett., 28
(11), 902
(2003). http://dx.doi.org/10.1364/OL.28.000902 OPLEDP 0146-9592 Google Scholar
M. J. Levene,
“In vivo multiphoton microscopy of deep brain tissue,”
J. Neurophysiol., 91
(4), 1908
–1912
(2004). http://dx.doi.org/10.1152/jn.01007.2003 JONEA4 0022-3077 Google Scholar
H. Bao et al.,
“Fast handheld two-photon fluorescence microendoscope with a field of view for in vivo imaging,”
Opt. Lett., 33
(12), 1333
(2008). http://dx.doi.org/10.1364/OL.33.001333 OPLEDP 0146-9592 Google Scholar
G. Liu et al.,
“Multiphoton microscopy system with a compact fiber-based femtosecond-pulse laser and handheld probe,”
J. Biophotonics, 4
(1–2), 34
–39
(2011). http://dx.doi.org/10.1002/jbio.201000049 Google Scholar
R. Drezek et al.,
“Understanding the contributions of NADH and collagen to cervical tissue fluorescence spectra: modeling, measurements, and implications,”
J. Biomed. Opt., 6
(4), 385
–396
(2001). http://dx.doi.org/10.1117/1.1413209 JBOPFO 1083-3668 Google Scholar
T. E. Renkoski et al.,
“Ratio images and ultraviolet C excitation in autofluorescence imaging of neoplasms of the human colon,”
J. Biomed. Opt., 18
(1), 16005
(2013). http://dx.doi.org/10.1117/1.JBO.18.1.016005 JBOPFO 1083-3668 Google Scholar
S. Prahl,
“Tabulated molar extinction coefficient for hemoglobin in water,”
(2015) http://omlc.org/spectra/hemoglobin/summary.html March ). 2015). Google Scholar
StataCorp, User’s Guide, Stata 14, Stata Press, College Station, Texas
(2015). Google Scholar
E. N. Atkinson,
“Age and FSH effects in fluorescence spectra from the cervix: an exploratory analysis,”
Gynecol. Oncol., 99
(3 Suppl.), S95
–S97
(2005). http://dx.doi.org/10.1016/j.ygyno.2005.07.051 GYNOA3 Google Scholar
Y. Yang et al.,
“Optical scattering coefficient estimated by optical coherence tomography correlates with collagen content in ovarian tissue,”
J. Biomed. Opt., 16
(9), 090504
(2011). http://dx.doi.org/10.1117/1.3625247 JBOPFO 1083-3668 Google Scholar
B. Banerjee et al.,
“Tryptophan autofluorescence imaging of neoplasms of the human colon,”
J. Biomed. Opt., 17
(1), 016003
(2012). http://dx.doi.org/10.1117/1.JBO.17.1.016003 JBOPFO 1083-3668 Google Scholar
S. C. Gebhart, S. K. Majumder and A. Mahadevan-Jansen,
“Comparison of spectral variation from spectroscopy to spectral imaging,”
Appl. Opt., 46
(8), 1343
(2007). http://dx.doi.org/10.1364/AO.46.001343 APOPAI 0003-6935 Google Scholar
K. T. Schomacker et al.,
“Ultraviolet laser-induced fluorescence of colonic tissue: basic biology and diagnostic potential,”
Lasers Surg. Med., 12
(1), 63
–78
(1992). http://dx.doi.org/10.1002/lsm.1900120111 LSMEDI 0196-8092 Google Scholar
E. Crowell et al.,
“Correlation coefficient mapping in fluorescence spectroscopy: tissue classification for cancer detection,”
Anal. Chem., 77
(5), 1368
–1375
(2005). http://dx.doi.org/10.1021/ac049074 ANCHAM 0003-2700 Google Scholar
R. S. Bradley and M. S. Thorniley,
“A review of attenuation correction techniques for tissue fluorescence,”
J. R. Soc. Interface, 3
(6), 1
–13
(2006). http://dx.doi.org/10.1098/rsif.2005.0066 1742-5689 Google Scholar
J. Y. Qu and J. Hua,
“Calibrated fluorescence imaging of tissue in vivo,”
Appl. Phys. Lett., 78
(25), 4040
–4042
(2001). http://dx.doi.org/10.1063/1.1379980 APPLAB 0003-6951 Google Scholar
T. Tate et al.,
“Optical design of an optical coherence tomography and multispectral fluorescence imaging endoscope to detect early stage ovarian cancer,”
Proc. SPIE, 9293 92931F
(2014). http://dx.doi.org/10.1117/12.2073824 Google Scholar
BiographyTyler H. Tate received his BA degree in mathematics and philosophy from the University of Portland and is currently a doctoral candidate in the College of Optical Sciences at the University of Arizona. His research focuses on multispectral fluorescence and optical coherence imaging of ovarian cancer. This includes the optical design and fabrication of dual-modality miniature endoscopes with the ultimate goal of providing a minimally invasive screening method for early-stage ovarian cancer detection. Photini F. S. Rice holds an associates in applied science in medical technology and has American Society for Clinical Pathology certification. She worked 13 years as a medical technologist and technical consultant in a clinical laboratory, including achieving CLIA (Clinical Laboratory Improvement Amendments) certification for the laboratory. Currently she is a senior research specialist at the University of Arizona with 7 years of experience in cardiovascular research and the past 9 years in cancer imaging. Jennifer Watson Koevary received her bachelor’s degree in mechanical engineering and health sciences and PhD in biomedical engineering with a minor in entrepreneurship. Her scientific expertise includes optical imaging and automated analysis methods. Currently, she leads several University of Arizona programs, including a Gap Funding Program for developing university inventions, an SBIR/STTR Assistance Program that provides resources to university start-ups, and the UA NSF I-Corps Site Program, which educates academic teams who have commercialization interest. Ariel C. Nymeyer received her bachelor’s degree from the University of Arizona in biomedical engineering with a focus in biomechanics. Currently, she is a manufacturing/sustaining engineer at the SynCardia Systems, the manufacturer of the world’s first and only FDA, Health Canada and CE (Europe) approved total artificial heart. Weston A. Welge received his BS degree in electrical and computer engineering and BA degree in history from the University of Colorado at Boulder, and MS degree in optical sciences from the University of Arizona. He is a doctoral student at the College of Optical Sciences at the University of Arizona. His research focuses on the development of miniature optical endoscopes and applications of OCT for early cancer detection. Kenneth D. Hatch is a professor of obstetrics and gynecology at the University of Arizona. He was a chairman from 1994 to 2014. He has been the president of the Society of Gynecologic Oncologists, the Society of Pelvic Surgeons, and the American Society of Colposcopy and Cervical Pathology. He is a fellow of the American College of Obstetricians and Gynecologists and the American College of Surgeons. He is an innovator in minimally invasive surgery. Setsuko K. Chambers is a nationally recognized physician-scientist elected to the Institute of Medicine. She has expertise spanning very basic thorough translational research, clinical trials including investigator-initiated clinical trials, to active clinical care. She collaborates actively with the Imaging Program. She has directed a laboratory devoted to understand the molecular basis for breast and ovarian cancer metastasis and initiation for over two decades. Urs Utzinger is currently an associate professor and an associate department head in biomedical engineering at the University of Arizona. He holds appointments in Ob/Gyn, optical sciences, electrical and computer engineering, and the BIO5 Institute. His work on fiberoptic probes, diagnostic spectroscopy, and microcopy has led to over 70 publications in peer-reviewed journals. Jennifer Kehlet Barton received her PhD (SPIE fellow) and is a professor of biomedical engineering and interim director of the BIO5 Institute at the University of Arizona. Her research focuses on development of miniature multimodality optical endoscopes for early detection of cancer, including instrumentation design, preclinical experiments, and translation to human pilot clinical studies. |


