|
|
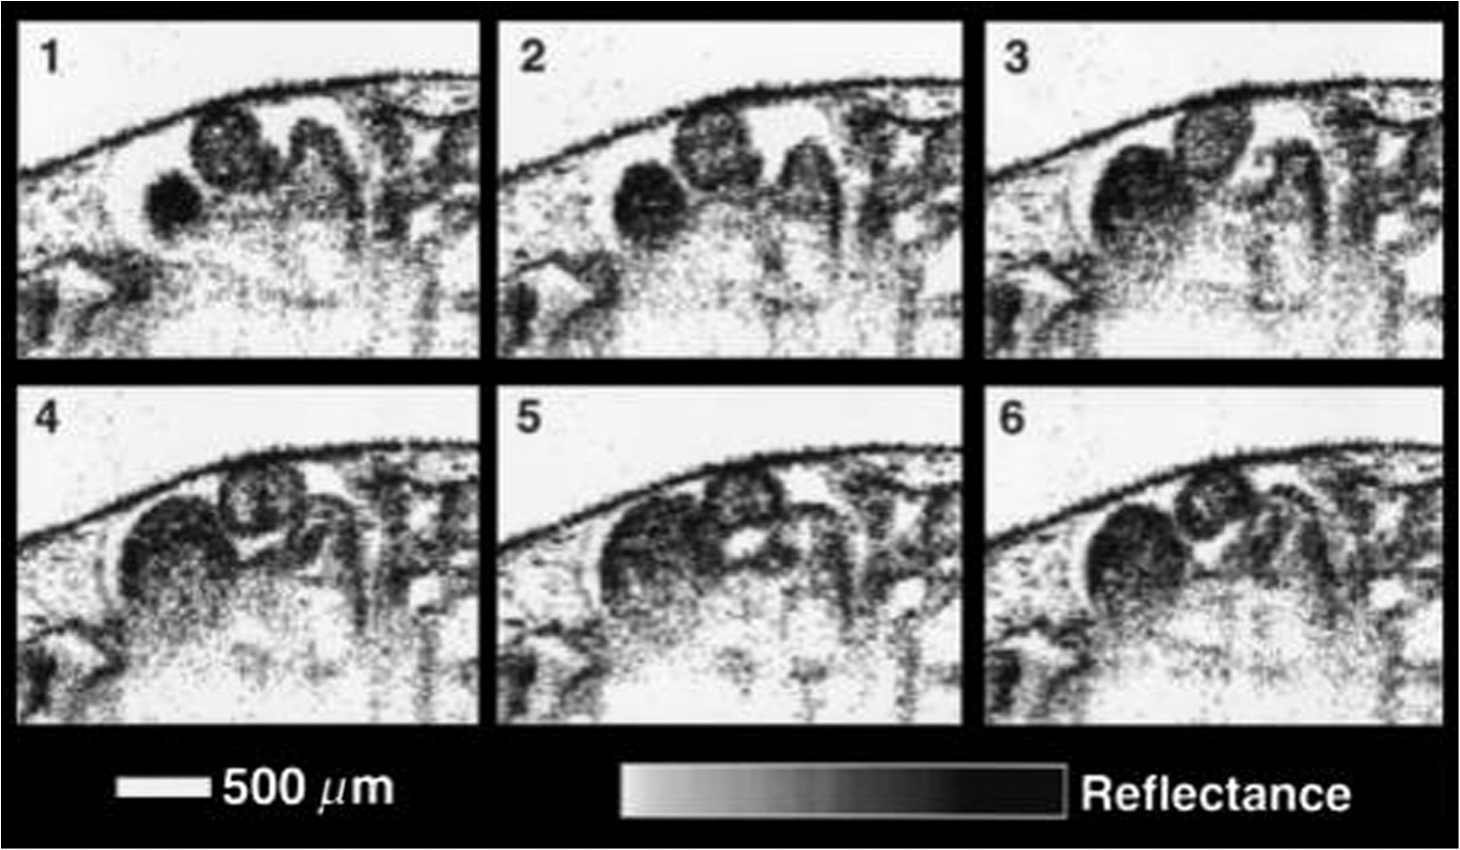
1.IntroductionCongenital anomalies are one of the main causes of infant mortality and also have long-term effects on the quality of life. Present in about 3% of newborns, these defects affect babies every year,1,2 emphasizing the need to study and understand the basic mechanisms involved during embryonic development. A number of animal models have been developed to study embryos at different developmental stages, and advances in genetic engineering have led to the use of a plethora of genetically manipulated animal models that have revealed the genetic basis of various diseases. However, phenotypic information is just as important but not as well documented.3–6 Therefore, a noninvasive, rapid, and high-resolution imaging technique would greatly expand our understanding of embryogenesis and help the development of effective strategies for therapeutic interventions. Histological sectioning was one of the first methods of analyzing embryonic development and has always been the gold standard for phenotypic analysis. In addition to being invasive and time consuming, a large sample size is often required at each developmental stage. Moreover, the process of fixing the embryo can significantly alter its gross morphology and appearance.7,8 Noninvasive imaging techniques would overcome these limitations and could potentially enable live imaging. Several noninvasive imaging techniques, such as confocal microscopy, ultrasound biomicroscopy (UBM), micro-magnetic resonance imaging (MRI), and micro-computed tomography (CT), have been employed to study embryonic development.9 Despite its high resolution, confocal microscopy is limited for embryonic imaging, especially at later stages of development, because of its insufficient imaging depth and requirement of fluorescent markers.10–12 With a penetration depth of few centimeters, UBM is a powerful embryonic imaging technique, but its limited spatial resolution of 30 to makes it unsuitable for imaging fine structures and processes, e.g., embryonic cardiovascular investigations in small animals.13,14 Micro-MRI can also achieve similar high spatial resolutions of 25 to .15–17 However, long acquisition times restrict the use of micro-MRI for live embryonic imaging. Although micro-CT offers a high spatial resolution of 2 to , the use of external contrast agents that may be toxic for embryos and potentially hazardous ionizing radiation makes micro-CT undesirable for imaging live embryos.18–20 Optical projection tomography (OPT) is a relatively new technique for three-dimensional (3-D) imaging of embryos with very high spatial resolutions (1 to ). However, the need for tissue fixation and optical clearing makes it unfeasible for live embryonic imaging.7,8,21 Selective plane illumination microscopy (SPIM) is a technique capable of providing multidimensional, high resolution images of embryos. Although a number of studies have been performed on zebrafish and medaka fish embryos,22,23 live murine embryonic imaging using SPIM is difficult as embedding the embryo in agarose is necessary to prevent motion of the sample. In the past decade, optical coherence tomography (OCT) has been developed and applied for live 3-D imaging of different embryos with high spatial and temporal resolutions. Initially developed for imaging the retina in 1991,24 OCT is now widely used in clinical ophthalmology25 and other fields.26 Due to its ability to provide cross-sectional images of a specimen noninvasively with high spatial and temporal resolutions, OCT is rapidly gaining momentum over other imaging modalities for imaging developing embryos.27–31 This paper summarizes the progress of OCT for embryonic imaging of different animal models and discusses in detail the different techniques that have been used in combination with OCT for improved visualization and quantification of embryonic development, such as cardiac gating and Doppler OCT. This paper then concludes by giving a summary of the recent applications of OCT for studying the embryonic development and briefly discusses future directions of developmental OCT imaging. 2.Optical Coherence TomographyOCT is a low coherence interferometric technique capable of label-free, noninvasive and depth-resolved imaging of tissue with micrometer-scale spatial resolution.24 Often referred to as an optical analog of ultrasound, OCT uses backscattered light from different layers of a sample to obtain depth-resolved information. Due to the high speed of light, the direct time delay cannot be used to detect backscattered photons from the various layers of tissue as with acoustic echoes in ultrasound imaging. Therefore, low-coherence interferometry (LCI) is used to measure the echo delays between the backscattered light coming from different layers. OCT provides micrometer-scale spatial resolution and an imaging depth of a few millimeters in tissue. Since its introduction, OCT has been used in various fields, such as ophthalmology,32,33 dermatology,34 cardiology,35,36 dentistry,37 and cancer imaging.38–40 3.Classifications of Optical Coherence TomographyOCT was first introduced as a time-domain system (TDOCT). TDOCT is an extension of LCI41 and was first used to noninvasively image the retina in 1991.24 In its basic configuration, the light from a broadband source is split and sent to the sample and reference arms in a Michelson-type interferometer. The backscattered light from the sample interferes with light reflected from the reference arm, which has a known time delay. Due to the low coherent nature of the light, only depth information from the sample that matches the optical path distance of the reference arm within the coherence length of the laser source is captured. Thus, a complete axial scan (A-scan or A-line) is obtained by translating the reference mirror. The 3-D imaging is traditionally accomplished by scanning the beam across the sample in the and directions using galvanometer-mounted mirrors. The primary disadvantage of TDOCT is long acquisition times due to the motion of the reference mirror needed to get depth information. Fourier-domain OCT (FDOCT), on the other hand, can obtain a single depth-resolved A-scan without modulating the reference arm by capturing spectral information. FDOCT has several advantages over TDOCT, including a simpler construction, higher speed, and significant signal-to-noise ratio (SNR) improvement.42–44 FDOCT can be further classified into two types: spectral-domain OCT (SDOCT) and swept-source OCT (SSOCT). An SDOCT system is similar to a TDOCT system, where the light from the source is split and sent to the sample and the reference arms, and the backscattered light from the sample and the reflected light from the reference arm interfere. Instead of a photodetector in the case of TDOCT, a spectrometer (most commonly a combination of a diffraction grating, focusing lens, and CCD array) is used to capture the spectrum of the interference pattern. A single A-scan is obtained by performing a Fourier transform on the spectrally encoded interference pattern. Thus, in SDOCT, an entire depth-resolved A-scan is obtained at once, which is unlike TDOCT where depth information is obtained by scanning the reference arm. SSOCT systems utilize a swept-source laser, which sweeps through multiple wavelengths over time. Instead of using a spectrometer to obtain the spectrum of the interference pattern, a SSOCT system uses a balanced photodetector. Because the laser sweeps through the different wavelengths over time, the spectral information is encoded in time, rather than space as in an SDOCT system. Apart from these classifications, a number of extensions to OCT have been developed in the past few years, such as Doppler OCT,45,46 speckle variance OCT (SVOCT),47–49 optical coherence elastography (OCE),50,51 polarization sensitive OCT (PSOCT),52,53 second harmonic OCT,54 angiography OCT,55,56 and so on. In this review, Doppler OCT and SVOCT are specifically discussed because of their wide use in embryonic OCT imaging. 4.Optical Coherence Tomography for EmbryologyOCT has proven to be a very useful technique for embryonic developmental imaging particularly due to noninvasive depth-resolved imaging, rapid acquisition speed, and high spatial resolutions. This section of the review is organized by the different types of OCT systems that have been utilized to image various embryos. 4.1.Time-Domain Optical Coherence TomographyEarly embryonic investigations with OCT involved studying morphological changes in Rana pipiens, Branchydanio rerio, and Xenopus laevis. Initial in vitro studies on R. pipiens and in vivo investigations on B. rerio embryos and eggs, and X. laevis tadpoles were performed using a TDOCT system.57 The system consisted of a 1300 nm superluminescent diode (SLD) source with a bandwidth of 50 nm and an SNR of 109 dB. The axial and transverse resolutions were 16 and , respectively, and the imaging depth was 3 mm. Cross-sectional OCT images of R. pipiens tadpoles were compared to histological sections and showed the potential of OCT as a tool for noninvasive “optical biopsy” of embryos. In addition, sequential imaging of a developing zebrafish was performed over time along the same cross-section, proving that OCT is capable of performing longitudinal in vivo imaging. Moreover, the ability of OCT to distinguish between normal and abnormal morphology was also demonstrated by comparing OCT images of normal and abnormal X. laevis to corresponding histological sections. The irregularly shaped neural tubes and abnormally large orbits consisting of poorly formed cups in the abnormal specimens were successfully visualized by the TDOCT system. The same group studied the developing neural morphology of X. laevis.58 Similar to Ref. 57, brains of both normal and abnormal embryos were imaged at various developmental stages and compared to corresponding histological sections, once again demonstrating the ability of OCT to provide label-free, high-resolution depth-resolved images of embryos noninvasively. These early OCT investigations clearly showed the potential of OCT to perform sequential and longitudinal in vivo imaging, to distinguish normal and abnormal morphology, to perform an optical biopsy,59,60 and to complement histological sectioning. OCT imaging also eliminated the need to sacrifice the embryos for analysis and was less time consuming than standard histological sectioning. Congenital cardiac abnormalities are the most common type of birth defects.61,62 Although there have been a number of imaging techniques capable of monitoring the structure and functions of the adult heart, imaging modalities to study the embryonic cardiovascular system are not as well developed. Confocal imaging techniques have been used to analyze developing embryonic cardiovascular systems, but most of these investigations have been on histological sections.63,64 Moreover, the reliance of confocal imaging on fluorescent probes for contrast further limits its use for assessing embryonic cardiodynamics. High-resolution micro-MRI has been used in the past to study cardiodynamics, but the long acquisition times required for sufficient contrast make it unsuitable for effectively imaging the relatively rapid movements in embryonic cardiovascular systems. UBM is capable of spatial resolutions with an imaging depth of 4 to 5 mm but requires direct contact with the sample for imaging. Furthermore, UBM is not capable of acquiring embryo cardiac motion due to its limited speed, and the frequencies required for sufficient spatial resolution are not suitable for imaging early stage embryonic hearts.65 Although Doppler ultrasound is capable of providing reliable signals in early embryos, imaging the looping heart is still a challenge due to its limited spatial resolution.66,67 Video microscopy is another technique that has been used to study the developing heart, but assumptions made in this technique to calculate the volume of the heart and the heart rate result in inaccurate quantification.68,69 OCT can overcome the limitations of these imaging techniques and is capable of noninvasively investigating the structure and function of in vivo embryonic hearts with high spatial and temporal resolutions. OCT was first used for imaging the developing cardiovascular system of embryonic X. laevis by Boppart et al.70 In this study, 3-D reconstructions of whole, nonbeating hearts were performed on in vitro specimens, and cardiac function was analyzed on in vivo specimens. The TDOCT system utilized for the in vitro samples was similar to that mentioned in Ref. 57. To reduce the acquisition time from tens of seconds to 250 ms for in vivo imaging, a different setup was used, which utilized a 1280-nm solid-state chromium:forsterite mode-locked laser source, piezoelectric modulators, and Faraday rotators. The laser source used in this system configuration provided an optical power of 2 mW incident on the specimen surface and an SNR of 110 dB. The piezoelectric modulators replaced the galvanometer scanner in the reference arm to enable faster axial scanning and image acquisition, and the Faraday rotators compensated for the birefringence caused by fiber stretching. The morphology of the heart was qualitatively assessed from the in vitro images and was quantitatively studied by calculating the volumes of the whole hearts under the assumption that the heart was ellipsoidal in shape. The inability of the first configuration to study cardiodynamics was evident from motion artifacts in the images due to the long acquisition time. Thus, OCT optical cardiograms (M-mode images) were acquired to study cardiodynamics using this setup. The reliability of this method was tested by adding an inotropic agent and repeating the imaging procedure. The faster setup enabled clearer imaging of the morphology of in vivo beating hearts but was still not fast enough to capture multiple B-scans during a cardiac cycle. To overcome this, multiple B-scans were taken over a number of cardiac cycles and were combined to form one cardiac cycle, as shown in Fig. 1. Despite the insufficient speed in both configurations used in this study, it opened avenues for the assessment of other cardiac parameters, such as cardiac output and flow velocity, through the obtained optical measurements. With the introduction of the rapid scanning optical delay (RSOD) line to speed up reference arm modulation in TDOCT systems,71 Rollins et al.72 demonstrated video-rate structural OCT imaging in X. laevis embryos at frame rates up to 32 Hz. Here, a high-power broadband source with a central wavelength of 1310 nm provided 13 mW of optical power. The RSOD utilized a 4 kHz resonant scanner, resulting in a corresponding A-scan speed of 4 kHz. Other cardiodynamic studies utilized avian models. In 2002, Yelbuz et al.73 studied the looping chick heart in excised samples with an OCT system that had an A-scan rate of 4 kHz. The 3-D visualizations revealed significant morphological differences between normal and abnormal specimens. Filas et al.74 also studied the looping embryonic chick heart and quantified the longitudinal strain during development. Using both qualitative and quantitative analysis, they demonstrated that OCT-based strain measurements are ideal for studying the mechanics of cardiac morphogenesis. Manner et al.75 utilized OCT to image cyclic changes in the cross-sectional shape of pulsating heart tubes (Fig. 2) from chick embryos of incubation days 2 and 3 (corresponding to HH-stages 9 to 17). Here, the TDOCT system consisted of an SLD with an output power of 25 mW, central wavelength of 1330 nm, and a bandwidth of 61 nm corresponding to an axial resolution of in air. With a B-scan consisting of 4000 A-scans, the frame-rate was 8 Hz. The system used a Fourier-domain RSOD line consisting of a 4-kHz resonant scanner, which matched the A-scan rate. The results showed that the myocardial tube undergoes concentric narrowing and widening during the cardiac cycle, whereas the endocardial tube undergoes eccentric narrowing and widening. In addition, the OCT images showed elliptical- or spindle-shaped cross-sections at the end of the diastole and a slit-shaped cross-section at the end of the systole. These observations disproved earlier findings that the embryonic heart has a circular cross-section and that all of the embryonic heart tissue layers undergo concentric narrowing and widening during the cardiac cycle.76 The authors also discussed the functional significance of the dynamic eccentric deformation, the significance of the cardiac jelly in the pumping function of the heart tube, and the uneven distribution of the cardiac jelly. Fig. 2Cyclic changes in the cross-sectional shape of the heart tube at different developmental stages. The images on the left are scanning electron micrographs showing frontal views of heart tubes at developmental stages HH-9 to HH-13. Adapted from Ref. 75.  Blood flow plays a critical role in numerous developmental processes, such as stimulating gene expression, altering cellular identity, and influencing the morphology of the developing heart.77–80 Thus, understanding blood flow velocity in developing embryos could reveal the basis of various diseases and defects. A number of methods have been used for this purpose including microparticle velocimetry81,82 and Doppler ultrasound.67,83,84 However, imaging and quantifying blood flow at very early stages of embryonic development with these techniques is difficult due to the lack of sufficient spatial resolution. A novel functional extension of OCT, color Doppler OCT (CDOCT), was introduced in 1997 and is capable of providing velocity mapping with micrometer-scale resolution and morphological imaging.45,46 Yazdanfar et al.85 used a TDOCT system to generate a dynamic reconstruction of the X. laevis tadpole heart using CDOCT. The results showed that CDOCT could provide motion artifact-free reconstruction of cardiac blood flow, but a velocity resolution of less than was required for accurate blood flow quantification with this technique. Since the minimum resolvable velocity is directly proportional to the image acquisition rate,46 slower image acquisition was utilized. However, Boppart et al.70 demonstrated that slower image acquisition causes motion artifacts due to the dynamic structures in living specimens, posing the need for a technique to provide motion artifact-free images with high velocity resolution to accurately quantify blood flow. From the OCT images, Yazdanfar et al.85 extracted frames consisting of A-scans from the same segment of the cardiac cycle [shown in Figs. 3(a) and 3(b)], which is a form of gating (more thoroughly described later in this review). This method of retrospective gated reconstruction reduced motion artifacts during slow image acquisition without affecting the velocity resolution of Doppler OCT. Color Doppler flow processing was performed on the region of interest from these images, and the blood flow direction and volume were quantified. Here, postprocessing visualized blood flow in the heart at frames per second (fps), demonstrating that CDOCT can quantify cardiodynamics. Figure 3(c) shows the expansion of the upper region of the arterial wall during the systole, which has been misinterpreted as flow and is a common problem (clutter) in Doppler ultrasonography. On the other hand, Figure 3(d) shows a magnified reconstruction of an entire beating heart, indicating pulsatile blood flow in the rightmost branch of the vessel and no flow on the left, which might be due to the dependence of Doppler signal on incident angle. Fig. 3(a) Sagittal section of an OCT image through the ventral surface. (b) A-scans extracted from panel (a). (c) Reconstruction of a beating X. laevis heart, played back at 0.75 times real-time. V, ventricle; a, atrium; ta, truncus arteriosus; p, pericardium; bv, branched vessels; d, diaphragm. (d) CDOCT reconstruction of the entire heart. Adapted from Ref. 85.  Extending the use of RSOD lines to Doppler OCT, Westphal et al.86 imaged developing hearts of X. laevis embryos in real-time at 8 fps with a velocity resolution of . Yang et al.87 demonstrated a high-speed Doppler OCT system capable of imaging a wide velocity range utilizing specially developed hardware and software in 2003. The custom software showed different flow profiles like Color Doppler, velocity variance, power-Doppler, and Doppler spectra. The custom Doppler OCT system was capable of real-time imaging up to 32 fps and a wide velocity range of to . This system was then tested by imaging the cardiodynamics of a X. laevis model.88 The results showed a blood flow velocity of and demonstrated the capability of the system to quantify cardiodynamics at a frame rate of 8 kHz and to image velocity gradients at 16 fps. Using the Doppler spectrum mode, the velocity distribution during the cardiac cycle was quantified. 4.1.1.Gated image acquisitionDue to the longer acquisition time of TDOCT systems, it was well known that functional imaging of a beating heart can cause motion artifacts. To minimize these artifacts, gating was introduced. Defined as image acquisition synchronized to the heart cycle, gated cardiac imaging was able to provide sufficient data to produce 3-D images of the beating heart without motion artifacts, thus helping in evaluating and analyzing parameters, such as ejection fraction and stroke volume. Jenkins et al.89 demonstrated the first combination of direct gating and OCT for four-dimensional (4-D) representations of embryonic hearts in 2006, utilizing excised and externally paced chick and murine hearts. The OCT image acquisition was gated to an external stimulus, which was used to pace the heart at 1 Hz. After acquiring images over many cardiac cycles, a single 3-D image was constructed by combining all B-scans from a given phase of the cardiac cycle (explained in Fig. 4). Finally, by generating similar 3-D images at different phases, a 3-D movie was generated and 3-D measurements of the ejection fraction were made. The TDOCT system captured 4000 A-scans/second and B-scans were acquired at intervals. Four frames were captured at each position and at each cardiac cycle, which were averaged to reduce noise. Capturing 16 equally spaced phases in the cardiac cycle resulted in 16 3-D volumes and the full 4-D dataset was recorded in less than 5 min. They demonstrated 4-D representations of embryonic mouse and chick hearts, digital sections of the beating heart, and visualizations of 3-D internal embryonic structures. Since this was a method of direct gating, parameters such as wall thickness, ventricular volume, and ejection fractions were quantified. Fig. 4Gated reconstruction: B-scans were acquired at the same position at different phases of the cardiac cycle before moving to the next position. The 3-D volumes were then reconstructed at each phase. Adapted from Ref. 89.  Extending this technology to live hearts and in vivo studies, the same group demonstrated the first gated 4-D imaging of avian embryonic hearts in vivo using TDOCT in 2007.90 The system acquired 4000 A-scans/s with axial and lateral resolutions of and used a trigger derived from a laser Doppler velocimetry signal, which was used to trigger image acquisition in lieu of an electrocardiogram used in other imaging modalities. This made the process noninvasive and easily repeatable as it did not rely on the placement of electrodes on the heart. The gated 4-D image consisted of A-lines accumulated over multiple heartbeats and represented 3-D volumetric images at eight phases of the cardiac cycle with a total imaging time of . The images demonstrated the transition from systole in phase 1 to diastole in phase 8 (Fig. 5). The volumes at phase 8 and phase 1 were used to measure the ejection fraction. The OCT slices clearly resolved anatomical features, such as the myocardium and endocardium. This technique opened doors for simultaneous assessment of structural and functional development due to the increase in temporal resolution and superior image quality. Fig. 5Eight phases of the beating embryonic quail heart from three different orientations acquired in vivo using gated OCT. Each time series progresses from systole to diastole and each slice is separated by 95 ms. (a) En face 2-D OCT images (sagittal to the body). (b) Eight phases from the normal OCT view (coronal to the body). (c) Transverse view of the heart. Images on the far right of each row show a 3-D surface reconstruction of the heart in phase 8 (diastole). The white plane indicates the position of the corresponding 2-D OCT images in that row. Adapted from Ref. 90.  Phenotyping of transgenic embryonic murine hearts using TDOCT was demonstrated by the same group in 2007.91 Traditional histological sectioning for phenotypic analysis has a number of disadvantages including the lack of dynamic information, large number of samples required, and long processing times. Jenkins et al. used OCT to distinguish and quantify morphological differences between embryonic murine hearts from HEX1M1 mutants and their wild-type counterparts at stages E12.5 (embryonic day 12.5) and E13.5, as shown in Fig. 6. The mutants had increased ventricular volumes and thinner compact myocardia. At E13.5, the mutants showed asymmetric morphology as the left ventricle and atrium showed growth retardation. The results from this work showed the potential of OCT as a noninvasive high-throughput screening tool. Fig. 6(a) The 2-D en face image of HEX1M1 wild-type heart, (b) corresponding mutant heart, (c) 3-D volume from a wild-type heart, and (d) corresponding mutant heart. RA, right atrium; RV, right ventricle; LA, left atrium; LV, left ventricle; IVS, interventricular septum. Adapted from Ref. 91.  4.2.Fourier-Domain Optical Coherence TomographyThe sensitivity and speed of OCT was significantly increased with the introduction of FDOCT,42–44 and facilitated application of OCT for embryonic imaging in a number of animal models ranging from worms to zebrafish to mice. 4.2.1.Spectral-domain optical coherence tomographyKagemann et al.92 utilized SDOCT to perform the first in vivo 3-D imaging of zebrafish morphology in 2008. Utilizing the noninvasive nature of OCT, they developed an imaging protocol without the use of anesthetizing agents to avoid sedative side-effects on the embryos. Embryos were imaged in three different preparations. In preparation 1, the embryos were embedded in 1% low melting agarose and immersed in E3 egg water while live OCT imaging was performed. In preparation 2, the same imaging procedure was followed at 72-h postfertilization (hpf). The embryos were then returned to E3 egg water and re-embedded in agarose at 120 hpf. Preparation 3 was similar to preparation 1 but involved nagie oko (m520 allele) mutant embryos. The SDOCT system used in this study had an axial resolution of in air, and the embryos were imaged at different transverse spatial dimensions depending on the stage of the embryo. At a frame rate of 47 Hz, 180 sequential frames were obtained, each consisting of 501 A-scans acquired at 24 kHz. The unused embryos were fixed for histological processing after OCT imaging. After image processing and averaging to reduce noise, quantitative tissue measurements and statistical analyses were performed. A number of internal structures of the embryo were visible from the SDOCT images (Fig. 7) and were correlated with published data on anatomic sections for identification. In addition to noninvasively imaging zebrafish organogenesis of the eye, ear, and spine, this study also visualized and assessed the beating heart at different stages of development. Quantitative measurements of the heart and retinal thicknesses were shown to significantly increase with age, and there was good correspondence between the OCT images and histological sections. This investigation clearly showed the ability of SDOCT to perform longitudinal studies and distinguish developmental defects in mutant zebrafish embryos, demonstrating the potential of OCT to detect developmental changes at the tissue microstructural level. Fig. 7Visualization of developing internal morphology of zebrafish embryos at different developmental stages. Adapted from Ref. 92.  More recently, SDOCT was used to image spinal development and deformities in zebrafish.93 Both wild-type and Chd794 knockdown zebrafish embryos from 5 to 29 days postfertilization (dpf) were imaged using an SDOCT system with a central wavelength of 930 nm, bandwidth of 100 nm, and axial and lateral resolutions of 7 and , respectively. OCT images from wild-type embryos were compared with histological sections, and the results clearly showed that OCT was capable of differentiating the spine and the surrounding muscles. Furthermore, individual spinal cells were resolved, revealing the cellular-level imaging capabilities of OCT. The highly deformed notochord and many of the malformed organs were clearly visible in the OCT images of the Chd7 knockdown zebrafish embryos. OCT was able to monitor the spinal development of zebrafish embryos noninvasively, which helped overcome the difficulty of obtaining a suitable section of the curved spine during histological sectioning. However, the limited imaging depth of OCT inhibited full body imaging of embryos older than 30 dpf. Moreover, OCT was able to identify skeletal structures that had not yet been mineralized and could not be identified with calcein staining. However, OCT could not distinguish between mature and immature bones, which is possible with calcein staining, as depicted in Fig. 8. Additionally, OCT was used to image developmental defects in zebrafish embryos due to ethanol exposure.95 Similar to bright-field microscopy images, abnormal features, such as edema around the developing heart and an enlarged yolk sac, were observed in the OCT images of ethanol-exposed embryos when compared to unexposed embryos. Other organs, such as the eye and notochord, were also imaged to visualize the effects of ethanol on embryonic development. Fig. 8(a) Sagittal view of an OCT 3-D reconstruction of a 21 dpf wild type zebrafish in vivo. (b) 2-D cross-section where the spine is indicated by the white arrow. (c) Calcein stained image of the same specimen, taken an hour later. Scale bar is 1 mm. Adapted from Ref. 93.  In one of the first studies to assess the Drosophila melanogaster heart using SDOCT, Bradu et al.96 used a combination of OCT and laser scanning fluorescence microscopy (LSFM). Due to the optical transparency of the heart and relative opacity of the insect cuticle, live in vivo imaging of the heart was difficult. SDOCT provided axial profiles, but LSFM was utilized to obtain en-face images. Thus, the hearts were not imaged consecutively with both imaging modalities, but rather sequentially. Because the SDOCT system provided depth-resolved information at once, the LSFM system was focused such that fluorescence emission from a broad depth was collected. The complementary information from both systems provided more sensitive and specific information for localizing and monitoring protein function and tissue structure than either of the two systems alone. Parameters such as the shape of an action potential, activation sequence, and conduction velocity play an important role in normal cardiac development. Optical mapping (OM) is a technique, which collects information about a 3-D structure from a two-dimensional (2-D) projection map. Since the information is collected from a 2-D map, the curvature of the 3-D structure is often ignored, leading to errors in the conduction velocity map. Moreover, the 3-D structure is critical for cardiac development, especially in early stages, and can vary between embryos and between developmental stages. OCT can accurately measure embryo morphology in 3-D at early developmental stages. Recently, Ma et al.97 demonstrated simultaneous OCT and OM imaging and evaluated both the 3-D structure as well as the conduction velocity. Incorporating the 3-D structure as imaged by OCT increased the accuracy of the conduction map. Consequently, conduction velocities in embryonic quail hearts were corrected to account for the 3-D morphology as obtained from OCT images. This 3-D correction reduced errors introduced from traditional 2-D projection map-based conduction velocities. The results showed the benefit of using OCT to integrate the true 3-D morphology when investigating cardiac electrophysiology. Lopez et al.98 used 4-D SDOCT to differentiate control and Wdr19 mutants. They used a SDOCT system employing a Ti:sapphire laser source with a central wavelength of 808 nm, bandwidth of 100 nm, and an A-line acquisition speed of 250 kHz. The system had an axial resolution of and transverse resolution of . A smaller looping angle was seen in the Wdr19 mutants when compared to the control mice, thus indicating that 4-D OCT imaging can be a useful tool for cardiovascular phenotyping of early stage embryos. In addition to label-free imaging, exogenous contrast agents can be used to obtain structural and functional information of embryos via microinjection. A real-time depth-resolved high-resolution imaging technique could enable more accurate microinjection into different embryonic organs and compartments. Most recently, Syed et al. demonstrated the first use of OCT for image-guided microinjection. The SDOCT system utilized was the same as in Ref. 98 but with an A-scan rate of 50 kHz. They visualized microinjection of gold-silica nanoshells into embryo yolk sac vasculature to study blood flow dynamics.99 In addition, quantitative measurements were taken and showed the capability of OCT to measure injection volumes. Davis et al.100 employed Doppler OCT with an SDOCT system to image developing chicken hearts at very early embryonic stages where the heart fuses into a tube and begins the looping process. Utilizing a previously developed technique called spectral Doppler velocimetry (SDV),101 hemodynamic measurements were made as the heart develops from stages HH 11 to 14. SDV is considered an SDOCT analog to pulsed Doppler ultrasound imaging and is capable of producing depth-resolved hemodynamic measurements. This technique calculates the angle of flow from a volume, which increases the accuracy of blood flow velocity measurements. Davis et al. also solved the problem of phase wrapping that occurs if the Doppler phase shift is greater than by implementing the cellular-automata method described in Ref. 102, thus greatly increasing the range of Doppler blood flow velocity measurements. Similarly, a number of other groups have studied the effect of blood flow on morphogenesis of the heart using SDOCT systems and have investigated various techniques to calculate the absolute blood flow velocity. In 2010, Ma et al.103 quantified the absolute blood flow velocity distributions in the heart of a chicken embryo by calculating the slope of the centerline at the outflow tract (OFT) of the heart at different positions and the Doppler angle needed for accurate measurements. This proved to be a faster and more reliable method to calculate velocities at the inlet and outlet of the OFT than earlier techniques. A number of forces act on the walls of the heart, such as the wall shear stress and blood pressure. Studies making use of modeling, instead of the Doppler signal, have also been performed for analyzing these forces.104–106 Zhenhe et al.107 utilized a high-speed SDOCT system to quantify blood flow velocity in embryonic chicken heart in vivo. The SDOCT system was comprised of an ultrahigh speed line-scan CCD camera, diffraction grating, and a long focal length lens. This system had a maximum A-scan rate of 92 kHz resulting in a measureable velocity range up to . Recently, Midgett et al.108 evaluated blood flow in the OFT of a chick embryo to characterize hemodynamic changes during early stages of cardiac development. Several parameters were measured such as OFT blood flow velocity with respect to lumen diameter (from Doppler OCT images), peak velocity, peak flow rate, stroke volume, wall shear rate, cardiac cycle length, and time of flow. These measurements were supported by computational fluid dynamic simulations, thus providing a greater understanding of blood flow during cardiac looping. Following the work on strain measurements in embryonic chick hearts, where the cardiac wall motion and blood flow were quantified with OCT in both normal and abnormal hemodynamic condition,109–111 Ma et al.112 proposed a method to measure the wall strain in the OFT of chick hearts at early developmental stages, in vivo. The strain was calculated from a segmented myocardial wall from a cross-section of a 4-D dataset. Since hemodynamic forces play an important role during cardiac development, understanding the mechanical properties of cardiac tissues at different developmental stages is crucial. These studies have demonstrated the potential of using OCT to study the biomechanical properties of the embryonic hearts by quantitative analysis of the wall strain. 4.2.2.Swept-source optical coherence tomogrpahyLarin et al.113 demonstrated the overall ability of SSOCT to perform 3-D structural imaging of live embryos at different stages. Structural and functional assessments of embryos from stage E7.5 to E10.5 were performed. Figure 9 shows a snapshot of a 3-D structural image of an E10.5 embryo. Furthermore, nongated 4-D reconstructions of live embryos were acquired and successfully captured the embryonic heartbeat. Figures 9(b) and 9(c) show snapshots from the first OCT images of a beating mammalian heart in 4-D (3D+time). Fig. 9(a) Snapshot from a 3-D structural image of a mouse embryo at E 10.5. (b) Snapshot from a gallery of denoised and synchronized time lapses acquired at different positions and used for 4-D reconstruction of the heartbeat. (c) Snapshot from a 4-D reconstruction. Adapted from Ref. 113.  In 2011, our group demonstrated the first in utero OCT imaging of live mouse embryos starting from E12.5 until the end of embryogenesis.114 The embryos were imaged with a commercial SSOCT system that consisted of a “broadband” source with an A-scan rate of 16 kHz, output power of 12 mW, central wavelength of 1325 nm, and bandwidth of 100 nm. The total acquisition time for a 3-D dataset was . The system had lateral and axial resolutions of . This study focused on which embryonic structures could be imaged with OCT through the uterine wall. The embryos were kept alive by maintaining the body temperature of the anesthetized mother. However, motion artifacts caused by maternal respiration reduced the image quality and demonstrated the need for additional techniques for motion compensation. Figure 10 shows 3-D reconstructions of mouse embryos at E13.5, E15.5, and E17.5, respectively. The images clearly show the morphological and size differences between the three stages. Fine details, such as craniofacial details, are clearly visible in stages E15.5 and E17.5. Fig. 103-D reconstructions of mouse embryos in utero at different developmental stages: 1, head; 2, forelimb; 3, hind limb; 4, pinna of the ear; 5, eye; 6, yolk sac; 7, uterine wall; 8, follicles of vibrissae. (a) 13.5 dpc, (b) 15.5 dpc, and (c) 17.5 dpc. Scale bars correspond to 1 mm. Adapted from Ref. 114.  Limb development in embryos at various developmental stages as imaged using in utero OCT is shown in Fig. 11. The OCT images correlated well with histology and electron micrographs of embryos at corresponding embryonic stages. In addition to imaging the gross morphology of the embryos, the ability of OCT to provide cross-sectional images was also demonstrated by imaging the forelimb. The digits and half of the forelimb could be visualized, suggesting that OCT is capable of providing detailed information for characterizing internal and external structures of the limbs. Next, in utero brain imaging was performed, and the cerebral cortex and ventricles were clearly visualized until E16.5. After this stage, only the cortex was still visible. This study provided an effective protocol to perform in utero longitudinal imaging of mouse embryos. Fig. 113-D reconstructions of the embryonic forelimb at different stages of development of a mouse embryo. Insets show scanning electron micrographs of the embryonic forelimb at the corresponding embryonic stages. 1, Cartilage primordium of distal phalangeal bone; 2, cartilage primordia of phalangeal bones; 3, cartilage primordia of metacarpal bones; 4, follicles of vibrissae. Scale bars correspond to (a–c) , (d–g) 1 mm. Adapted from Ref. 114.  In addition to gross anatomical investigations, a number of examinations of ocular developments in murine models were performed using SSOCT. Making use of the in utero imaging protocol developed in Ref. 114, Larina et al.115 studied ocular structures of mouse embryos at different stages of embryogenesis and also showed the ability of OCT to differentiate normal and mutant mouse models based on differences in their ocular structures. The mutant model (Pax6-SV40 T-antigen transgenic mouse line) spontaneously forms lens and retinal tumors during embryonic development. Longitudinal imaging was performed on wild-type and mutant mice at E13.5, E15.5, and E17.5. OCT was also able to capture the 3-D structure of the hyaloid vasculature, which is a capillary network of the embryonic eye, proving that OCT can assess ocular vascular remodeling during embryonic development. Moreover, OCT successfully distinguished the wild-type embryos from the mutant embryos. As an extension to this study, our group recently quantified embryonic eye development at different developmental stages of a murine model.116 An increase in size and morphological changes were clearly visible (Fig. 12), and the results correlated well with the values obtained using UBM. However, the OCT images provided significantly higher spatial resolution than UBM, enabling more accurate quantification of eye volumes. Fig. 122-D SSOCT images of the mouse eye in utero at different developmental stages: (a) E 13.5, (b) E 15.5, and (c) E 17.5. Adapted from Ref. 116.  The brain of a developing embryo is highly susceptible to changes caused by a number of factors, both genetic and environmental. A high-resolution noninvasive imaging technique would provide valuable information to aid in understanding the causes and outcomes of various brain developmental disorders. Thus, OCT is gaining popularity for embryonic brain imaging. Our group imaged the developing brain structure in utero using an SSOCT system while developing a protocol for high-resolution in utero imaging of live mouse embryos.114 Sudheendran et al.117 utilized this protocol to investigate the effects of prenatal alcohol exposure on the developing brain of mouse embryos using OCT and compared the results with ultrasound imaging. The results of this pilot study showed that the volume of the lateral ventricles of the ethanol-exposed fetuses was significantly larger than those from the control group. The volume of the brain obtained from SSOCT was verified by measuring the volume from the ultrasound images. However, due to inferior spatial resolution and contrast in the ultrasound images, the ventricular margins were not clearly defined, unlike in the OCT images. This resulted in a twofold decrease in variance of the ventricular volumes imaged by OCT, as compared to ultrasound. Figure 13 shows OCT, ultrasound, and H&E stained images of the control and ethanol-exposed fetal brains. It is readily apparent that the ventricles of the embryos exposed to ethanol are dilated in comparison to the controls. Fig. 13Effect of ethanol on mouse fetal brain development at E14.5. (a and b) OCT images in the transverse plane, (c and d) ultrasound images in the coronal plane, and (e and f) H&E images in sagittal plane of fetal brains from both (a,c,e) control and (b,d,f) ethanol-treated embryos. The ethanol-induced increase in ventricular dilation can be observed with all the imaging techniques, and in all three planes of orientation. US, ultrasound; LV, lateral ventricles. Scale bars are . Adapted from Ref. 117.  Doppler SSOCT has also been used widely to study the murine embryonic cardiovascular system. In vivo structural imaging and hemodynamic measurements were performed in early stage mouse embryos by Larina et al.118 in 2008. This was the first study that evaluated the normal blood flow in externally cultured mouse embryos using a Doppler SSOCT system. Spatial and temporal blood flow velocity profiles were acquired from the dorsal aorta and yolk sac vessel. Figures 14(a) and 14(b) show structural and Doppler images of the yolk sac and the dorsal aorta, respectively, from a E9.5 embryo. As seen from Fig. 14(b), strong Doppler signals were detected from the selected regions of the yolk sac vessel and dorsal aorta. Here, blue and red depict the direction of blood flow. A peak blood flow velocity of and a heart rate of was observed. These results correlated well with previously obtained values using confocal microscopy,119 thus showing the ability of Doppler SSOCT to perform accurate blood flow measurements. Due to the greater imaging depth of OCT as compared to confocal microcopy, measurement of flow velocities and heart rates from the dorsal aorta were possible. Fig. 14SSOCT Doppler measurements of blood flow in live embryo culture. (a) Structural image of a E9.5 embryo showing fragments of a yolk sac and an embryonic trunk. (b) Corresponding color coded Doppler image showing strong signals produced by blood flow in the yolk sac and dorsal aorta. Adapted from Ref. 118. 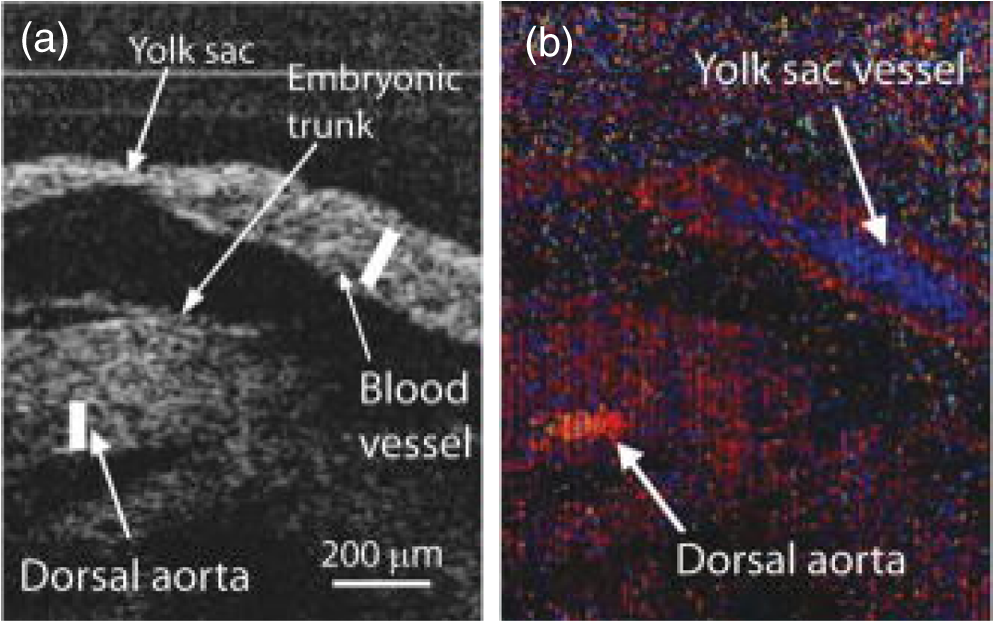 In a similar study, Larina et al.120 made hemodynamic measurements of individual blood cells in murine embryos at E8.5. At this stage, the heart begins to beat and most blood cells are found in the blood islands with very few circulating erythroblasts. Hence, this study was described as an OCT signal detection technique from single circulating blood cells. Hemodynamic measurements of individual blood cells were made using Doppler OCT. Color-coded Doppler velocity maps from the dorsal aorta at different phases of the cardiac cycle were also acquired. Blood flow dynamics clearly indicated pulsatile flow (Fig. 15). The heart rate and flow velocity obtained from this study correlated well with other published data, supporting the physiological relevance of the data and ability of Doppler SSOCT to obtain accurate hemodynamic measurements. Assessing individual time frames, measuring the Doppler velocity shift from each visible blood cell, and distance of the cell from the vessel wall suggested the presence of laminar flow. These results showed the ability of SSOCT to provide spatially resolved hemodynamic measurements at early stages of embryonic development without the need of any additional image processing techniques. Fig. 15Doppler velocity signals from blood cells on E8.5. (a) Structural and corresponding color-coded Doppler velocity images acquired at different phases of the heartbeat cycle. Green corresponds to zero velocity. Individual blood cells are distinguishable in the dorsal aorta. (b) Magnified view of the same area showing Doppler signal from single cells as well as a small group of cells. Adapted from Ref. 120.  Doppler OCT has mostly been used for imaging the vasculature of live samples. However, Doppler OCT is highly insensitive to blood flowing in the transverse direction to the probe beam. Hence, blood flow in vessels orthogonal to the probe beam cannot be easily quantified with Doppler OCT. In addition, the phase stability of the system determines the dynamic range of the Doppler OCT imaging. A number of systems with superior phase stabilities have been implemented to combat this problem. Although phase contrast methods have also been applied,121 they are similarly affected by the phase sensitivity of the OCT system. Time varying speckle analysis has been proposed as an alternative technique to overcome this limitation.47,48,122 Mariampillai et al.48 utilized speckle analysis to reconstruct the vasculature in the skin of nude mice. Sudheendran et al.123 utilized SSOCT in conjunction with speckle variance OCT (SVOCT) to obtain 3-D reconstructions of the vasculature in live embryos in culture at E8.5 and E9.5. The SVOCT results were compared with Doppler OCT, and the results demonstrated that both methods perform equally well when the blood flow is in the axial direction, but SVOCT performs better when the vasculature is almost perpendicular to the OCT probe beam. Most recently, Kulkarni et al.124 demonstrated that sparsity-integrated speckle anomaly detection algorithms further increase the quality of 3-D reconstructions of the network of blood vessels in developing embryos by mitigating problems associated with the presence of vessel structures at multiple spatial scales, thin blood vessels with weak flow, and artifacts resulting from bulk tissue motion. The majority of embryonic investigations have utilized avian, fish, or mouse models due to the wide availability of transgenic models and ease of development of novel mutants. Rats have not been used as widely as mice for embryonic studies due to a lack of transgenic libraries. After the derivation of rat embryonic stem cells,125,126 the use of rats as a mammalian model to study diseases gained momentum. Larina et al.127 showed the first live imaging of rat embryos in 2009, where the beating heart was captured using SSOCT and blood flow velocity was quantified with Doppler OCT. Rat embryos of stages E10.5 and E11.5 were studied, which correspond to stages E8.5 and E9.5 in mouse embryos. Compared to mouse embryos, the rat embryos exhibited stronger and more stable heartbeats. The 3-D reconstructions of the embryo with the yolk sac were depicted and seemed to have a higher resolution due to the larger size of the internal structures as compared to mouse embryos. 4.2.3.Nongated image acquisitionIn gated acquisition, reconstruction errors are introduced because of the strong dependence of time stamps obtained from the trigger signals, which are often weak in live embryonic imaging. Nongated image acquisition eliminates this problem by removing the need for any postacquisition synchronization. One of the first studies of embryonic hearts using nongated OCT was done by Yazdanfar et al.85 utilized nongated acquisition with retrospective gating OCT to study the blood flow throughout a beating X. laevis heart and the surrounding vasculature. Mariampillai et al.128 also used retrospective gating on X. laevis embryo hearts by utilizing an optical Doppler cardiogram to obtain signals from the heart instead of using an ECG and demonstrated 4-D imaging at 45 fps. A TDOCT system was used to obtain the Doppler optical cardiogram, whereas an SSOCT system was used to image the embryos. The Doppler data were then used to synchronize the B-mode image sequences. Since the image sequences are out of phase in nongated image acquisition, Liu et al.129 adjusted the phase lags by acquiring a longitudinal image covering the entire region of interest in addition to the series of transverse images. The transverse or parallel slices were first aligned with respect to each other and then aligned with respect to the longitudinal slice, thus synchronizing the transverse images. In the above case, the longitudinal slice should be chosen carefully such that it does not contain the beating heart. To avoid such situations and also to overcome the limitation of error accumulation, Larina et al.130 introduced a method called sequential turning acquisition and reconstruction (STAR) for imaging periodically moving structures. As seen in Fig. 16(a), the STAR approach acquired 2-D+T images along planes which share a common axis, which was unlike other nongated imaging approaches that acquired consecutive images in parallel imaging planes. This common central 1-D+T line from all images served as a temporal gating signal for postacquisition synchronization. After synchronization, the images were represented in 3D+T by transforming them into orthogonal coordinates [Fig. 16(e)]. Fig. 16Sequential acquisition and reconstruction (STAR) method. (a) Image sequences acquired along radial planes (sharing a central axis). (b) Intensity of the central lines of the slice sequences versus time (kymograph) acquired sequentially at different orientations . (c) Synchronization of the sequences by time warping the kymographs. (d) Synchronized radial sequences covering one period resulting from application of the warping function. (e) Visualization of the synchronized sequences as cutting planes or (f) interpolated into a Cartesian grid for volume rendering. Adapted from Ref. 130.  During dynamic acquisition, there is a tradeoff between acquisition time and spatial resolution. When the acquisition time is too long, the motion of the sample blurs the image. If the frame rate is increased to reduce this blurring, the SNR of the image can decrease as fewer backscattered photons are captured. When imaging cardiovascular systems, a frame rate of 100 Hz or more is required due to the velocity of the moving structures to be imaged. Building up on techniques of tiled imaging followed by mosaic reconstruction, Yoo et al.131 proposed a method to improve the field of view and resolution of dynamic 2-D OCT by combining tiled image sequences of cyclically moving structures in the mammalian embryonic heart. Live rat embryos were imaged with an OCT system similar to the one used in Ref. 118. The image acquisition protocol and reconstruction algorithm imaged cardiovascular structures with cyclical motion. Dynamic mosaicing overcame limitations of frame rate, resolution, and field of view during fast cardiac imaging. Figure 17 shows the principle of tiled acquisition and mosaicing used in this study. Fig. 17Tiled acquisition and automatic mosaicing procedure for dynamic images. (a) Sequentially acquired overlapping cardiac image series. (b) Static image acquired by collapsing each sequence into one. (c) Spatially aligned static images. (d) Spatially transformed and zero padded image sequences. (e) Temporally synchronized sequences. (f) Blended image sequences. Adapted from Ref. 131.  Bhat et al.132 proposed another method of nongated acquisition, where two sets of parallel 2D+T image sequences were acquired orthogonal to each other in 2013. A high-resolution 4-D (3D+T) volume was reconstructed accurately by making use of the similarities at the points of intersection of the two slices. 4.3.Fourier Domain Mode-Locked Lasers for Imaging Developing Embryos: Ultrahigh-Speed Optical Coherence TomographyThe use of FDML lasers in SSOCT systems has significantly increased the speed of signal acquisition. Since all wavelengths that the bandpass filter is tuned to are simultaneously active, there is no need to build up lasing action for each sweep. This has led to narrow linewidths, broad sweep ranges, and higher phase stabilities.133 Buffered FDML lasers have further increased the speed of OCT systems by creating copies of the primary sweep and utilizing unidirectional wavelength sweeps.134 The use of buffered FDML lasers to image developing embryos began in 2007 when Jenkins et al.135 demonstrated in vivo 4-D imaging of a quail heart without gating for the first time at 100,000 A-scans per second. Unlike previous methods, this A-scan rate was fast enough to sufficiently monitor dynamic processes during embryonic development. The OCT system utilized a buffered FDML laser source with a tuning range of 117 nm and a central wavelength of 1287 nm. The OCT system had an axial resolution of and an output power of 7.3 mW. The total imaging time of the embryos was no longer than 2 min. Two imaging protocols were used. First, 4-D (3D+time) datasets were collected at a rate of 10 volumes per second, which corresponded to approximately four to six volumes per cardiac cycle. The second imaging protocol monitored the rapid dynamic events during a systole. The 3-D (2D+time) datasets were acquired at a rate of 195 fps, corresponding to an acquisition time of 5.12 ms. Longitudinal imaging was performed by acquiring 2D+time data of the same embryo at 3-h intervals to visualize the growth and changes of the embryonic quail heart at different developmental stages. Sum voxel projection and intensity gradient filters were used to improve visualization, which aided in rapid reconstruction of the hearts in three and four dimensions with high spatial resolution. Figures 18(a) and 18(b) are snapshots of videos using sum voxel projection and gradient filters, respectively, for a 3D+time dataset of a stage 14 quail heart. These two approaches improved throughput and provided rapid preliminary phenotyping of embryonic structures. The sum voxel projection helped with visualization of the outer and inner lumen of the heart tube during filling and ejection of blood, whereas the gradient filters aided with assessment of the interaction of the heart with the surrounding tissue. Figure 19 shows 4-D dataset of two embryos (same region) of different developmental stages. Figures 19(a)–19(c) demonstrate developmental stages 10, 11, and 12 whereas Figs. 19(d)–19(f) depict stages 13, 14, and 15. This work showed the potential of ultrahigh-speed OCT to quantify mechanical-anatomical relationships in the embryonic heart. Compared to slower systems, this system was able to resolve systolic dynamics, thus moving a step closer to understanding the mechanisms that cause the heart looping process. Gated OCT imaging using FDML lasers was proposed to increase the temporal resolution of 3D+time data, similar to the 2D+time data. Soon after, Gargesha et al.136 demonstrated a retrospective gating technique to increase the volumetric imaging rate of SSOCT systems utilizing FDML lasers. Based on previous work by Liebling et al.,137 Gargesha et al. developed a more efficient and robust gating algorithm. Unlike previous gating techniques where eight volumes were acquired in a single cardiac cycle with traditional SSOCT systems and 10 volumes were acquired per second with FDML-based SSOCT systems, this method acquired volumes per heartbeat (). By simplifying the experimental setup, this method could also be extrapolated for use on any structure that undergoes periodic motion (e.g., respiratory systems). A robust validation algorithm was tested, which helped in quantitative evaluation of the image processing algorithm, showing that reconstruction errors were minimal. Fig. 18(a) Sum voxel projection of a beating embryonic quail heart at stage 14. (Video 1, MPEG, 2.36 MB) [URL: http://dx.doi.org/10.1117/1.JBO.21.5.050902.1]. (b) Ventral view of a stage 14 beating embryonic quail heart with a 3-D Sobel mask applied to the data volume corresponding to each phase of the cardiac cycle (Video 2, MPEG, 544 KB) [URL: http://dx.doi.org/10.1117/1.JBO.21.5.050902.2]. Adapted from Ref. 135.  Fig. 19Time series of coronal sections at the same location of two quail hearts. (a–c) Stage 10 to 12 from the same quail embryo (Video 3, MPEG, 2.29 MB) [URL: http://dx.doi.org/10.1117/1.JBO.21.5.050902.3]. (d–f) Stage 13 to 15 from a different quail embryo, same orientation and location (Video 4, MPEG, 2.42 MB) [URL: http://dx.doi.org/10.1117/1.JBO.21.5.050902.4]. Adapted from Ref. 135. 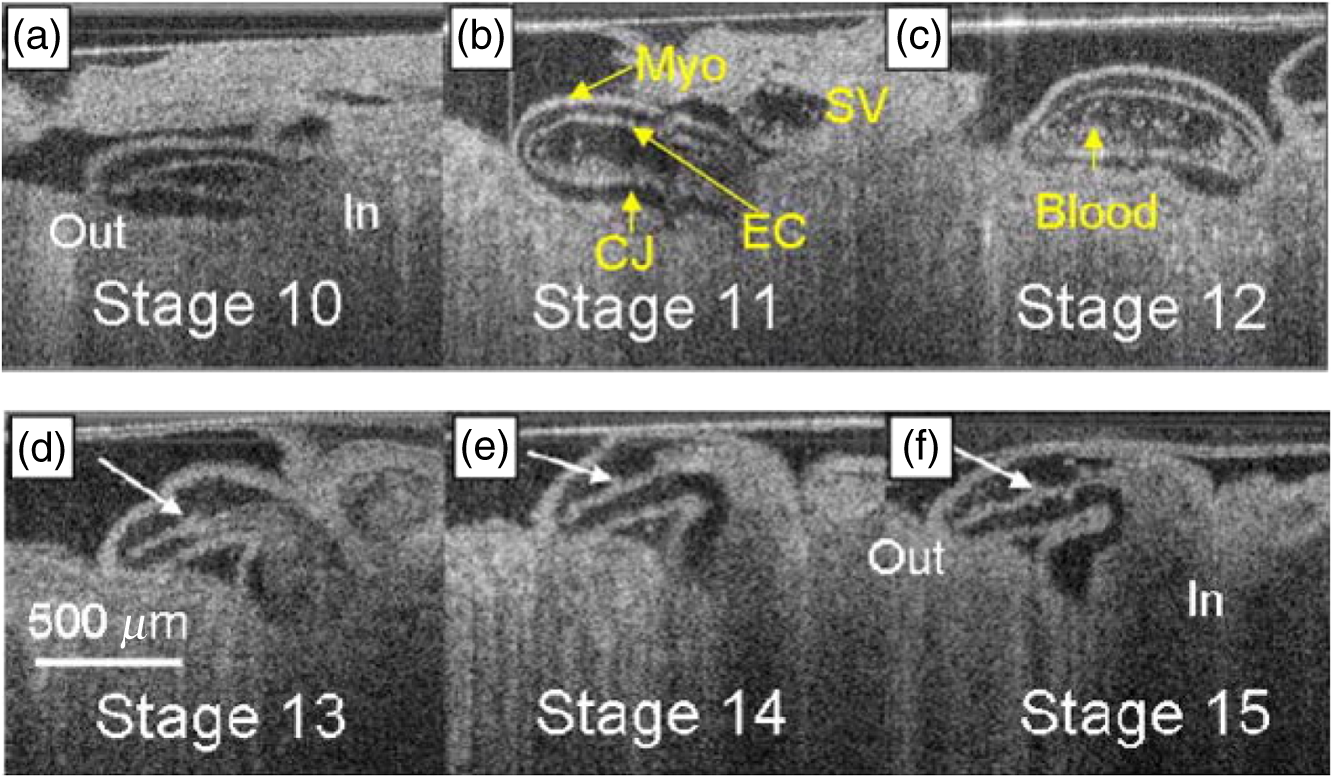 Following the introduction of the 4-D gating algorithm, hemodynamic measurements of an avian heart were performed by 4-D imaging of cardiac blood flow.138 Previously, Davis et al. utilized pulsed Doppler measurements using M-mode imaging of the outflow tract of early chicken embryos to obtain indirect measurements of the flow and shear rate in the vitelline vessels of a chicken embryo.101 The disadvantages of M-mode imaging were overcome by 4-D imaging and its ability to analyze multiple pulsed Doppler measurements. Moreover, 4-D imaging can provide Doppler measurements from the middle of the heart tube, thus providing of the capability for direct measurement of parameters like flow and shear rate. This study used 4-D Doppler OCT data to make hemodynamic measurements in the embryonic avian heart. Pulsed Doppler measurements were obtained at multiple locations of interest throughout the heart tube. The advantages of using 4-D Doppler OCT were clearly evident by the measurement of stroke volume and cardiac output without obtaining the absolute velocity since blood flow measurements were made from the en face images. Moreover, planes orthogonal to the blood flow were selected for the determining the shear stress by utilizing 4-D Doppler OCT. There have been a few other studies using FDML-based OCT systems to study cardiodynamics and related functions. An FDML-based SSOCT system and an optical coherence microscopy (OCM) system were utilized to understand the relationship between mechanotransduction and trabeculation of the embryonic avian heart.139 This study showed the potential of imaging developing structures that accommodate the increase in blood flow and visualizing mechanotransducing networks efficiently organizing themselves to aid the process of trabeculation. Gu et al.140 studied the heart defects that arise due to hypoxia utilizing Doppler measurements made with an FDML-based OCT system. They showed that in the first 5 min, the embryos exhibited decreased systole and increased diastole duration. After the initial 5 min, slower heart rates, arrhythmic events, and an increase in retrograde blood flow were observed. 4.3.1.Optical pacingOne drawback with studying cardiodynamics is the weakening of the heartbeat of the embryo during in vivo experiments. Optical pacing (OP) is a method that uses pulsed laser light to control the heart rate in embryos. Jenkins et al.141 demonstrated the first use of pulsed infrared light to optically pace intact quail embryos hearts. This technique was later adapted by Peterson et al.142 in 2012 to alter the heart rates of intact quail embryos to measure the resultant shear forces using OCT. Their results showed that OCT is an effective technique for evaluating OP protocols to study the effects of altered cardiodynamics. More recently, Alex et al.143 captured and monitored a drosophila heart at different stages of its lifecycle (from larva to adult stages) by optogenetic pacing of the heart using an OCM system. 5.Recent Advances and Future DirectionsAfter its introduction as a basic time-domain system, OCT has undergone tremendous advances through the years. OCT has expanded in principle, efficiency, and speed, and its range of applications has correspondingly risen. This section briefly overviews recent advances in embryonic imaging with OCT. 5.1.Use of an Ultrafast Swept-Source Optical Coherence Tomogrpahy System to Image Developing EmbryosAs already discussed, OCT has been used in different ways to study the cardiovascular system of a developing embryo. Due to the fast heartbeats and rapid development of the cardiovascular system at earlier embryonic developmental stages, capturing the dynamics and growth of the heart has remained a challenge. To overcome this disadvantage, OCT has been combined with different techniques such as gating, and a number of synchronization methods have been demonstrated.129,130,132,144 Although these methods have helped understand the developing cardiovascular system, some of these methods involve the integration of images acquired at different cardiac cycles into one heartbeat. This greatly depends on the periodicity of the heartbeat, and hence, is prone to errors when the heartbeat is not perfectly regular. With the development of OCT systems utilizing ultrafast FDML laser sources, direct acquisition of 3-D volumes is now possible. However, due to limited resolution in the transverse or temporal dimension due to the relatively slow A-line acquisition rate (up to 100 kHz), these methods were not suitable for studying the embryonic cardiodynamics in murine models. Recently, our group demonstrated the first direct acquisition of 4-D images (3D+time) of the murine embryonic cardiovascular system using an OCT system with an A-line acquisition rate of 1.5 MHz.145 With a frame rate of and a volume rate of , the dynamic features of the embryonic mouse heart at E9.5 were resolved, producing a 3-D volume of (x,y,z) pixels. Quantitative analyses of heart wall motion, 4-D speckle variance, and Doppler techniques to image the blood vessels were also demonstrated in the study. The ability to acquire a volume at twice the rate of previous techniques showed the potential of this method for live phenotyping. Figures 20(a) and 20(b) show the large-field OCT image (obtained from slow galvanometer mirror scanning) and 4-D cardiodynamics of an E9.5 embryo, respectively. Figure 20(b) shows a frame from a movie of the 4-D cardiodynamics obtained from direct time-lapse 3-D imaging with a volume acquisition rate of . Fig. 20(a) Large-field 3-D OCT image of E9.5 murine embryo. (b) 4-D cardiodynamics of an E9.5 murine embryo obtained from direct time-lapse 3-D imaging. Red arrows indicate the blood flow. (Video 5, MPEG, 13915 KB) [URL: http://dx.doi.org/10.1117/1.JBO.21.5.050902.5]. Scale bars are . Adapted from Ref. 145.  5.2.Analyzing the Effects of TeratogensA large number of environmental factors can affect the normal growth and development of an embryo. Alcohol and nicotine are known to be two of the most serious teratogens. Owing to the limitations of other modalities used for imaging embryos, OCT is a powerful tool for investigating different defects and the mechanisms that cause these defects. Our group, studied the effects of prenatal alcohol exposure on the brain of mouse embryos in utero in 2013,117 as discussed in Sec. 4.2.2. Karunamuni et al.146,147 have utilized OCT to study the structure and function of the developing heart when the embryo is subjected to prenatal alcohol exposure. 5.3.Rotational Imaging Optical Coherence Tomography to Image Developing EmbryosWhile imaging nontransparent samples such as tissue, light is scattered and absorbed. This leads to significant attenuation, thus limiting the imaging depth of OCT, especially, in later stages of embryonic development. To overcome this challenge, our group has proposed a new technique called rotational imaging OCT (RI-OCT).148 3-D structural imaging was performed at four different angles with an interval of 90 deg between each angle. The volumes obtained from different angles were combined into a single image during postprocessing. Figure 21 shows an E10.5 embryo imaged at different angles and a combined image after proper rotation, scaling, and registration. The results showed that deeper embryonic structures were more clearly visualized in the combined image rather than in an image from one angle, thus demonstrating the ability of RI-OCT to improve OCT imaging of whole mouse embryos by increasing the contrast and extending the imaging depth. Fig. 21Selected RI-OCT images at (a) 0 deg, (b) 180 deg, (c) 0 deg and 180 deg composite, (d) 90 deg, (e) 270 deg, (f) 0 deg and 180 deg composite, (g) composite from all four angles, and (h) 3-D composite from all four angles of an E 9.5 embryo. Scale bars are . Adapted from Ref. 148.  5.4.Imaging of Reproductive OrgansFertilization of the oocyte by a sperm begins the complex process of embryogenesis. After fertilization, the oocyte travels through the oviduct during preimplantation development and enters the uterus, where it undergoes implantation.149,150 Infertility can be caused due to mishaps that occur during the travel of the fertilized oocyte through the oviduct to the uterus.151,152 Thus, live high-resolution imaging of the reproductive organs would provide a basis for better understanding of the mechanisms during reproduction and embryogenesis. Although a number of imaging techniques have been used for this purpose,153–156 there has always been a gap in terms of resolution or imaging depth. OCT fits perfectly in terms of spatial resolution and imaging depth to provide noninvasive high-resolution imaging to study the events that occur in the reproductive organs during embryogenesis. In vitro OCT images of the dissected human fallopian tube were comparable to corresponding histological sections.157,158 Boppart et al.159 performed preliminary studies using laparoscopic OCT to differentiate between normal and pathological ovarian tissue. Although this was a preliminary in vitro investigation, the tissues were oriented to simulate laparoscopic procedures, thus showing that the combination of laparoscopy and OCT is a promising method to detect subsurface pathological changes. Recently, Trottman et al.160 demonstrated ex vivo imaging of the reproductive tract in a bovine model using OCT and also performed histological comparison. The first live OCT imaging of a mammalian oviduct was demonstrated by Burton et al.161 utilizing SDOCT. Figure 22 shows high-resolution OCT images depicting the internal structures of the oviduct ampulla, thus demonstrating that OCT is a powerful tool to study the internal structures of murine reproductive organs. Cilia are known to play an important role in the transport of the fertilized oocyte through the oviduct, and subsequently, ciliary behavior is another key parameter for understanding reproduction and embryogenesis. Wang et al.162 recently used functional OCT to study dynamic ciliary behavior in the mouse oviduct. They demonstrated ciliary beat frequency (cbf) mapping and differentiated between the cbf at different locations on the oviduct at different postconception stages. Fig. 22In vivo OCT imaging of the oviduct ampulla containing the oocytes and cumulus cells. (a) 3-D OCT reconstruction of the ampulla where the longitudinal mucosa folds are clearly visible. The dashed lines depict the cross sections shown in (b–f). All scale bars correspond to . Adapted from Ref. 161.  6.ConclusionOCT has clear advantages over other imaging modalities for different biomedical applications. With micrometer-scale resolution, noninvasive imaging capabilities, and an imaging depth of few millimeters in tissue, OCT has been extremely successful in studying the growth and development of embryos, even from very early stages. There have been tremendous advances in OCT from initial static embryo imaging using TDOCT in the late 90s to recent developments enabling direct 4-D imaging of embryonic cardiodynamics utilizing FDML-based SSOCT systems. This review has described in detail the use of OCT to image developing embryos, the advances in the field, and the advantages and limitations of utilizing OCT for embryonic imaging. AcknowledgmentsThis work is supported, in part, by the National Institutes of Health with Grant Nos. R01HL120140, HL095586, U54HG006348, and R01HD086765. ReferencesL. Rynn, J. Cragan and A. Correa,
“Update on overall prevalence of major birth defects—Atlanta, Georgia, 1978–2005 of document,”
(2008) http://www.cdc.gov/mmwr/preview/mmwrhtml/mm5701a2.htm January ). 2008). Google Scholar
P. W. Yoon et al.,
“Contribution of birth defects and genetic diseases to pediatric hospitalizations. A population-based study,”
Arch. Pediatr. Adolesc. Med., 151
(11), 1096
–1103
(1997). http://dx.doi.org/10.1001/archpedi.1997.02170480026004 Google Scholar
J. Beckers, W. Wurst and M. H. de Angelis,
“Towards better mouse models: enhanced genotypes, systemic phenotyping and envirotype modelling,”
Nat. Rev. Genet., 10
(6), 371
–380
(2009). http://dx.doi.org/10.1038/nrg2578 Google Scholar
S. D. M. Brown, J. M. Hancock and H. Gates,
“Understanding mammalian genetic systems: the challenge of phenotyping in the mouse,”
PLoS Genet., 2
(8), e118
(2006). http://dx.doi.org/10.1371/journal.pgen.0020118 Google Scholar
P. M. Nolan et al.,
“A systematic, genome-wide, phenotype-driven mutagenesis programme for gene function studies in the mouse,”
Nat. Genet., 25
(4), 440
–443
(2000). http://dx.doi.org/10.1038/78140 Google Scholar
K. Paigen and J. T. Eppig,
“A mouse phenome project,”
Mamm. Genome., 11
(9), 715
–717
(2000). http://dx.doi.org/10.1007/s003350010152 Google Scholar
J. Sharpe et al.,
“Optical projection tomography as a tool for 3D microscopy and gene expression studies,”
Science, 296
(5567), 541
–545
(2002). http://dx.doi.org/10.1126/science.1068206 SCIEAS 0036-8075 Google Scholar
J. R. Walls et al.,
“Three-dimensional analysis of vascular development in the mouse embryo,”
PLoS One, 3
(8), e2853
(2008). http://dx.doi.org/10.1371/journal.pone.0002853 POLNCL 1932-6203 Google Scholar
M. E. Dickinson,
“Multimodal imaging of mouse development: tools for the postgenomic era,”
Dev. Dyn., 235
(9), 2386
–2400
(2006). http://dx.doi.org/10.1002/(ISSN)1097-0177 Google Scholar
E. A. Jones et al.,
“Dynamic in vivo imaging of postimplantation mammalian embryos using whole embryo culture,”
Genesis, 34
(4), 228
–235
(2002). http://dx.doi.org/10.1002/(ISSN)1526-968X Google Scholar
J. L. Lucitti et al.,
“Vascular remodeling of the mouse yolk sac requires hemodynamic force,”
Development, 134
(18), 3317
–3326
(2007). http://dx.doi.org/10.1242/dev.02883 Google Scholar
S. Nowotschin and A. K. Hadjantonakis,
“Use of KikGR a photoconvertible green-to-red fluorescent protein for cell labeling and lineage analysis in ES cells and mouse embryos,”
BMC Dev. Biol., 9
(49), 1
–12
(2009). http://dx.doi.org/10.1186/1471-213X-9-49 Google Scholar
F. S. Foster et al.,
“In vivo imaging of embryonic development in the mouse eye by ultrasound biomicroscopy,”
Invest. Ophthalmol. Vis. Sci., 44
(6), 2361
–2366
(2003). http://dx.doi.org/10.1167/iovs.02-0911 Google Scholar
C. K. Phoon and D. H. Turnbull,
“Ultrasound biomicroscopy-Doppler in mouse cardiovascular development,”
Physiol. Genomics, 14
(1), 3
–15
(2003). http://dx.doi.org/10.1152/physiolgenomics.00008.2003 Google Scholar
B. Hogers et al.,
“Magnetic resonance microscopy of mouse embryos in utero,”
Anat. Rec., 260
(4), 373
–377
(2000). http://dx.doi.org/10.1002/(ISSN)1097-0185 Google Scholar
B. J. Nieman et al.,
“Magnetic resonance imaging for detection and analysis of mouse phenotypes,”
NMR Biomed., 18
(7), 447
–468
(2005). http://dx.doi.org/10.1002/(ISSN)1099-1492 Google Scholar
P. Pallares, M. E. Fernandez-Valle and A. Gonzalez-Bulnes,
“In vivo virtual histology of mouse embryogenesis by ultrasound biomicroscopy and magnetic resonance imaging,”
Reprod. Fertil. Dev., 21
(2), 283
–292
(2009). http://dx.doi.org/10.1071/RD08124 Google Scholar
B. Dogdas et al.,
“Digimouse: a 3D whole body mouse atlas from CT and cryosection data,”
Phys. Med. Biol., 52
(3), 577
–587
(2007). http://dx.doi.org/10.1088/0031-9155/52/3/003 Google Scholar
M. J. Paulus et al.,
“High resolution X-ray computed tomography: an emerging tool for small animal cancer research,”
Neoplasia, 2
(1–2), 62
–70
(2000). http://dx.doi.org/10.1038/sj.neo.7900069 Google Scholar
E. L. Ritman,
“Micro-computed tomography-current status and developments,”
Annu. Rev. Biomed. Eng., 6 185
–208
(2004). http://dx.doi.org/10.1146/annurev.bioeng.6.040803.140130 Google Scholar
J. F. Colas and J. Sharpe,
“Live optical projection tomography,”
Organogenesis, 5
(4), 211
–216
(2009). http://dx.doi.org/10.4161/org.5.4.10426 Google Scholar
J. Huisken et al.,
“Optical sectioning deep inside live embryos by selective plane illumination microscopy,”
Science, 305
(5686), 1007
–1009
(2004). http://dx.doi.org/10.1126/science.1100035 SCIEAS 0036-8075 Google Scholar
P. J. Keller and E. H. K. Stelzer,
“Quantitative in vivo imaging of entire embryos with digital scanned laser light sheet fluorescence microscopy,”
Curr. Opin. Neurobiol., 18
(6), 624
–632
(2008). http://dx.doi.org/10.1016/j.conb.2009.03.008 COPUEN 0959-4388 Google Scholar
D. Huang et al.,
“Optical coherence tomography,”
Science, 254
(5035), 1178
–1181
(1991). http://dx.doi.org/10.1126/science.1957169 SCIEAS 0036-8075 Google Scholar
J. Chen and L. Lee,
“Clinical applications and new developments of optical coherence tomography: an evidence-based review,”
Clin. Exp. Optom., 90
(5), 317
–335
(2007). http://dx.doi.org/10.1111/cxo.2007.90.issue-5 Google Scholar
W. Drexler and J. G. Fujimoto, Optical Coherence Tomography: Technology and Applications, Springer, New York, Berlin
(2008). Google Scholar
I. V. Larina et al.,
“Optical coherence tomography for live imaging of mammalian development,”
Curr. Opin. Genet. Dev., 21
(5), 579
–584
(2011). http://dx.doi.org/10.1016/j.gde.2011.09.004 Google Scholar
M. W. Jenkins, M. Watanabe and A. M. Rollins,
“Longitudinal imaging of heart development with optical coherence tomography,”
IEEE J. Sel. Top. Quantum Electron., 18
(3), 1166
–1175
(2012). http://dx.doi.org/10.1109/JSTQE.2011.2166060 Google Scholar
M. W. Jenkins, A. M. Rollins,
“4-D OCT in developmental cardiology,”
Optical Coherence Tomography: Technology and Applications, 2003
–2023 Springer International Publishing, Cham, Switzerland
(2015). Google Scholar
J. Men et al.,
“Optical coherence tomography for brain imaging and developmental biology,”
IEEE J. Sel. Top. Quantum Electron., 22
(4), 1
–13
(2016). http://dx.doi.org/10.1109/JSTQE.2015.2513667 IJSQEN 1077-260X Google Scholar
M. D. Garcia et al.,
“Imaging of cardiovascular development in mammalian embryos using optical coherence tomography,”
Methods Mol. Biol., 1214 151
–161
(2015). http://dx.doi.org/10.1007/978-1-4939-1462-3 Google Scholar
W. Drexler et al.,
“Enhanced visualization of macular pathology with the use of ultrahigh-resolution optical coherence tomography,”
Arch. Ophthalmol., 121
(5), 695
–706
(2003). http://dx.doi.org/10.1001/archopht.121.5.695 Google Scholar
C. A. Puliafito et al.,
“Imaging of macular diseases with optical coherence tomography,”
Ophthalmology, 102
(2), 217
–229
(1995). http://dx.doi.org/10.1016/S0161-6420(95)31032-9 OPANEW 0743-751X Google Scholar
E. Sattler, R. Kastle and J. Welzel,
“Optical coherence tomography in dermatology,”
J. Biomed. Opt., 18
(6), 061224
(2013). http://dx.doi.org/10.1117/1.JBO.18.6.061224 Google Scholar
I. K. Jang et al.,
“Visualization of coronary atherosclerotic plaques in patients using optical coherence tomography: comparison with intravascular ultrasound,”
J. Am. Coll. Cardiol., 39
(4), 604
–609
(2002). http://dx.doi.org/10.1016/S0735-1097(01)01799-5 Google Scholar
I. K. Jang et al.,
“In vivo characterization of coronary atherosclerotic plaque by use of optical coherence tomography,”
Circulation, 111
(12), 1551
–1555
(2005). http://dx.doi.org/10.1161/01.CIR.0000159354.43778.69 CIRCAZ 0009-7322 Google Scholar
L. L. Otis et al.,
“Optical coherence tomography: a new imaging technology for dentistry,”
J. Am. Dent. Assoc., 131
(4), 511
–514
(2000). http://dx.doi.org/10.14219/jada.archive.2000.0210 Google Scholar
B. J. Vakoc et al.,
“Cancer imaging by optical coherence tomography: preclinical progress and clinical potential,”
Nat. Rev. Cancer, 12
(5), 363
–368
(2012). http://dx.doi.org/10.1038/nrc3235 Google Scholar
A. Nam et al.,
“Optical coherence tomography in cancer imaging,”
Optical Coherence Tomography, 1399
–1412 Springer International Publishing, Switzerland
(2015). Google Scholar
S. Wang et al.,
“Three-dimensional computational analysis of optical coherence tomography images for the detection of soft tissue sarcomas,”
J. Biomed. Opt., 19
(2), 021102
(2014). http://dx.doi.org/10.1117/1.JBO.19.2.021102 Google Scholar
A. F. Fercher, K. Mengedoht and W. Werner,
“Eye-length measurement by interferometry with partially coherent light,”
Opt. Lett., 13
(3), 186
–188
(1988). http://dx.doi.org/10.1364/OL.13.000186 Google Scholar
M. Choma et al.,
“Sensitivity advantage of swept source and Fourier domain optical coherence tomography,”
Opt. Express, 11
(18), 2183
–2189
(2003). http://dx.doi.org/10.1364/OE.11.002183 Google Scholar
J. F. de Boer et al.,
“Improved signal-to-noise ratio in spectral-domain compared with time-domain optical coherence tomography,”
Opt. Lett., 28
(21), 2067
–2069
(2003). http://dx.doi.org/10.1364/OL.28.002067 Google Scholar
R. Leitgeb, C. Hitzenberger and A. Fercher,
“Performance of Fourier domain vs. time domain optical coherence tomography,”
Opt. Express, 11
(8), 889
–894
(2003). http://dx.doi.org/10.1364/OE.11.000889 Google Scholar
Z. Chen et al.,
“Noninvasive imaging of in vivo blood flow velocity using optical Doppler tomography,”
Opt. Lett., 22
(14), 1119
–1121
(1997). http://dx.doi.org/10.1364/OL.22.001119 Google Scholar
J. A. Izatt et al.,
“In vivo bidirectional color Doppler flow imaging of picoliter blood volumes using optical coherence tomography,”
Opt. Lett., 22
(18), 1439
–1441
(1997). http://dx.doi.org/10.1364/OL.22.001439 Google Scholar
J. K. Barton and S. Stromski,
“Flow measurement without phase information in optical coherence tomography images,”
Opt. Express., 13
(14), 5234
–5239
(2005). http://dx.doi.org/10.1364/OPEX.13.005234 Google Scholar
A. Mariampillai et al.,
“Speckle variance detection of microvasculature using swept-source optical coherence tomography,”
Opt. Lett., 33
(13), 1530
–1532
(2008). http://dx.doi.org/10.1364/OL.33.001530 Google Scholar
M. S. Mahmud et al.,
“Review of speckle and phase variance optical coherence tomography to visualize microvascular networks,”
J. Biomed. Opt., 18
(5), 050901
(2013). http://dx.doi.org/10.1117/1.JBO.18.5.050901 JBOPFO 1083-3668 Google Scholar
S. Wang and K. V. Larin,
“Optical coherence elastography for tissue characterization: a review,”
J. Biophotonics, 8
(4), 279
–302
(2015). http://dx.doi.org/10.1002/jbio.v8.4 Google Scholar
J. M. Schmitt,
“OCT elastography: imaging microscopic deformation and strain of tissue,”
Opt. Express, 3
(6), 199
–211
(1998). http://dx.doi.org/10.1364/OE.3.000199 OPEXFF 1094-4087 Google Scholar
J. F. de Boer et al.,
“Two-dimensional birefringence imaging in biological tissue by polarization-sensitive optical coherence tomography,”
Opt. Lett., 22
(12), 934
–936
(1997). http://dx.doi.org/10.1364/OL.22.000934 OPLEDP 0146-9592 Google Scholar
J. F. de Boer and T. E. Milner,
“Review of polarization sensitive optical coherence tomography and Stokes vector determination,”
J. Biomed. Opt., 7
(3), 359
–371
(2002). http://dx.doi.org/10.1117/1.1483879 JBOPFO 1083-3668 Google Scholar
Y. Jiang et al.,
“Second-harmonic optical coherence tomography,”
Opt. Lett., 29
(10), 1090
–1092
(2004). http://dx.doi.org/10.1364/OL.29.001090 OPLEDP 0146-9592 Google Scholar
A. Zhang et al.,
“Methods and algorithms for optical coherence tomography-based angiography: a review and comparison,”
J. Biomed. Opt., 20
(10), 100901
(2015). http://dx.doi.org/10.1117/1.JBO.20.10.100901 JBOPFO 1083-3668 Google Scholar
R. K. Wang et al.,
“Three dimensional optical angiography,”
Opt. Express, 15
(7), 4083
–4097
(2007). http://dx.doi.org/10.1364/OE.15.004083 OPEXFF 1094-4087 Google Scholar
S. A. Boppart et al.,
“Investigation of developing embryonic morphology using optical coherence tomography,”
Dev. Biol., 177
(1), 54
–63
(1996). http://dx.doi.org/10.1006/dbio.1996.0144 Google Scholar
S. A. Boppart et al.,
“Imaging developing neural morphology using optical coherence tomography,”
J. Neurosci. Methods, 70
(1), 65
–72
(1996). http://dx.doi.org/10.1016/S0165-0270(96)00104-5 Google Scholar
M. E. Brezinski et al.,
“Optical coherence tomography for optical biopsy. Properties and demonstration of vascular pathology,”
Circulation, 93
(6), 1206
–1213
(1996). http://dx.doi.org/10.1161/01.CIR.93.6.1206 CIRCAZ 0009-7322 Google Scholar
J. G. Fujimoto et al.,
“Optical coherence tomography: an emerging technology for biomedical imaging and optical biopsy,”
Neoplasia, 2
(1–2), 9
–25
(2000). http://dx.doi.org/10.1038/sj.neo.7900071 Google Scholar
M. D. Reller et al.,
“Prevalence of congenital heart defects in metropolitan Atlanta, 1998-2005,”
J. Pediatr., 153
(6), 807
–813
(2008). http://dx.doi.org/10.1016/j.jpeds.2008.05.059 Google Scholar
J. I. Hoffman and S. Kaplan,
“The incidence of congenital heart disease,”
J. Am. Coll. Cardiol., 39
(12), 1890
–1900
(2002). http://dx.doi.org/10.1016/S0735-1097(02)01886-7 Google Scholar
H. Mao et al.,
“Embryonic heart morphogenesis from confocal microscopy imaging and automatic segmentation,”
Comput. Math. Methods. Med., 2013 1
–7
(2013). http://dx.doi.org/10.1155/2013/293069 Google Scholar
S. J. Kolker, U. Tajchman and D. L. Weeks,
“Confocal imaging of early heart development in Xenopus laevis,”
Dev. Biol., 218
(1), 64
–73
(2000). http://dx.doi.org/10.1006/dbio.1999.9558 Google Scholar
F. S. Foster et al.,
“A new ultrasound instrument for in vivo microimaging of mice,”
Ultrasound Med. Biol., 28
(9), 1165
–1172
(2002). http://dx.doi.org/10.1016/S0301-5629(02)00567-7 Google Scholar
Y. H. Gui et al.,
“Doppler echocardiography of normal and abnormal embryonic mouse heart,”
Pediatr. Res., 40
(4), 633
–642
(1996). http://dx.doi.org/10.1203/00006450-199610000-00020 Google Scholar
T. C. McQuinn et al.,
“High-frequency ultrasonographic imaging of avian cardiovascular development,”
Dev. Dyn., 236
(12), 3503
–3513
(2007). http://dx.doi.org/10.1002/dvdy.v236:12 Google Scholar
B. B. Keller, J. P. Tinney and N. Hu,
“Embryonic ventricular diastolic and systolic pressure-volume relations,”
Cardiol. Young, 4
(01), 19
–27
(1994). http://dx.doi.org/10.1017/S1047951100010829 Google Scholar
H. L. Bartlett et al.,
“Characterization of embryonic cardiac pacemaker and atrioventricular conduction physiology in Xenopus laevis using noninvasive imaging,”
Am. J. Physiol. Heart Circ. Physiol., 286
(6), H2035
–H2041
(2004). http://dx.doi.org/10.1152/ajpheart.00807.2003 Google Scholar
S. A. Boppart et al.,
“Noninvasive assessment of the developing Xenopus cardiovascular system using optical coherence tomography,”
Proc. Natl. Acad. Sci. U. S. A., 94
(9), 4256
–4261
(1997). http://dx.doi.org/10.1073/pnas.94.9.4256 Google Scholar
G. J. Tearney, B. E. Bouma and J. G. Fujimoto,
“High-speed phase- and group-delay scanning with a grating-based phase control delay line,”
Opt. Lett., 22
(23), 1811
–1813
(1997). http://dx.doi.org/10.1364/OL.22.001811 Google Scholar
A. Rollins et al.,
“In vivo video rate optical coherence tomography,”
Opt. Express, 3
(6), 219
–229
(1998). http://dx.doi.org/10.1364/OE.3.000219 Google Scholar
T. M. Yelbuz et al.,
“Optical coherence tomography: a new high-resolution imaging technology to study cardiac development in chick embryos,”
Circulation, 106
(22), 2771
–2774
(2002). http://dx.doi.org/10.1161/01.CIR.0000042672.51054.7B CIRCAZ 0009-7322 Google Scholar
B. A. Filas, I. R. Efimov and L. A. Taber,
“Optical coherence tomography as a tool for measuring morphogenetic deformation of the looping heart,”
Anat. Rec., 290
(9), 1057
–1068
(2007). http://dx.doi.org/10.1002/(ISSN)1932-8494 Google Scholar
J. Manner et al.,
“High-resolution in vivo imaging of the cross-sectional deformations of contracting embryonic heart loops using optical coherence tomography,”
Dev. Dyn., 237
(4), 953
–961
(2008). http://dx.doi.org/10.1002/dvdy.v237:4 Google Scholar
A. Barry,
“The functional significance of the cardiac jelly in the tubular heart of the chick embryo,”
Anat. Rec., 102
(3), 289
–298
(1948). http://dx.doi.org/10.1002/(ISSN)1097-0185 Google Scholar
B. C. Groenendijk et al.,
“Changes in shear stress-related gene expression after experimentally altered venous return in the chicken embryo,”
Circ. Res., 96
(12), 1291
–1298
(2005). http://dx.doi.org/10.1161/01.RES.0000171901.40952.0d Google Scholar
B. Hogers et al.,
“Extraembryonic venous obstructions lead to cardiovascular malformations and can be embryolethal,”
Cardiovasc. Res., 41
(1), 87
–99
(1999). http://dx.doi.org/10.1016/S0008-6363(98)00218-1 Google Scholar
K. Tobita and B. B. Keller,
“Maturation of end-systolic stress-strain relations in chick embryonic myocardium,”
Am. J. Physiol. Heart Circ. Physiol., 279
(1), H216
–224
(2000). Google Scholar
N. T. Ursem et al.,
“Ventricular diastolic filling characteristics in stage-24 chick embryos after extra-embryonic venous obstruction,”
J. Exp. Biol., 207
(Pt 9), 1487
–1490
(2004). http://dx.doi.org/10.1242/jeb.00902 Google Scholar
C. Poelma et al.,
“Measurements of the wall shear stress distribution in the outflow tract of an embryonic chicken heart,”
J. R. Soc. Interface, 7
(42), 91
–103
(2010). http://dx.doi.org/10.1098/rsif.2009.0063 Google Scholar
P. Vennemann et al.,
“In vivo micro particle image velocimetry measurements of blood-plasma in the embryonic avian heart,”
J. Biomech., 39
(7), 1191
–1200
(2006). http://dx.doi.org/10.1016/j.jbiomech.2005.03.015 Google Scholar
J. T. Butcher et al.,
“Transitions in early embryonic atrioventricular valvular function correspond with changes in cushion biomechanics that are predictable by tissue composition,”
Circ. Res., 100
(10), 1503
–1511
(2007). http://dx.doi.org/10.1161/CIRCRESAHA.107.148684 Google Scholar
J. W. Wladimiroff, H. M. Tonge and P. A. Stewart,
“Doppler ultrasound assessment of cerebral blood flow in the human fetus,”
Br. J. Obstet. Gynaecol., 93
(5), 471
–475
(1986). http://dx.doi.org/10.1111/bjo.1986.93.issue-5 Google Scholar
S. Yazdanfar, M. Kulkarni and J. Izatt,
“High resolution imaging of in vivo cardiac dynamics using color Doppler optical coherence tomography,”
Opt. Express, 1
(13), 424
–431
(1997). http://dx.doi.org/10.1364/OE.1.000424 Google Scholar
V. Westphal et al.,
“Real-time, high velocity-resolution color Doppler optical coherence tomography,”
Opt. Lett., 27
(1), 34
–36
(2002). http://dx.doi.org/10.1364/OL.27.000034 Google Scholar
V. Yang et al.,
“High speed, wide velocity dynamic range Doppler optical coherence tomography (Part I): system design, signal processing, and performance,”
Opt. Express, 11
(7), 794
–809
(2003). http://dx.doi.org/10.1364/OE.11.000794 Google Scholar
V. X. Yang et al.,
“High speed, wide velocity dynamic range Doppler optical coherence tomography (Part II): imaging in vivo cardiac dynamics of Xenopus laevis,”
Opt. Express, 11
(14), 1650
–1658
(2003). http://dx.doi.org/10.1364/OE.11.001650 Google Scholar
M. W. Jenkins et al.,
“4D embryonic cardiography using gated optical coherence tomography,”
Opt. Express, 14
(2), 736
–748
(2006). http://dx.doi.org/10.1364/OPEX.14.000736 OPEXFF 1094-4087 Google Scholar
M. W. Jenkins et al.,
“In vivo gated 4D imaging of the embryonic heart using optical coherence tomography,”
J. Biomed. Opt., 12
(3), 030505
(2007). http://dx.doi.org/10.1117/1.2747208 Google Scholar
M. W. Jenkins et al.,
“Phenotyping transgenic embryonic murine hearts using optical coherence tomography,”
Appl. Opt., 46
(10), 1776
–1781
(2007). http://dx.doi.org/10.1364/AO.46.001776 Google Scholar
L. Kagemann et al.,
“Repeated, noninvasive, high resolution spectral domain optical coherence tomography imaging of zebrafish embryos,”
Mol. Vis., 14 2157
–2170
(2008). Google Scholar
L. Bernstein et al.,
“Non-invasive imaging of zebrafish with spinal deformities using optical coherence tomography: a preliminary study,”
Proc. SPIE, 8565 85656H
(2013). http://dx.doi.org/10.1117/12.2002142 PSISDG 0277-786X Google Scholar
S. A. Patten et al.,
“Role of Chd7 in zebrafish: a model for CHARGE syndrome,”
PLoS One, 7
(2), e31650
(2012). http://dx.doi.org/10.1371/journal.pone.0031650 POLNCL 1932-6203 Google Scholar
K. Divakar Rao et al.,
“Noninvasive imaging of ethanol-induced developmental defects in zebrafish embryos using optical coherence tomography,”
Birth Defects Res. B Dev. Reprod. Toxicol., 95
(1), 7
–11
(2012). http://dx.doi.org/10.1002/bdrb.20332 Google Scholar
A. Bradu et al.,
“Dual optical coherence tomography/fluorescence microscopy for monitoring of Drosophila melanogaster larval heart,”
J. Biophotonics, 2
(6–7), 380
–388
(2009). http://dx.doi.org/10.1002/jbio.v2:6/7 Google Scholar
P. Ma et al.,
“Three-dimensional correction of conduction velocity in the embryonic heart using integrated optical mapping and optical coherence tomography,”
J. Biomed. Opt., 19
(7), 076004
(2014). http://dx.doi.org/10.1117/1.JBO.19.7.076004 Google Scholar
III A. L. Lopez et al.,
“Live four-dimensional optical coherence tomography reveals embryonic cardiac phenotype in mouse mutant,”
J. Biomed. Opt., 20
(9), 090501
(2015). http://dx.doi.org/10.1117/1.JBO.20.9.090501 Google Scholar
S. H. Syed et al.,
“Optical coherence tomography guided microinjections in live mouse embryos: high-resolution targeted manipulation for mouse embryonic research,”
J. Biomed. Opt., 20
(5), 051020
(2015). http://dx.doi.org/10.1117/1.JBO.20.5.051020 Google Scholar
A. M. Davis et al.,
“In vivo spectral domain optical coherence tomography volumetric imaging and spectral Doppler velocimetry of early stage embryonic chicken heart development,”
J. Opt. Soc. Am. A Opt. Image Sci. Vis., 25
(12), 3134
–3143
(2008). http://dx.doi.org/10.1364/JOSAA.25.003134 Google Scholar
A. Davis, J. Izatt and F. Rothenberg,
“Quantitative measurement of blood flow dynamics in embryonic vasculature using spectral Doppler velocimetry,”
Anat. Rec., 292
(3), 311
–319
(2009). http://dx.doi.org/10.1002/ar.v292:3 Google Scholar
D. C. Ghiglia, G. A. Mastin and L. A. Romero,
“Cellular-automata method for phase unwrapping,”
J. Opt. Soc. Am. A Opt. Image Sci. Vis., 4
(1), 267
(1987). http://dx.doi.org/10.1364/JOSAA.4.000267 Google Scholar
Z. Ma et al.,
“Measurement of absolute blood flow velocity in outflow tract of HH18 chicken embryo based on 4D reconstruction using spectral domain optical coherence tomography,”
Biomed. Opt. Express, 1
(3), 798
–811
(2010). http://dx.doi.org/10.1364/BOE.1.000798 Google Scholar
A. Liu et al.,
“Quantifying blood flow and wall shear stresses in the outflow tract of chick embryonic hearts,”
Comput. Struct., 89
(11–12), 855
–867
(2011). http://dx.doi.org/10.1016/j.compstruc.2011.03.003 Google Scholar
A. Liu et al.,
“Dynamic variation of hemodynamic shear stress on the walls of developing chick hearts: computational models of the heart outflow tract,”
Eng. Comput., 25
(1), 73
–86
(2009). http://dx.doi.org/10.1007/s00366-008-0107-0 Google Scholar
A. Liu et al.,
“Biomechanics of the chick embryonic heart outflow tract at HH18 Using 4D optical coherence tomography imaging and computational modeling,”
PLoS One, 7
(7), e40869
(2012). http://dx.doi.org/10.1371/journal.pone.0040869 POLNCL 1932-6203 Google Scholar
M. Zhenhe et al.,
“Spectral domain optical coherence tomography for embryo heart flow measurement,”
Procedia Eng., 15 5318
–5322
(2011). http://dx.doi.org/10.1016/j.proeng.2011.08.986 Google Scholar
M. Midgett et al.,
“Blood flow through the embryonic heart outflow tract during cardiac looping in HH13-HH18 chicken embryos,”
J. R. Soc. Interface, 12
(111), 20150652
(2015). http://dx.doi.org/10.1098/rsif.2015.0652 Google Scholar
S. Rugonyi et al.,
“Changes in wall motion and blood flow in the outflow tract of chick embryonic hearts observed with optical coherence tomography after outflow tract banding and vitelline-vein ligation,”
Phys. Med. Biol., 53
(18), 5077
–5091
(2008). http://dx.doi.org/10.1088/0031-9155/53/18/015 Google Scholar
P. Li et al.,
“Assessment of strain and strain rate in embryonic chick heart in vivo using tissue Doppler optical coherence tomography,”
Phys. Med. Biol., 56
(22), 7081
–7092
(2011). http://dx.doi.org/10.1088/0031-9155/56/22/006 Google Scholar
P. Li et al.,
“Measurement of strain and strain rate in embryonic chick heart in vivo using spectral domain optical coherence tomography,”
IEEE Trans. Biomed. Eng., 58
(8), 2333
–2338
(2011). http://dx.doi.org/10.1109/TBME.2011.2153851 Google Scholar
Z. Ma et al.,
“In vivo assessment of wall strain in embryonic chick heart by spectral domain optical coherence tomography,”
Appl. Opt., 54
(31), 9253
–9257
(2015). http://dx.doi.org/10.1364/AO.54.009253 Google Scholar
K. V. Larin et al.,
“Live imaging of early developmental processes in mammalian embryos with optical coherence tomography,”
J. Innov. Opt. Health Sci., 2
(3), 253
–259
(2009). http://dx.doi.org/10.1142/S1793545809000619 Google Scholar
S. H. Syed et al.,
“Optical coherence tomography for high-resolution imaging of mouse development in utero,”
J. Biomed. Opt., 16
(4), 046004
(2011). http://dx.doi.org/10.1117/1.3560300 Google Scholar
I. V. Larina et al.,
“Optical coherence tomography for live phenotypic analysis of embryonic ocular structures in mouse models,”
J. Biomed. Opt., 17
(8), 081410
(2012). http://dx.doi.org/10.1117/1.JBO.17.8.081410 Google Scholar
N. Sudheendran et al.,
“Quantification of mouse embryonic eye development with optical coherence tomography in utero,”
J. Biomed. Photonics Eng., 1
(1), 90
–95
(2015). http://dx.doi.org/10.18287/JBPE-2015-1-1-90 Google Scholar
N. Sudheendran et al.,
“Comparative assessments of the effects of alcohol exposure on fetal brain development using optical coherence tomography and ultrasound imaging,”
J. Biomed. Opt., 18
(2), 020506
(2013). http://dx.doi.org/10.1117/1.JBO.18.2.020506 Google Scholar
I. V. Larina et al.,
“Live imaging of blood flow in mammalian embryos using Doppler swept-source optical coherence tomography,”
J. Biomed. Opt., 13
(6), 060506
(2008). http://dx.doi.org/10.1117/1.3046716 Google Scholar
E. A. Jones et al.,
“Measuring hemodynamic changes during mammalian development,”
Am. J. Physiol. Heart Circ. Physiol., 287
(4), H1561
–H1569
(2004). http://dx.doi.org/10.1152/ajpheart.00081.2004 Google Scholar
I. V. Larina et al.,
“Hemodynamic measurements from individual blood cells in early mammalian embryos with Doppler swept source OCT,”
Opt. Lett., 34
(7), 986
–988
(2009). http://dx.doi.org/10.1364/OL.34.000986 Google Scholar
J. Fingler et al.,
“Mobility and transverse flow visualization using phase variance contrast with spectral domain optical coherence tomography,”
Opt. Express, 15
(20), 12636
–12653
(2007). http://dx.doi.org/10.1364/OE.15.012636 Google Scholar
A. Mariampillai et al.,
“Optimized speckle variance OCT imaging of microvasculature,”
Opt. Lett., 35
(8), 1257
–1259
(2010). http://dx.doi.org/10.1364/OL.35.001257 Google Scholar
N. Sudheendran et al.,
“Speckle variance OCT imaging of the vasculature in live mammalian embryos,”
Laser Phys. Lett., 8
(3), 247
–252
(2011). http://dx.doi.org/10.1002/lapl.v8.3 Google Scholar
P. M. Kulkarni et al.,
“Algorithms for improved 3-D reconstruction of live mammalian embryo vasculature from optical coherence tomography data,”
Quantum Imaging Med. Surg., 5
(1), 125
–135
(2015). http://dx.doi.org/10.3978/j.issn.2223-4292.2014.11.33 Google Scholar
M. Buehr et al.,
“Capture of authentic embryonic stem cells from rat blastocysts,”
Cell, 135
(7), 1287
–1298
(2008). http://dx.doi.org/10.1016/j.cell.2008.12.007 CELLB5 0092-8674 Google Scholar
P. Li et al.,
“Germline competent embryonic stem cells derived from rat blastocysts,”
Cell, 135
(7), 1299
–1310
(2008). http://dx.doi.org/10.1016/j.cell.2008.12.006 CELLB5 0092-8674 Google Scholar
I. V. Larina et al.,
“Live imaging of rat embryos with Doppler swept-source optical coherence tomography,”
J. Biomed. Opt., 14
(5), 050506
(2009). http://dx.doi.org/10.1117/1.3241044 Google Scholar
A. Mariampillai et al.,
“Doppler optical cardiogram gated 2D color flow imaging at 1000 fps and 4D in vivo visualization of embryonic heart at 45 fps on a swept source OCT system,”
Opt. Express, 15
(4), 1627
–1638
(2007). http://dx.doi.org/10.1364/OE.15.001627 Google Scholar
A. Liu et al.,
“Efficient postacquisition synchronization of 4-D nongated cardiac images obtained from optical coherence tomography: application to 4-D reconstruction of the chick embryonic heart,”
J. Biomed. Opt., 14
(4), 044020
(2009). http://dx.doi.org/10.1117/1.3184462 Google Scholar
I. V. Larina et al.,
“Sequential turning acquisition and reconstruction (STAR) method for four-dimensional imaging of cyclically moving structures,”
Biomed. Opt. Express, 3
(3), 650
–660
(2012). http://dx.doi.org/10.1364/BOE.3.000650 Google Scholar
J. Yoo et al.,
“Increasing the field-of-view of dynamic cardiac OCT via post-acquisition mosaicing without affecting frame-rate or spatial resolution,”
Biomed. Opt. Express, 2
(9), 2614
–2622
(2011). http://dx.doi.org/10.1364/BOE.2.002614 Google Scholar
S. Bhat et al.,
“4D reconstruction of the beating embryonic heart from two orthogonal sets of parallel optical coherence tomography slice-sequences,”
IEEE Trans. Med. Imaging, 32
(3), 578
–588
(2013). http://dx.doi.org/10.1109/TMI.2012.2231692 Google Scholar
D. C. Adler, R. Huber and J. G. Fujimoto,
“Phase-sensitive optical coherence tomography at up to 370, 000 lines per second using buffered Fourier domain mode-locked lasers,”
Opt. Lett., 32
(6), 626
–628
(2007). http://dx.doi.org/10.1364/OL.32.000626 Google Scholar
R. Huber, D. C. Adler and J. G. Fujimoto,
“Buffered Fourier domain mode locking: unidirectional swept laser sources for optical coherence tomography imaging at 370, 000 lines/s,”
Opt. Lett., 31
(20), 2975
–2977
(2006). http://dx.doi.org/10.1364/OL.31.002975 Google Scholar
M. W. Jenkins et al.,
“Ultrahigh-speed optical coherence tomography imaging and visualization of the embryonic avian heart using a buffered Fourier domain mode locked laser,”
Opt. Express, 15
(10), 6251
–6267
(2007). http://dx.doi.org/10.1364/OE.15.006251 Google Scholar
M. Gargesha et al.,
“High temporal resolution OCT using image-based retrospective gating,”
Opt. Express, 17
(13), 10786
–10799
(2009). http://dx.doi.org/10.1364/OE.17.010786 Google Scholar
M. Liebling et al.,
“Four-dimensional cardiac imaging in living embryos via postacquisition synchronization of nongated slice sequences,”
J. Biomed. Opt., 10
(5), 054001
(2005). http://dx.doi.org/10.1117/1.2061567 Google Scholar
M. W. Jenkins et al.,
“Measuring hemodynamics in the developing heart tube with four-dimensional gated Doppler optical coherence tomography,”
J. Biomed. Opt., 15
(6), 066022
(2010). http://dx.doi.org/10.1117/1.3509382 Google Scholar
B. Garita et al.,
“Blood flow dynamics of one cardiac cycle and relationship to mechanotransduction and trabeculation during heart looping,”
Am. J. Physiol. Heart Circ. Physiol., 300
(3), H879
–H891
(2011). http://dx.doi.org/10.1152/ajpheart.00433.2010 Google Scholar
S. Gu et al.,
“Optical coherence tomography captures rapid hemodynamic responses to acute hypoxia in the cardiovascular system of early embryos,”
Dev. Dyn., 241
(3), 534
–544
(2012). http://dx.doi.org/10.1002/dvdy.23727 Google Scholar
M. W. Jenkins et al.,
“Optical pacing of the embryonic heart,”
Nat. Photonics, 4
(9), 623
–626
(2010). http://dx.doi.org/10.1038/nphoton.2010.166 Google Scholar
L. M. Peterson et al.,
“Altering embryonic cardiac dynamics with optical pacing,”
in Annual Int. Conf. of the IEEE Engineering in Medicine and Biology Society,
1382
–1385
(2012). http://dx.doi.org/10.1109/EMBC.2012.6346196 Google Scholar
A. Alex et al.,
“Optogenetic pacing in Drosophila melanogaster,”
Sci. Adv., 1
(9), e1500639
(2015). http://dx.doi.org/10.1126/sciadv.1500639 Google Scholar
S. Bhat et al.,
“Multiple-cardiac-cycle noise reduction in dynamic optical coherence tomography of the embryonic heart and vasculature,”
Opt. Lett., 34
(23), 3704
–3706
(2009). http://dx.doi.org/10.1364/OL.34.003704 Google Scholar
S. Wang et al.,
“Direct four-dimensional structural and functional imaging of cardiovascular dynamics in mouse embryos with 1.5 MHz optical coherence tomography,”
Opt. Lett., 40
(20), 4791
–4794
(2015). http://dx.doi.org/10.1364/OL.40.004791 Google Scholar
G. Karunamuni et al.,
“Using optical coherence tomography to rapidly phenotype and quantify congenital heart defects associated with prenatal alcohol exposure,”
Dev. Dyn., 244
(4), 607
–618
(2015). http://dx.doi.org/10.1002/dvdy.v244.4 Google Scholar
G. Karunamuni et al.,
“Ethanol exposure alters early cardiac function in the looping heart: a mechanism for congenital heart defects?,”
Am. J. Physiol. Heart Circ. Physiol., 306
(3), H414
–H421
(2014). http://dx.doi.org/10.1152/ajpheart.00600.2013 Google Scholar
C. Wu et al.,
“Rotational imaging optical coherence tomography for full-body mouse embryonic imaging,”
J. Biomed. Opt., 21
(2), 026002
(2016). http://dx.doi.org/10.1117/1.JBO.21.2.026002 JBOPFO 1083-3668 Google Scholar
J. E. Ellington,
“The bovine oviduct and its role in reproduction: a review of the literature,”
Cornell Vet., 81
(3), 313
–328
(1991). Google Scholar
C. A. Stewart and R. R. Behringer,
“Mouse oviduct development,”
Results Probl. Cell Differ., 55 247
–262
(2012). http://dx.doi.org/10.1007/978-3-642-30406-4 Google Scholar
H. Wang and S. K. Dey,
“Roadmap to embryo implantation: clues from mouse models,”
Nat. Rev. Genet., 7
(3), 185
–199
(2006). http://dx.doi.org/10.1038/nrg1808 Google Scholar
M. M. Matzuk and D. J. Lamb,
“The biology of infertility: research advances and clinical challenges,”
Nat. Med., 14
(11), 1197
–1213
(2008). http://dx.doi.org/10.1038/nm.f.1895 Google Scholar
S. S. Suarez,
“Sperm transport and motility in the mouse oviduct: observations in situ,”
Biol. Reprod., 36
(1), 203
–210
(1987). http://dx.doi.org/10.1095/biolreprod36.1.203 Google Scholar
S. Kolle, S. Reese and W. Kummer,
“New aspects of gamete transport, fertilization, and embryonic development in the oviduct gained by means of live cell imaging,”
Theriogenology, 73
(6), 786
–795
(2010). http://dx.doi.org/10.1016/j.theriogenology.2009.11.002 THGNBO 0093-691X Google Scholar
D. Shi et al.,
“Celsr1 is required for the generation of polarity at multiple levels of the mouse oviduct,”
Development, 141
(23), 4558
–4568
(2014). http://dx.doi.org/10.1242/dev.115659 Google Scholar
M. Komatsu and H. Fujita,
“Electron-microscopic studies on the development and aging of the oviduct epithelium of mice,”
Anat. Embryol., 152
(3), 243
–259
(1978). http://dx.doi.org/10.1007/BF00350523 Google Scholar
J. M. Herrmann et al.,
“Two- and three-dimensional high-resolution imaging of the human oviduct with optical coherence tomography,”
Fertil. Steril., 70
(1), 155
–158
(1998). http://dx.doi.org/10.1016/S0015-0282(98)00097-1 Google Scholar
J. L. Fine et al.,
“Direct scanning of pathology specimens using spectral domain optical coherence tomography: a pilot study,”
Ophthalmic Surg. Lasers Imaging, 41
(6), S58
–S64
(2010). http://dx.doi.org/10.3928/15428877-20101031-05 Google Scholar
S. A. Boppart et al.,
“High resolution imaging of endometriosis and ovarian carcinoma with optical coherence tomography: feasibility for laparoscopic-based imaging,”
BJOG: Int. J. Obstet. Gynaecol., 106
(10), 1071
–1077
(1999). http://dx.doi.org/10.1111/bjo.1999.106.issue-10 Google Scholar
M. Trottmann et al.,
“Ex vivo investigations on the potential of optical coherence tomography (OCT) as a diagnostic tool for reproductive medicine in a bovine model,”
J. Biophotonics, 9
(1–2), 129
–137
(2016). http://dx.doi.org/10.1002/jbio.201500009 Google Scholar
J. C. Burton et al.,
“High-resolution three-dimensional in vivo imaging of mouse oviduct using optical coherence tomography,”
Biomed. Opt. Express, 6
(7), 2713
–2723
(2015). http://dx.doi.org/10.1364/BOE.6.002713 Google Scholar
S. Wang et al.,
“In vivo micro-scale tomography of ciliary behavior in the mammalian oviduct,”
Sci. Rep., 5 1
–11
(2015). http://dx.doi.org/10.1038/srep13216 Google Scholar
BiographyRaksha Raghunathan received her undergraduate engineering degree in electronics and communication engineering from Anna University, India, in 2013. Currently, a part of the Biomedical Optics Lab, she is pursuing her PhD in biomedical engineering at the University of Houston. Her research interests include understanding the process of embryonic development and the effects of different environmental factors on it, using noninvasive imaging methods. Manmohan Singh received his BS degree in BME from the University of Houston in 2014 and is currently pursuing his PhD in the same department. Since the fall of 2010, he has been with Dr. Kirill Larin’s Biomedical Optics Laboratory. His research interests include utilizing biomedical imaging for the detection and monitoring of diseases and utilizing and developing new elastographic methods for investigating the biomechanical properties of tissues. Mary E. Dickinson received an MA, MS, and PhD in biological sciences from Columbia University in 1996. She is a Kyle and Josephine Morrow Professor of Molecular Physiology and Biophysics at Baylor College of Medicine. She is the academic director of the optical imaging and vital microscopy core. Her work focuses on the development of 3-D and 4-D imaging methods to define genetic and biomechanical mechanisms underlying malformations associated with congenital birth defects. Kirill V. Larin is a professor of biomedical engineering at the University of Houston. He received his MS in laser physics and mathematics from Saratov State University (1995) and a PhD in biomedical engineering from the University of Texas Medical Branch in Galveston (2002). He has published more than 100 papers in the field of biomedical optics and biophotonics. He is inducted as Fellow of SPIE (2015) and OSA (2016). |