
|
|
1.IntroductionUpconverting nanoparticles (UCNP) are emerging as an interesting tool for bioimaging, assays, and theranostic applications.1,2 Their ability to convert infrared light to shorter wavelengths results in improved contrast and imaging depth compared with traditional fluorescent dyes and quantum dots.3 Notably, imaging with UCNP does not suffer from sample autofluorescence since the anti-Stokes luminescence mechanism of UCNP is not effective in biological materials.4 Other attractive features of UCNP are their low toxicity5 and unsurpassed resistance to photobleaching, enabling long-term and continuous observation.6 Unlike other multiphoton dyes, which require costly short-pulsed lasers, UCNP can be excited by continuous-wave laser diodes. Although the properties of UCNP are best exploited in deep tissue in vivo imaging and diagnosis, in vitro UCNP imaging is also of interest, as studies of UCNP interactions at the cellular level are needed for understanding their behavior in organisms. Despite their advantages, use of UCNP in biology and biotechnology is still limited mostly to laboratories developing these nanoparticles. One obstacle for wider adoption of UCNP comes from the fact that common biological microscopes are not equipped with a light source suitable for UCNP excitation, and, to our knowledge, there is no readily available microscope for UCNP imaging besides expensive multiphoton confocal setups. Thus, potential UCNP users have to seek a custom solution or build the UCNP imaging setup themselves. Although imaging of UCNP-labeled samples is now regularly reported in the literature, descriptions of the illumination setup are usually too brief. Many reports on bioimaging with UCNP employ confocal microscopy setups.7–11 Adapting a confocal microscope for UCNP imaging is straightforward, in principle, as it requires just a free laser port in the confocal head and an optical path adjusted for near-infrared (NIR) wavelengths. This is fulfilled in some commercial multiphoton-ready setups, where the pulsed NIR laser can also be used directly as an excitation source.12 The considerable price of such a setup is not the only limitation of confocal UCNP imaging. Laser pulses shorter than a few milliseconds are not efficient for UCNP excitation despite their high peak intensity. The UCNP excitation mechanism relies on intermediate states with long lifetimes; therefore, the quantum yield of UCNP luminescence is very low at the beginning of the pulse. Liu et al.13 have shown that the optimal pulse length for UCNP imaging is about 50 ms. As the ultrashort pulsed lasers are designed to induce two-photon fluorescence in organic dyes, there might be significant autofluorescence in biological samples; thus, time gating should be used to distinguish it from UCNP luminescence. Upconverting nanoparticles are also not suited for fast scanning, since their excited state lifetimes extend into the micro- or even millisecond range. Fast scanning can, therefore, result in poor signal or smearing in the direction of scanning.14 To avoid this, prolonged dwell times are needed. Deconvolution algorithms,15 nondescanned detection,16 or line-scanning17 can solve the problem of signal smearing and speed up UCNP confocal imaging considerably. Widefield luminescence imaging seems to be better suited for routine UCNP observation,18 as the slow luminescence kinetics of UCNP is not an issue here. Widefield setup is also considerably cheaper than confocal systems, as common biological microscopes can be adapted for this modality.19 The nonlinear nature of UCNP luminescence can be exploited to achieve a certain level of optical sectioning if the excitation power is kept below the saturation limit, as was first demonstrated in vivo by van Veggel’s group.20,21 Koehler reflected light illumination is often employed in widefield UCNP imaging due to its simple implementation. A laser beam is introduced through the back port of the microscope and focused on the rear focal plane of the objective.6 The most detailed widefield UCNP imaging setup description so far was published by Nadort et al.22 The authors used modified Koehler illumination for a quantitative study of single UCNP luminescence. The same setup was also used in a study of UCNP skin penetration23 and cellular uptake.24 These reports, however, do not present profiles of the illumination on the sample. Though the Koehler illumination is regarded as uniform, there can in fact be about a 10% to 20% falloff in intensity toward the edges.25 Improvement of illumination homogeneity is possible by using the central part of the profile only, but this wastes a significant amount of source power. In case of UCNP, power transmission becomes an issue, especially at smaller magnifications, as achieving convenient excitation intensities would necessitate a high-power laser. Since the luminescence intensity of UCNP typically scales with the second power of the excitation intensity, homogeneous illumination of the sample is even more important in the case of UCNP than with fluorescent dyes. Improvement over Koehler illumination can be achieved with Koehler integrators, e.g., with refractive elements such as microlens arrays (MLA). Coumans et al.25 described adaptation of an epifluorescence microscope where tandem MLA replaces the original optics, giving a top-hat illumination profile on the sample with a mercury short-arc lamp. Using a laser with MLA requires additional devices such as a rotating diffuser or vibrating multimode fiber to reduce speckles and diffraction artifacts caused by beam coherence; otherwise, discrete points are obtained instead of a homogeneous profile.26 Although top-hat laser illumination is well studied due to its importance in lithography, machining, and projection displays,27 there are only a few reports on using it for bioimaging.28 Here, we present a widefield laser illuminator allowing convenient imaging of samples labeled by upconverting nanoparticles. Our illuminator is combined with the epifluorescence attachment of the microscope so that the UCNP luminescence and fluorescence images of the same area can be easily overlaid. We demonstrate the capability of our illuminator for in vitro imaging on a Nikon E400 microscope. As an example, uptake of UCNP encapsulated in oleyl-hyaluronan micelles into breast cancer cells is evaluated for bare micelles and for micelles bearing a targeting peptide. 2.Materials and Methods2.1.Evaluation of Illumination Profile with UCNP PhantomNanocrystals of capped with oleic acid were synthesized through a thermal decomposition of corresponding rare-earth oleates; details of the synthesis are described in our previous work.29 An aliquot of chloroform colloid of purified UCNP was then mixed with polyvinylpyrrolidone (PVP) with molecular weight of 2 MDa. The particle to PVP weight ratio was 1:3. A drop of the mixture was then cast on a clean microscope slide and spread into thin layer by pressing the coverslip on top of it immediately. The illumination profile in the sample plane was evaluated by imaging the UCNP phantom slide with the microscope camera. For evaluation purposes, the size of the top-hat profile was adjusted to bring the profile edges into the camera field of view. Intensity profiles and standard mean deviation of intensity () were then evaluated in the FiJi software.30 The homogeneity of the illumination is described by the coefficient of variation (CV) calculated according to , where is the mean intensity in the defined area. 2.2.Modification of UCNP with Oleyl-Hyaluronan and Breast Cancer Targeting PeptideFor the purpose of the in vitro uptake study, synthesized UCNP were encapsulated into micelles of oleyl-hyaluronan bearing breast cancer targeting peptide. A linear dodecapeptide sequence () designed by Mathews et al.31 was prepared by a solid-phase peptide synthesis on Wang resin using -(9-fluorenyl) methoxycarbonyl (Fmoc) chemistry. Sodium hyaluronate with molecular weight 18 kDa was first oxidized to a polyaldehyde derivative.32 Amphiphilic oleyl-hyaluronan derivative with aldehyde reactive groups was then synthesized by esterification of oxidized HA via mixed anhydride chemistry.33 Breast cancer targeting peptide was attached to oleyl-hyaluronan polyaldehyde via reductive amination. Purified peptide (65 mg, 1 mol. eq. to aldehyde) was dissolved in DMSO/water solution (25% v/v, 3 mL) at ambient temperature and then slowly diluted with water (9 mL). Subsequently, oleyl-hyaluronan aldehyde (300 mg, 0.75 mmol; 6% mol. of aldehyde groups) dissolved in water (18 mL) was added to the peptide solution. The reaction mixture was stirred at ambient temperature for 2 h, then 2-picoline borane complex (25 mg, 5 mol. eq. to aldehyde) in isopropanol (0.5 mL) was added to the reaction to reduce the Schiff base. The reaction mixture was stirred for an additional 48 h. The product was purified by dialysis against water (Slide-A-Lyzer dialysis cassette, MWCO 3 kDa) and then freeze-dried. Finally, water-soluble micelles were prepared by combining peptide-bearing oleyl-hyaluronan derivative with UCNP-OA (mean diameter 25 nm) by the procedure described previously.29 Micelles without peptide were also prepared as a control. 2.3.Evaluation of UCNP Uptake by Breast Cancer CellsHuman breast adenocarcinoma cell line (MDA-MB 231) was purchased from ATCC (Manassas) and cultured in RPMI-1640 medium supplemented with 10% fetal bovine serum (FBS). Cells were maintained at 37°C in a humidified atmosphere containing 5% . Cells were seeded into 8-well imaging chambers (Miltenyi Biotec, Germany). After 24 h, cells were treated with UCNP incorporated in oleyl-hyaluronan micelles bearing targeting peptide (, diluted in the culture medium) and further cultured for 6 h. UCNP loaded micelles without peptide were used as a control group. To study competitive inhibition of receptor-mediated internalization of the peptide-bearing oleyl-hyaluronan micelles, some MDA-MB 231 cells were preincubated with free peptide (, ) for 1 h. The medium was then discarded and the cells were rinsed with 0.1 M PBS, pH 7 (). Cells were fixed with 4% formaldehyde for 15 min, then stained in DiffQuick solution II for 30 s with subsequent counterstaining in DiffQuick solution I for another 30 s, resulting in pink cytoplasm and blue nuclei. After staining, slides were rinsed with deionized water, air-dried, and mounted with Mowiol. Slides were imaged on a Nikon E400 using the Plan Apo objective. All images were captured using the same laser intensity () and exposure settings of the camera (600 ms, gain , no binning, resolution , 12-bit depth). After background subtraction, the UCNP luminescence channel was merged with bright-field image of the cells in FiJi to help with assignment of luminescence signals to individual cells. Cell boundaries were drawn by freehand region-of-interest tool, and intensity of luminescence signal inside the cell was integrated. Histograms were constructed from 150 individual measurements. 2.4.Combined UCNP and Fluorescence Dye ImagingFluorescent imaging of UCNP-labeled samples was demonstrated with normal human dermal fibroblasts (NHDF) isolated from facial skin removed during cosmetic plastic surgery with the informed agreement of the donors. NHDF were obtained from dermis by the digestion method and were cultured in Dulbecco’s modified Eagle’s medium (DMEM) supplemented with 10% FBS. After incubation with hyaluronan-coated UCNP, the cells were fixed with ice-cold methanol, stained with Hoechst 33258, and mounted with cover slips using ProLong® Antifade mountant (Life Technologies). For nuclear and cytoskeletal staining, cells were fixed and permeabilized with 3% formaldehyde with 0.2% Triton X-100 for 10 min at room temperature. Fixation was repeated with 3% formaldehyde for 5 min, followed by PBS rinse. Actin was stained with fluorescein isothiocyanate (FITC) conjugated phalloidin (Sigma) in 0.02% Triton X-100 in PBS for 90 min in the dark at room temperature. Nuclei were labeled with Hoechst for the last 10 min of phalloidin staining, and slides were afterward washed 3 times in 0.02% Triton X-100 for 15 min protected against the light. Dry slides were mounted with ProLong® Gold. 3.Instrumentation3.1.Generating Top-Hat Laser Profile with Tandem Microlens ArraysOur illuminator is based on a laser beam homogenizer using two MLA and a rotating diffuser, discussed in detail by Voelkel and Weible26 [Fig. 1(a)]. A collimated laser beam enters a telescope with a rotating diffuser placed near the focal point. Behind the telescope, the recollimated beam passes through tandem MLA. The MLA need to be precisely aligned by placing the first array in a rotation mount and the second in an XY translation mount. The MLA split the incident beam into beamlets, which are then superimposed at the focus of the Fourier lens (microscope objective in our case). A square top-hat illumination profile is created in the objective’s focal plane if the incident beam is symmetrical around the optical axis. The size of the top-hat profile in the case of two identical MLA with pitch and focal length is given by26 where is focal length of the Fourier lens and is the separation of the MLA.Fig. 1(a) General scheme of laser beam homogenization by tandem microlens arrays. Adapted from Voelkel and Weible.26 (b) Scheme of our illuminator and its adaptation to Nikon E400 microscope. Initial telescope with a diffusor is the same as shown in (a). A second telescope (lenses L3 and L4) is added behind the microlens. This telescope projects the image of the microlens to the objective rear aperture. (c) Detail of the filter cube slider. Cubes for fluorescence (FL-1 and FL-2) are left in their original positions. The cube for UCNP luminescence is mounted perpendicularly to allow entrance of the laser from the side. (d) Photo of the illuminator mounted on the Nikon E400 microscope with removed covers. Mounting of the filter cube for UCNP luminescence to the filter slider is shown as well as the telescope lens L4 attached to the cube. (e) Adaptation of the illuminator to the Nikon Ti-E epifluorescence attachment. Here, the parts painted in gray are from the original attachment and the black parts are modifications.  The best illumination quality is obtained when the second MLA is placed in the focus of the first one (). However, in a microscope, the minimal attainable distance between the MLA and the objective could reach several decimeters. Such a large distance will compromise illumination homogeneity as well as power transmission. Additional optical elements are therefore needed to control the illumination profile, as will be described below. 3.2.Design of Widefield Laser Illuminator for MicroscopesOur adaptation of the MLA beam homogenizer for use with Nikon E400 and Ti-E microscopes is shown in Figs. 1(b)–1(e). Our goal was to combine the laser illumination with the original fluorescence illuminators of the microscopes without making irreversible changes to microscope parts. The main design constraints follow from the size of the microscope objective rear aperture and its distance from the MLA. The beam has to fit in the aperture, which is only 5 mm in diameter on some objectives. Ideally, the MLA would be placed near the objective back focal plane, but the minimal possible distance is much larger due to the microscope construction (over 40 cm on Nikon Ti-E). While we found that the top-hat profile quality could be still acceptable at MLA-to-objective distances up to , distortion of the profile was observed when the beam was clipped by the objective aperture due to beam divergence. We therefore placed an additional telescope between the MLA and objective [Fig. 1(b)]. This telescope projects the image of the second MLA to the objective rear aperture. The microscope objective serves as a Fourier lens, creating a square top-hat illumination pattern on the sample. Microscope objectives can be changed without further adjustments to the illuminator, as the top-hat size scales with the objective magnification. The signal from the sample is then collected by the same objective and sent to the camera or binoculars through a barrier filter, which blocks the scattered laser. The top-hat size can be adjusted by setting the magnification of the second telescope. This is advantageous since stock MLA can be purchased instead of custom ones with parameters selected according to the camera field of view. We note that even with a perfectly matched MLA, we would still use the telescope (with magnification) to control the beam divergence. 3.3.Epifluorescence Microscopes and Illuminator Optomechanical PartsWe assembled the illuminator to fit (a) a Nikon E400 microscope with a Y-FL epifluorescence attachment and (b) a more recent Nikon Ti-E inverted biological microscope with a TI-FL epifluorescence attachment. Both microscopes appear to have built-in heat filters in their epifluorescence light path, since their light transmission falls rapidly after 800 nm and is about 1% only at 980 nm. It is, therefore, not possible to simply replace their arc-lamps with NIR lasers. Both microscopes were equipped with Nikon Ds-Qi1 cameras (12 bit). The illuminator was assembled from Thorlabs (Munich, Germany) cage system parts and fitted with Thorlabs NIR-coated achromats or aspheres and laser mirrors from Edmund Optics (EO; York, UK). We used the EO shortpass dichroic filter (850-nm edge, #69-221) and shortpass emission filter (850-nm edge, #64-334) in the microscope filter cube for UCNP luminescence. Such a filter set does not hinder transmitted light observation, as its band-pass covers the region from 400 to 850 nm. The diffusor (” ground glass, 120 grit) is glued to the axle of a small motor placed in a cage plate. The speed of the motor can be varied up to about 1500 rpm to allow sufficient averaging of individual speckle patterns even for short exposure times (). A pigtailed laser diode from Thorlabs (PL980P330J, 975 nm, single-mode fiber, optical power variable up to 330 mW) or a diode laser from Roithner Lasertechnik (RLTMDL-980-2W, 980 nm, optical power variable up to 2 W) was used as an illumination source. A longpass filter with a 950-nm edge (EO #66-238) was used to clean the laser diode emission. 3.4.Microlens SelectionWe required the top-hat profile to fill the entire field of view of the camera, which is for our Nikon E400 and at the Nikon Ti-E when using the objective. For the best results, the top-hat profile should be slightly larger, since its edges will be blurred due to beam divergence and diffraction artifacts might be present near the edges. Thanks to the additional telescope behind the MLA, we could select from stock MLA and adjust the top-hat size by setting the magnification of the telescope. The top-hat size on the sample will then become . It is safer to select MLA with smaller than needed and use , as the beam diameter in the objective rear aperture will be reduced by compared with the beam size at the MLA. Another important consideration is the Fresnel number (FN) of the MLA where is the laser wavelength. The top-hat profile will be modulated by diffraction artifacts, which will become severe at low FN. There is, however, a limit for the maximum attainable FN, since the beam has to fit into the aperture where is the number of microlenses in a square array filled by a beam with diameter . Typically, is considered sufficient for beam homogenization. We have selected an MLA with 0.5-mm pitch and 6.5-mm radius of curvature from Suss MicroOptics (Rouges-Terres, Switzerland), giving , which is comparable to (calculated for , , and ). To get , the dimensions of the MLA can be only, which is advantageous since the MLA prices are proportional to their area. When used directly with a objective (), the would be . Telescopes with magnification of at least and are, therefore, needed for the E400 and Ti-E camera, respectively.3.5.Attachment of the Illuminator to the Nikon E400The laser enters the microscope from the side through the filter cube port of the epifluorescence attachment [Fig. 1(b)]. This is possible thanks to placing the filter cube for the laser perpendicular to its standard position [Fig. 1(c)]. The cube width was slightly reduced on a cutter and rails were fastened to its sides to allow securing it to the slider. To shorten the illuminator as much as possible, we used the excitation filter thread on the cube for mounting the second lens of the telescope. The focal lengths of L3 and L4 are 80 and 60 mm, respectively. The cube for the laser is used also for bright-field imaging. The filter slider further accommodates two fluorescence filter cubes for arc-lamp illumination. Illuminator construction rods are secured in a cage plate screwed to an L-shaped board stacked on top of the epifluorescence attachment [Fig 1(d)]. While this design of the illuminator attachment is usable only for the Nikon E400, it has the advantages of compact form and low cost. The illuminator parts are easily accessible for alignment or experimenting. No original accessory is modified or needs to be purchased except the filter cube. 3.6.Attachment of the Illuminator to the Nikon Ti-EWe merged our illuminator with the Nikon epifluorescence attachment “TI-FL” [Fig. 1(e)]. The middle part of the TI-FL containing a mirror was replaced by a Thorlabs 60 mm cage cube with an adjustable platform. To switch between arc-lamp and laser illumination, the cube was equipped with a flipping mirror. We retained the final lens of the epifluorescence attachment and the field aperture in their original positions so that the arc-lamp light path was not altered. The original lens has about 90% transmission at 980 nm. As this lens is also in the laser path [L4 in Fig. 1(b)], the second telescope of the illuminator had to be designed accordingly. To shorten the illuminator, we used a combination of three achromatic lenses with focal lengths 80, , and 125 mm together with the built-in lens with to achieve the desired magnification of about while projecting the MLA image at the rear aperture of the objective. This variant of the illuminator attachment is more general but still requires some custom machining. The Ti-E microscope has an option for adding another level of optical accessory (the so-called stratum structure). With this second level, our illuminator would use an independent port to which it could be mounted via simple Thorlabs adapter. A similar solution is likely possible for other commercial microscopes with infinity-corrected optics. 4.Results and Discussion4.1.Illumination QualityThe illuminator provides a nearly smooth top-hat profile even with the rough input beam of the high-power laser diode. The intensity map of the profile captured with the Plan Fluor objective at laser intensity is shown in Fig. 2. The size of the profile was adjusted to make the edges visible; for imaging, the profile was expanded so that the flat part fills the field of view. Illumination in the central area shown in Fig. 2(a) has a very low CV value of 2.0%; the intensity profile along the line drawn in Fig. 2(a) has [Fig. 2(b)]. This result is comparable with the CV value reported by Coumans et al.25 for an arc-lamp on a Nikon E400 microscope () and with the result of Scholtens et al.28 for an MLA homogenizer on an imaging cytometer with 491 nm laser (). Importantly, the CV value is nearly identical for all tested objectives from to and also for phase contrast objectives ( and Plan Fluor) without any adjustment of the illuminator. This is another advantage over Koehler illumination, where the source image should fill the objective rear aperture, whose diameter varies from about 5 to 15 mm at Nikon CFI objectives. Fig. 2(a) Illumination intensity profile measured with the UCNP thin layer phantom using plan fluor objective at laser intensity . A color look-up table (LUT) is used to highlight slight intensity variations. Area with is indicated by a rectangle. (b) Profile of illumination intensity along the horizontal line drawn in (a). Edges of the rectangular area in (a) are indicated by dashed lines. The CV of the line profile in between the dashed lines is 1.4%.  We initially observed diffraction effects in the profile originating from the relatively low FN of our MLA. These artifacts can be smoothed out by increasing beam divergence after the diffusor until the subapertures of the second MLA are slightly overfilled (this produces four “ghost” images of the top-hat profile at the sides of the central profile). Further improvement of the profile was observed after bringing the MLA slightly closer than their focal length. We measured that the illuminator transmits 50% of the initial laser beam power to the objective rear aperture plane in the case of E400 and 42% in the case of Ti-E. The biggest power losses occur at the diffusor and uncoated MLA; the Ti-E further contains a built-in lens L4 coated for visible wavelengths. Typical transmission of the Nikon CFI objectives at 980 nm is about 70%, but only 55% was measured for the Plan Fluor. The part of the illumination profile with contains about 35% of the total transmitted power in the sample plane. This means that intensity on the sample is about with a 330-mW laser diode and objective when the central part of the profile is magnified to fill the camera field of view. This value might already be practical for imaging, depending on the quantum yield of the UCNP used, their concentration, and camera sensitivity. With our variant of UCNP (monodisperse core-only particles with 25-nm diameter), we found that laser intensity of about allowed convenient observation of labeled cells through the binoculars (we note that appropriate laser safety goggles should be worn at all times to avoid possible laser reflections, even though the image in binoculars itself is free from laser scatter when correct filters are used). 4.2.UCNP Phantoms for MicroscopyThe UCNP in the PVP matrix yielded highly homogeneous phantoms. Slight granularity becomes visible only at the highest magnifications. The best results were obtained when mixing chloroform particle colloids with PVP, while an aqueous mixture of PVP and bare UCNP (with oleic acid removed by HCl treatment) produced more granular phantoms. We also tested Sylgard 184 elastomer for phantom production, but in this case, the particles precipitated into fine aggregates, making the phantom unsuitable for microscopy. However, transparent blocks obtained by casting Sylgard 184 diluted with silicone oil into acrylic cuvettes are useful for spectroscopy and NIR laser beam visualization. To obtain phantoms with maximum particle concentration, we drop-casted particle colloid onto glass and let it evaporate slowly. Thanks to their narrow size distribution, the particles self-assembled into a regular hexagonal superlattice. While it was possible to find large areas with a defined number of particle monolayers, the lattice developed cracks, which would complicate CV evaluation. For adjustment purposes, such phantoms are superior due to their brightness. We initially projected the profile onto a camera sensor, but this was possible with objectives up to only due to limited working distance. More importantly, the camera method suffers from problematic focusing. It is also necessary to use filters to reduce laser intensity at the sensor, as operating the laser diode below its threshold current to reduce its power would effectively produce an incoherent LED source and the profile would not reveal laser artifacts. Therefore, we evaluated the illumination profile indirectly from UCNP signal intensity by imaging a thin phantom with evenly spread UCNP particles. This method was practical for all objective magnifications. The measured profile shape and CV value also reflect the illumination power dependence of the UCNP luminescence and thus provide direct assessment of the actual particles used for experiments. The CV value could be slightly increased by phantom imperfections. 4.3.Breast Cancer Cell UCNP UptakeA detailed synthesis of UCNP and their following incorporation into amphiphilic HA derivatives were reported elsewhere.29 Electron microscopy and dynamic light scattering (DLS) were used to characterize size and morphology of UCNP incorporated into oleyl-hyaluronan micelles bearing targeting peptide. Dry-state STEM revealed UCNP clusters within polymer particles of oleyl-hyaluronan derivative with diameter [Fig. 3(a)]. The hydrodynamic diameter, expressed as Z-average size, was found to be [Fig. 3(b)]. The reason TEM size of the micelles is smaller than that measured by DLS is that DLS measures the hydrodynamic diameters with polymer chains extending into the aqueous solution, while STEM reflects the diameter of dried micelles. Fig. 3(a) Scanning electron microscopy image of peptide-bearing oleyl-hyaluronan micelles. Image taken on FEI Magellan 400 microscope with detector for transmitted electrons. The inset displays higher-magnification image of the same sample (). Micelle samples were negatively stained using 0.5% phosphotungstic acid. (b) Hydrodynamic size distributions of bare (red) and peptide-bearing UCNP loaded micelles (green), dispersed in water at a concentration of . Data from Malvern Zetasizer ZS Nano (25°C, 173°scattering angle).  Uptake of the UCNP loaded oleyl-hyaluronan micelles into MDA-MB 231 cancer cells was assessed from the widefield images of UCNP cellular luminescence (Fig. 4). The distribution of UCNP in the cells is a log-normal. The respective values of mean and standard deviation are for bare micelles and for peptide-bearing micelles. Uptake of peptide-bearing micelles was therefore significantly ( times) greater than that of bare micelles. Since the hydrodynamic sizes of both micelle variants are comparable [Fig. 3(b)], we can conclude that the increased uptake is an effect of the peptide. Fig. 4Uptake of UCNP into MDA-MB 231 breast cancer cells evaluated for oleyl-hyaluronan micelles (a) with targeting peptide, (b) without peptide, and for micelles (c) with peptide where the cells were pretreated with peptide to block their receptors. Upper row shows overlays of bright-field images with UCNP luminescence (). UCNP signal intensity is expressed by “spectrum” LUT as defined in FiJi. This LUT emphasizes weak signals and is used to make the visual comparison easier. The graph displays UCNP uptake distributions calculated from 150 cells for each curve. Insets show the same data in the form of individual histograms fitted with normal distributions. 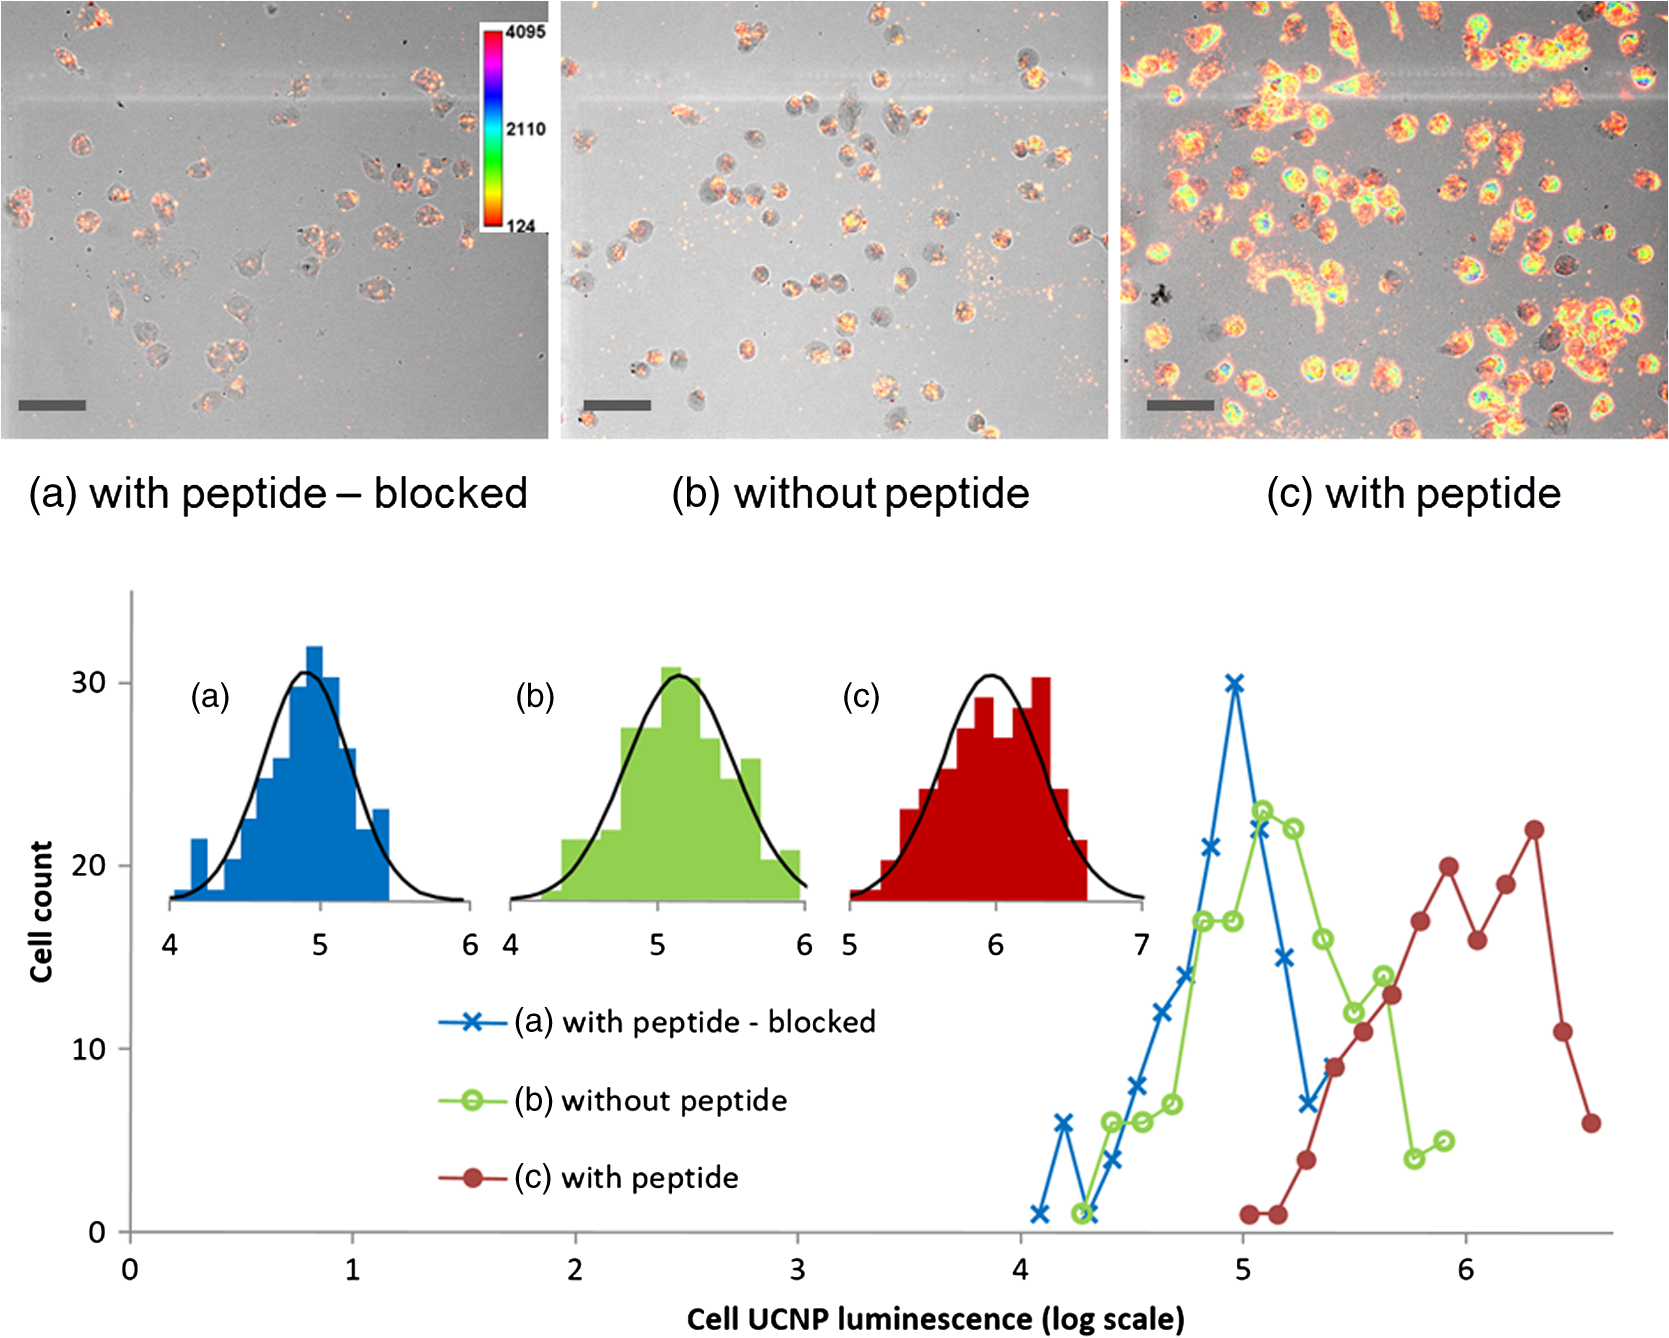 To determine the contribution of peptide receptor binding to cellular uptake, the cells were treated with free peptide (in molar excess to peptide conjugated to oleyl-HA derivative) to competitively inhibit micelle engagement of the receptors. Uptake of the peptide-bearing micelles dropped by 90% when the receptors were blocked (the corresponding peak is ) and was comparable with bare micelles. 4.4.Combined Fluorescence and UCNP Luminescence ImagingExamples of widefield images of cells labeled simultaneously by UCNP and fluorescence dyes or histological DiffQuick stain are shown in Fig. 5. Thanks to the integration of our illuminator with the epifluorescence attachment, switching between UCNP, fluorescence, and bright-field was straightforward. Another advantage of top-hat illumination is that objectives can be swapped without any further adjustments. The possibility of observing UCNP luminescence through binoculars is beneficial for routine screening of the samples. In our experience, with cellular samples, the UCNP imaging was practical starting from the objective. At smaller magnifications, the exposure time can reach many tens of seconds or the camera gain has to be increased and binning used. The presence of the UCNP in the sample did not interfere with the staining protocols we used. Fig. 5(a)–(c) Examples of combined imaging of NHDF cells incubated with UCNP (green channel) and stained with fluorescent dyes (nuclei—Hoechst 33258, blue channel; cytoskeleton—FITC conjugated phalloidin, red channel). (a) Imaged with objective, . (b) The same sample imaged by oil immersion objective, . (c) FITC and Hoechst stained sample imaged by objective; . (d) MDA-MB 231 breast cancer cells stained by DiffQuick, overlay of bright-field and UCNP channel. The UCNP luminescence intensity is color-coded with “spectrum” LUT as defined in FiJi. Imaged by objective, . 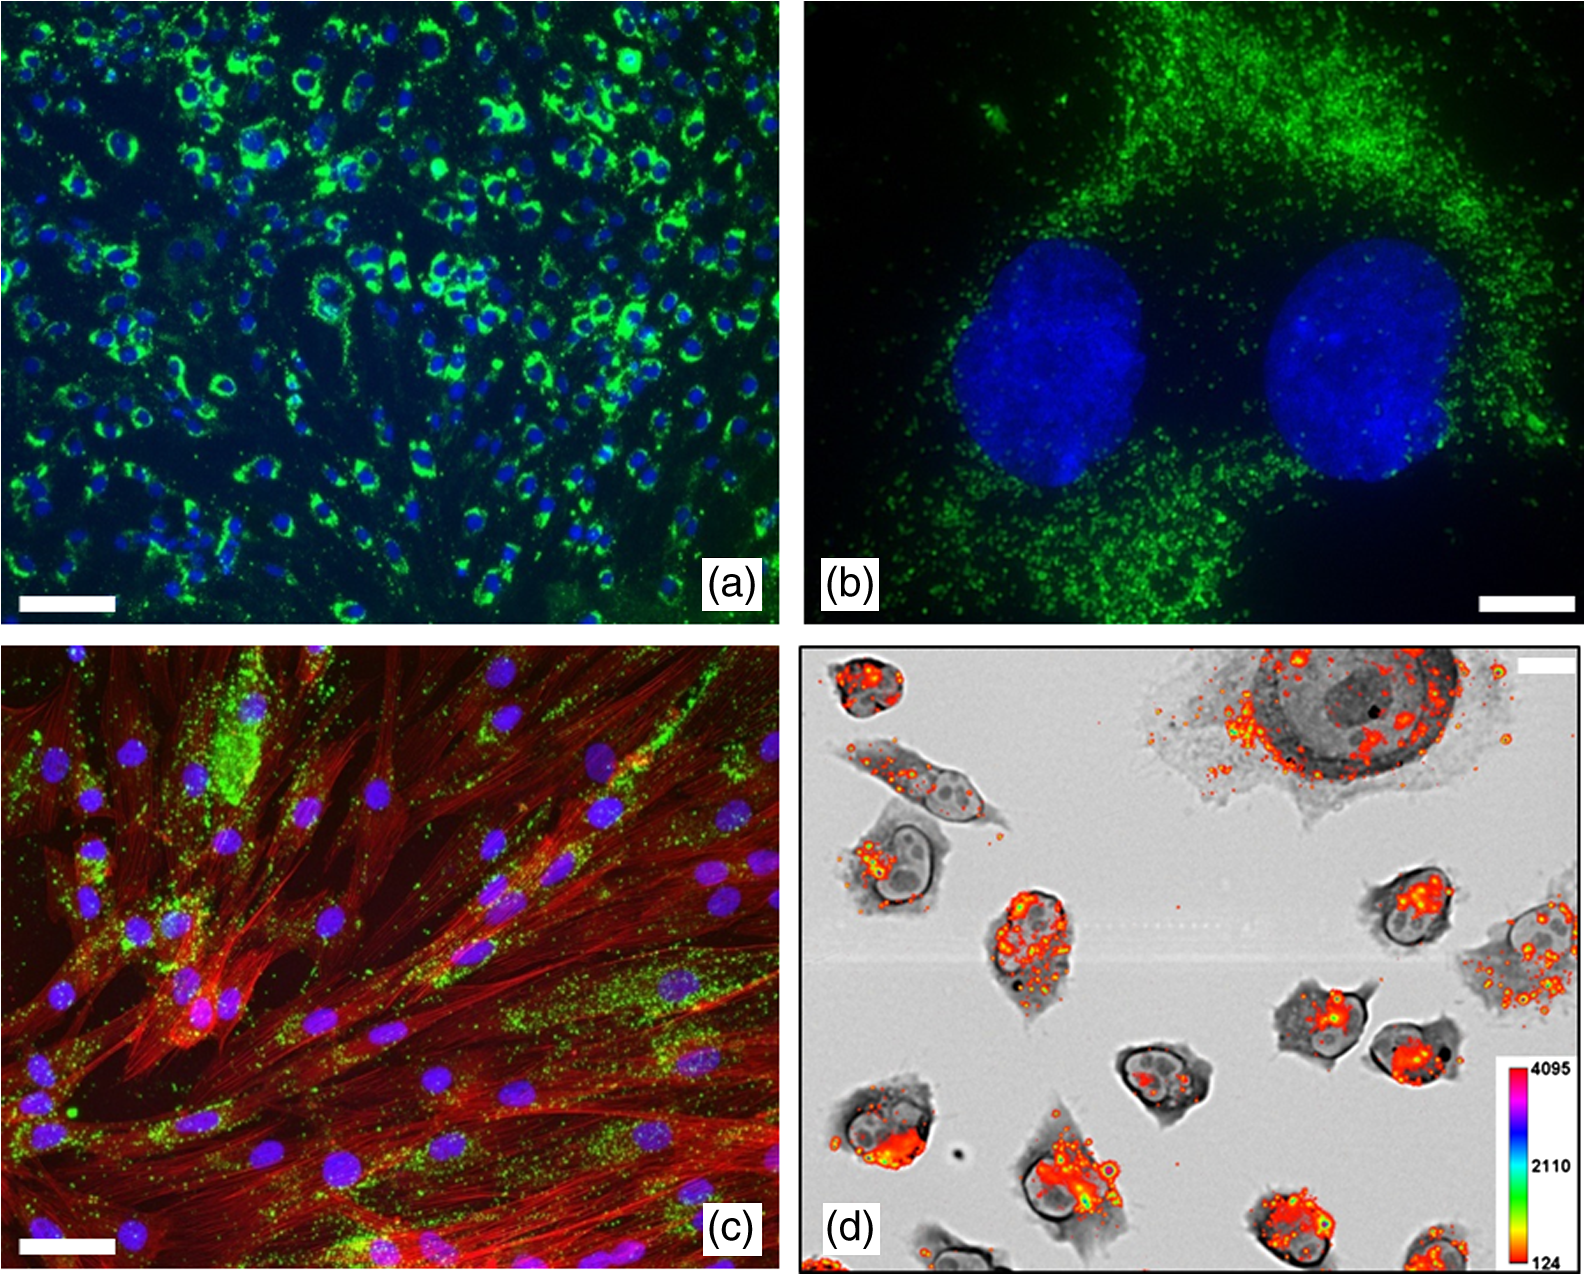 5.ConclusionsWe have demonstrated a practical laser illuminator for widefield imaging of samples with upconverting nanoparticles on common biological microscopes. The illuminator produces highly homogeneous top-hat illumination pattern with coefficient of variation about 2% for a wide range of objectives. Thanks to the telescope placed after the microlens arrays, illumination quality and power transmission are not compromised even at large distances between microlens and microscope objective, and the profile dimensions can be adjusted. Integration with epifluorescence attachments allows easy switching between UCNP and fluorescence imaging. The illuminator is designed specifically to fit a Nikon E400 or Ti-E, but a similar design can be adapted for many other models of infinity-corrected microscopes. We have successfully attached breast cancer targeting peptide to oleyl-hyaluronan micelles and proved their enhanced receptor-mediated uptake by MDA-MB 231 cells in vitro. The highly homogeneous illumination allows reliable mapping of UCNP distributions within the sample. ReferencesD. Yang et al.,
“Current advances in lanthanide ion (Ln3+)-based upconversion nanomaterials for drug delivery,”
Chem. Soc. Rev., 44
(6), 1416
–1448
(2015). http://dx.doi.org/10.1039/C4CS00155A CSRVBR 0306-0012 Google Scholar
W. Zheng et al.,
“Lanthanide-doped upconversion nano-bioprobes: electronic structures, optical properties, and biodetection,”
Chem. Soc. Rev., 44
(6), 1379
–1415
(2015). http://dx.doi.org/10.1039/C4CS00178H CSRVBR 0306-0012 Google Scholar
O. S. Wolfbeis,
“An overview of nanoparticles commonly used in fluorescent bioimaging,”
Chem. Soc. Rev., 44
(14), 4743
–4768
(2015). http://dx.doi.org/10.1039/C4CS00392F CSRVBR 0306-0012 Google Scholar
F. Auzel,
“Upconversion and anti-stokes processes with f and d ions in solids,”
Chem. Rev., 104
(1), 139
–174
(2004). http://dx.doi.org/10.1021/cr020357g CHREAY 0009-2665 Google Scholar
A. Gnach et al.,
“Upconverting nanoparticles: assessing the toxicity,”
Chem. Soc. Rev., 44
(6), 1561
–1584
(2015). http://dx.doi.org/10.1039/C4CS00177J CSRVBR 0306-0012 Google Scholar
S. H. Nam et al.,
“Long‐term real‐time tracking of lanthanide ion doped upconverting nanoparticles in living cells,”
Angew. Chem. Int. Ed., 50
(27), 6093
–6097
(2011). http://dx.doi.org/10.1002/anie.201007979 Google Scholar
D. Chatteriee, A. Rufalhah and Y. Zhang,
“Upconversion fluorescence imaging of cells and small animals using lanthanide doped nanocrystals,”
Biomaterials, 29
(7), 937
–943
(2008). http://dx.doi.org/10.1016/j.biomaterials.2007.10.051 BIMADU 0142-9612 Google Scholar
L. Xiong et al.,
“High contrast upconversion luminescence targeted imaging in vivo using peptide-labeled nanophosphors,”
Anal. Chem., 81
(21), 8687
–8694
(2009). http://dx.doi.org/10.1021/ac901960d ANCHAM 0003-2700 Google Scholar
C. Wang et al.,
“Towards whole-body imaging at the single cell level using ultra-sensitive stem cell labeling with oligo-arginine modified upconversion nanoparticles,”
Biomaterials, 33
(19), 4872
–4881
(2012). http://dx.doi.org/10.1016/j.biomaterials.2012.03.047 BIMADU 0142-9612 Google Scholar
Q. Liu et al.,
“Upconversion luminescence imaging of cells and small animals,”
Nat. Protoc., 8
(10), 2033
–2044
(2013). http://dx.doi.org/10.1038/nprot.2013.114 1754-2189 Google Scholar
J. Xiang et al.,
“Antigen-loaded upconversion nanoparticles for dendritic cell stimulation, tracking, and vaccination in dendritic cell-based immunotherapy,”
ACS Nano, 9
(6), 6401
–6411
(2015). http://dx.doi.org/10.1021/acsnano.5b02014 ANCAC3 1936-0851 Google Scholar
K. Welsher and H. Yang,
“Multi-resolution 3D visualization of the early stages of cellular uptake of peptide-coated nanoparticles,”
Nat. Nanotechnol., 9
(3), 198
–203
(2014). http://dx.doi.org/10.1038/nnano.2014.12 NNAABX 1748-3387 Google Scholar
H. Liu et al.,
“Deep tissue optical imaging of upconverting nanoparticles enabled by exploiting higher intrinsic quantum yield through use of millisecond single pulse excitation with high peak power,”
Nanoscale, 5
(20), 10034
–10040
(2013). http://dx.doi.org/10.1039/C3NR01917A nanohl 2040-3364 Google Scholar
M. Yu et al.,
“Laser scanning up-conversion luminescence microscopy for imaging cells labeled with rare-earth nanophosphors,”
Anal. Chem., 81
(3), 930
–935
(2009). http://dx.doi.org/10.1021/ac802072d ANCHAM 0003-2700 Google Scholar
C. F. Gainer, U. Utzinger and M. Romanowski,
“Scanning two-photon microscopy with upconverting lanthanide nanoparticles via Richardson–Lucy deconvolution,”
J. Biomed. Opt., 17
(7), 076003
(2012). http://dx.doi.org/10.1117/1.JBO.17.7.076003 JBOPFO 1083-3668 Google Scholar
X. Xiao et al.,
“Cell assay using a two-photon-excited europium chelate,”
Biomed. Opt. Express, 2
(8), 2255
–2264
(2011). http://dx.doi.org/10.1364/BOE.2.002255 BOEICL 2156-7085 Google Scholar
L. M. Higgins et al.,
“Line-scanning confocal microscopy for high-resolution imaging of upconverting rare-earth-based contrast agents,”
J. Biomed. Opt., 20
(11), 110506
(2015). http://dx.doi.org/10.1117/1.JBO.20.11.110506 JBOPFO 1083-3668 Google Scholar
Y. I. Park et al.,
“Upconverting nanoparticles: a versatile platform for wide-field two-photon microscopy and multi-modal in vivo imaging,”
Chem. Soc. Rev., 44
(6), 1302
–1317
(2015). http://dx.doi.org/10.1039/C4CS00173G CSRVBR 0306-0012 Google Scholar
P. A. Ma et al.,
“Rational design of multifunctional upconversion nanocrystals/polymer nanocomposites for cisplatin (IV) delivery and biomedical imaging,”
Adv. Mater., 25
(35), 4898
–4905
(2013). http://dx.doi.org/10.1002/adma.201301713 ADVMEW 0935-9648 Google Scholar
J. Pichaandi et al.,
“Two-photon upconversion laser (scanning and wide-field) microscopy using Ln3+-doped NaYF4 upconverting nanocrystals: a critical evaluation of their performance and potential in bioimaging,”
J. Phys. Chem. C, 115
(39), 19054
–19064
(2011). http://dx.doi.org/10.1021/jp206345j JPCCCK 1932-7447 Google Scholar
F. C. J. M. van Veggel et al.,
“Ln3+-doped nanoparticles for upconversion and magnetic resonance imaging: some critical notes on recent progress and some aspects to be considered,”
Nanoscale, 4
(23), 7309
(2012). http://dx.doi.org/10.1039/c2nr32124f NANOHL 2040-3364 Google Scholar
A. Nadort et al.,
“Quantitative imaging of single upconversion nanoparticles in biological tissue,”
PLoS One, 8
(5), e63292
(2013). http://dx.doi.org/10.1371/journal.pone.0063292 POLNCL 1932-6203 Google Scholar
Z. Song et al.,
“Background free imaging of upconversion nanoparticle distribution in human skin,”
J. Biomed. Opt., 18
(6), 061215
(2012). http://dx.doi.org/10.1117/1.JBO.18.6.061215 JBOPFO 1083-3668 Google Scholar
A. E. Guller et al.,
“Cytotoxicity and non-specific cellular uptake of bare and surface-modified upconversion nanoparticles in human skin cells,”
Nano Res., 8
(5), 1546
–1562
(2015). http://dx.doi.org/10.1007/s12274-014-0641-6 1998-0124 Google Scholar
F. A. W. Coumans, E. van der Pol and L. W. M. M. Terstappen,
“Flat-top illumination profile in an epifluorescence microscope by dual microlens arrays,”
Cytometry A, 81A
(4), 324
–331
(2012). http://dx.doi.org/10.1002/cyto.a.22029 Google Scholar
R. Voelkel and K. J. Weible,
“Laser beam homogenizing: limitations and constraints,”
Proc. SPIE, 7102 71020J
(2008). http://dx.doi.org/10.1117/12.799400 PSISDG 0277-786X Google Scholar
F. M. Dickey and S. C. Holswade, Laser Beam Shaping: Theory and Techniques, CRC Press, Boca Raton, Florida
(2000). Google Scholar
T. M. Scholtens et al.,
“CellTracks TDI: an image cytometer for cell characterization,”
Cytometry A, 79A
(3), 203
–213
(2011). http://dx.doi.org/10.1002/cyto.a.21024 Google Scholar
M. Pospisilova et al.,
“Oleyl-hyaluronan micelles loaded with upconverting nanoparticles for bio-imaging,”
J. Nanopart. Res., 17
(9), 1
–11
(2015). http://dx.doi.org/10.1007/s11051-015-3186-z JNARFA 1388-0764 Google Scholar
J. Schindelin et al.,
“Fiji: an open-source platform for biological-image analysis,”
Nat. Methods, 9
(7), 676
–682
(2012). http://dx.doi.org/10.1038/nmeth.2019 1548-7091 Google Scholar
A. S. Mathews et al.,
“Peptide modified polymeric micelles specific for breast cancer cells,”
Bioconjugate Chem., 24
(4), 560
–570
(2013). http://dx.doi.org/10.1021/bc3004364 BCCHES 1043-1802 Google Scholar
P. Šedová et al.,
“Preparation of hyaluronan polyaldehyde-a precursor of biopolymer conjugates,”
Carbohydr. Res., 371 8
–15
(2013). http://dx.doi.org/10.1016/j.carres.2013.01.025 CRBRAT 0008-6215 Google Scholar
G. Huerta-Angeles et al.,
“Novel synthetic method for the preparation of amphiphilic hyaluronan by means of aliphatic aromatic anhydrides,”
Carbohydr. Polym., 111 883
–891
(2014). http://dx.doi.org/10.1016/j.carbpol.2014.05.035 CAPOD8 0144-8617 Google Scholar
|


