|
|
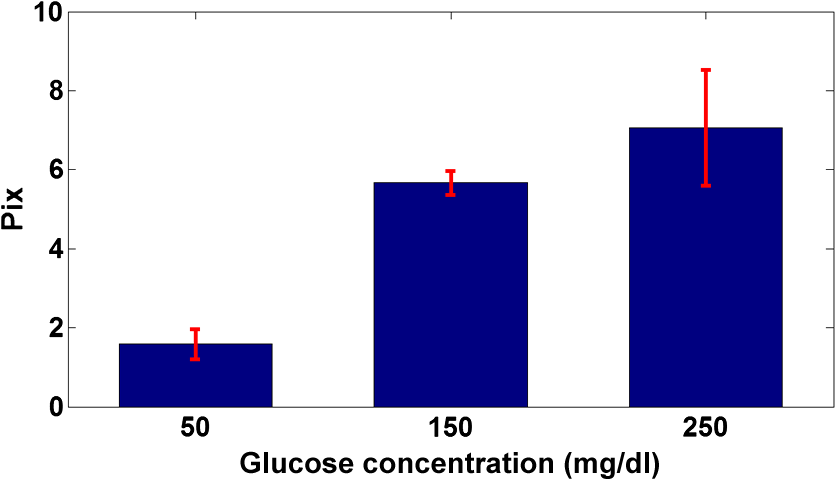
1.IntroductionDiabetes mellitus is a metabolic disease, which results in high glucose concentration in the blood. In type I diabetes, the pancreas does not produce enough insulin. This condition is referred to as “insulin-dependent diabetes mellitus” or “juvenile diabetes.” In type II diabetes, the cells do not respond to the insulin that is produced. Type II, which is often called “noninsulin-dependent diabetes mellitus” or “adult-onset diabetes,” is strongly related to the modern life style.1 More than 95% of all diabetic patients have type II, which affects 25.8 million people of all ages in the United States (8.3% of the U.S. population). Worldwide, 347 million people suffer from diabetes.2 Diabetic patients must continuously monitor their blood glucose level in order to avoid the most harmful effects of the disease. Currently, the most common way to measure glucose is by pricking a finger and applying the blood droplet to a strip. The blood sample is inserted into a glucometer and the flux of the glucose reaction generates an electrical signal. This electrical signal is converted to glucose concentration in a blood readout. There are still many challenges related to the achievement of reliable glycemic monitoring, despite the impressive advances in glucose biosensors. Therefore, one of the most important goals of medicine is the development of a noninvasive method to measure glucose concentration in the blood. During the past 15 years, noninvasive methods such as optical coherence tomography (OCT), time-resolved and spatial-resolved modalities were presented. One method is measuring the intensity and the energy of backscattered light while femtosecond laser pulses illuminate a layer with different glucose concentrations.3 The energy is measured with a fiber detector. It was shown that the pulse energy linearly depends on the glucose concentration, especially by using detectors with large numerical aperture. Another method analyzes the time of flight (TOF) with different glucose concentrations in scattering media.4 This technique is based on pulse broadening, as well as on time delay of the pulse maximum relatively to the initial pulse. Slight changes of these two parameters as a function of glucose concentration were revealed while laser pulses with FWHM of 30 ps were used. Spectral and refractive index measurements as a function of blood glucose and glycated proteins level were also presented.5 The refractive index measurements were based on Abbe refractometer with high precision. The spectral results show the indirect effect of hemoglobin near-infrared absorbance as a function of the glucose concentration in blood. During the last 15 years, OCT methods6,7 for detecting glucose concentration were also presented. One method6 presents a measurement of the OCT signal slope as a function of the glucose concentration; the other7 compares TOF and OCT techniques. The study proves that the TOF technique is more sensitive with respect to OCT. The sensitivity of TOF is much higher with intralipid (IL) solution due to longer path lengths. The proposed technology offers a means of meeting that goal. The rotation of linearly polarized light passing through a material medium while applying a magnetic field is called the Faraday effect.8,9 The left and right waves propagate at different velocities and cause circular birefringence due to the magnetic field. Speckle field is generated due to backscattered light from a rough surface.10 There are several effects that can change the speckle field such as temporal skin movement, a very useful effect for biomedical monitoring.11–17 Another effect is the change in the incident wavefront caused by the change in the polarization state. This change will also lead to changes in the speckle pattern. Therefore, a change in the polarization state of the incident wavefront by different concentrations of glucose produces a change in the detected speckle field. The transmittance and the reflectance of the incident beam depend upon the angle of incidence; thus, the complex amplitude of the reflected light from the illuminated spot changes with polarization and hence changes the resulting speckle field. Recently, a method for the detection of very small rotations using the change of the speckle field was developed.18 Recent research demonstrated a temporal variation caused by the change in temporal skin vibration profile together with the change in the magnetic medium that is generated over time.19 The innovation presented in this paper is the alternating current (ac) magnetic field, which increased the observability of the relatively small magneto-optic effect in addition to other proven effects. 2.Materials and Methods2.1.Glucose Verdet ConstantThe polarization rotation angle for the light beam propagating through magneto-optic materials is where is the Verdet constant, is the magnetic field, is the interaction length, is the optical wavelength, and is the difference in index of refraction between two circularly polarized states leading to the rotation. Verdet constant20 is defined as where is the angular rotation, is the length path through the substance, is the intensity of the magnetic field, and is the angle between the magnetic field and the path of the light. The molecular magnetic rotary power of glucose relative to water is where is the molecular weight, is the Verdet constant, and is the molecular density.15 The molecular weight of water and glucose is 180.1559 and , respectively. The molecular density of glucose and water is 1540 and , respectively. The Verdet constant of water is ·Tesla. According to Eq. (3), at a wavelength of 589.3 nm and a temperature of 20°C, the Verdet constant of glucose is ·Tesla.2.2.Speckle Changes Due to the Magnetic FieldAs shown in Fig. 1, the sensor consists of a continuous-wave, collimated and focused laser (laser diode, Thorlabs, CPS532-C2) with 0.9 mW power with a beam size of . Note that the system is classified as laser safety class 2, which is considered very safe for skin exposure (). The frame rate of the first configuration (high-concentration test) is 1020 Hz, while the frame rate of the second configuration (low-concentration test) is 525 Hz. The image size is . The beam was passed along the axis of the solenoid while different magnetic fields were applied. The magnetic field was measured with DC/AC Gaussmeter (AlphaLab, GM2). The sample (a glucose substance) was inserted into the solenoid. Different glucose concentrations were used in this experiment as the magneto-optic medium. Three different levels of magnetic fields were applied as a function of the injected current (1, 2, and 3 A). In order to examine the magnet effect while the magneto-optic medium material is glucose substance, we applied three different dc magnetic fields per each trail. During this experiment, the glucose concentration was 0.2% (). First, a series of reference speckle patterns (without any magnetic field) were recorded for 60 s at 2 Hz frame rate (fps). When the magnetic field was applied, the plane of polarization of the beam rotated. A correlation coefficient between the current frame and the reference frame, for each of these videos, was computed and was time-averaged. Figure 2 shows the difference between the correlation coefficients of different magnetic fields that were applied. In order to examine the effect, a square wave of magnetic field was applied to prove that the Faraday effect changes the speckle pattern. In order to isolate the pattern change, each frame was normalized as follows: Fig. 2Change in time-averaged speckle correlation coefficient versus the change in the strength of the applied current. 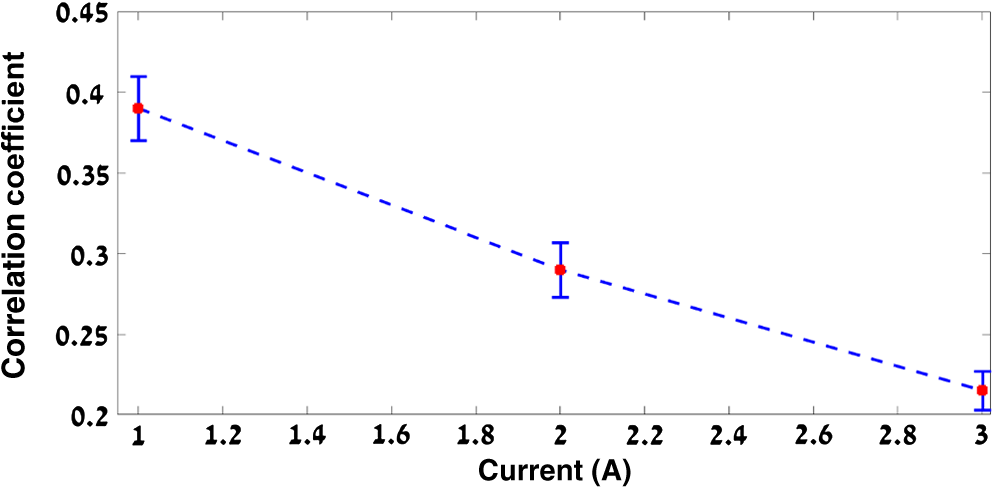 Figure 3 shows that there is a change of the intensity as well as a change of the value of the correlation peak, where the intensity value rose and the normalized correlation peak fell. One can see in Fig. 3, three different magnetic field change indicators: (1) the intensity change of the image, (2) the speckle pattern correlation coefficient temporal change, and (3) the maximum peak location of the temporal correlation between one speckle pattern and the next. The correlation coefficient was normalized due to the energy of the image. The goal is to prove that the change of the magnetic field, while polarized light passes through a glucose solution, results in the change of the speckle pattern. In addition, change of the wave front due to change of the polarization angle will affect the intensity. However, the intensity parameter can also be affected by extraneous factors such as changes of external illumination conditions, whereas normalized correlation coefficient will not be affected by such changes. The main reason for calculating the correlation coefficients is that the reflected light complex amplitude changes with polarization and hence changes the resulting speckle field. Change in the magnetic medium that is generated by time-varied glucose concentration caused temporal changes of the speckle field, which is evaluated by the correlation coefficient of the speckle images row data. 3.Results3.1.High-Concentration TestDuring the following test, a C-core magnet was used (Fig. 4) in order to avoid mechanical and acoustic noises. The measured magnetic field was 100 G (G = Gauss) at 77 Hz. Initially, in order to prove the presented effect, high concentrations of glucose were tested: 10%, 3%, 1%, and 0.25%. Each sample also included 3% of IL. A pipette was used to prepare each sample in order to insert the precise (0.15%) quantity of the solution such that the experimentally measured effects will indeed indicate the change in the glucose concentration and not an inaccurate variation of the amount of water in the examined tube. Fig. 4(a) The optical configuration using a C-core magnet and (b) the frequency (spectral) response, while the applied magnetic excitation frequency was 77 Hz.  In order to enhance the effect, an ac magnetic field was applied. After extracting the speckle pattern in each frame, the correlation was calculated, revealing a change in the two-dimensional (2-D) position of the correlation peak and in the value of the peak as a function of time. The algorithm is primarily based upon correlation between the images of the speckle patterns in temporally adjacent frames and the movement in the position and the value of the obtained correlation peak. During the following test, we examined the frequency response at 77 Hz (the ac magnet frequency) of the correlation peak position. One can see in Fig. 4(b) the optical frequency response of a solution containing 3% concentration of glucose with 3% concentration of IL applied to a magnetic field at a frequency of 77 Hz. 3.2.Low-Concentration TestIn order to detect lower concentrations of glucose, a system was constructed to apply high magnetic fields [Fig. 6(a)]. The presented system is stable with high current; hence, at 77 Hz, the maximum magnetic field was 700 G. The first test examined the difference between glucose concentration and glucose concentration. The sample contained of fluid for each of the medium. Two sets of experiments were conducted. Each set presents different samples of water and of glucose. Each experiment was repeated three times. Each time, the sample was extracted from the equipment and a new sample formulated and inserted so as to validate replicability and measurement consistency. Figure 6(b) compares the spectral response measured at the excitation frequency between water and a solution with glucose concentration of . Note that Figs. 6, 7, and 8 show other configurations with other parameters such as focus, distance, and magnetic field strength. The distance and the focus change the sensitivity of the camera to the speckle pattern movement. Therefore, the peak as well as the noise level changed with respect to Fig. 5. The noise level is considered very low (), as shown in Fig. 6(c). Figure 6(c) shows the spectral response of Fig. 6(b) with respect to water. During the last experimental step (Fig. 7), solutions of 50, 150, and were analyzed. Again, each trial was repeated three times, with a different solution in the same concentration. Figure 7 shows the difference in the spectral response at the excitation frequency with respect to the changes in the glucose concentration. The bars around each measured value indicate the standard deviation (STD) of the performed measurement. Fig. 5The frequency response at the excitation frequency as a function of the glucose concentration. 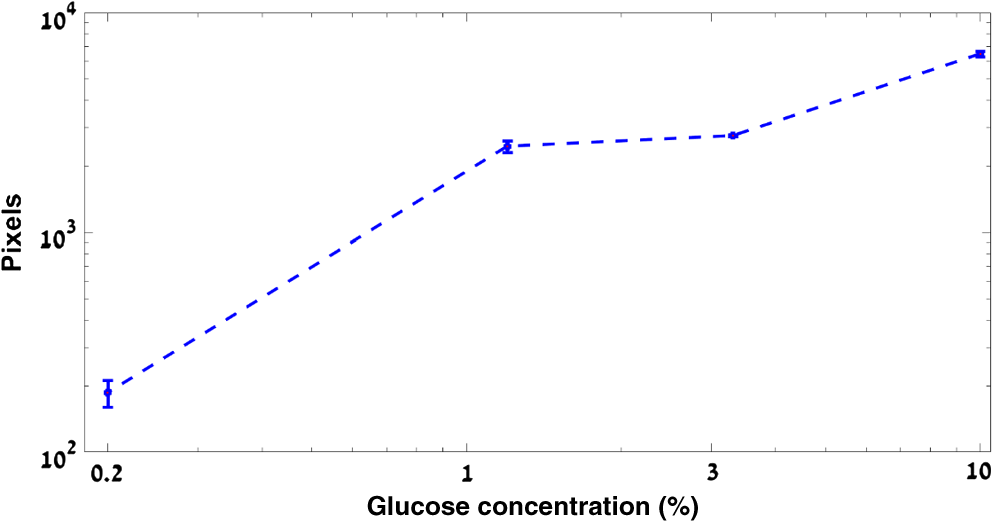 Fig. 6(a) The optical configuration for the low glucose concentration measurement, (b) the second set of glucose concentration frequency response with respect to water frequency response, and (c) the frequency (spectral) response, while the applied magnetic excitation frequency was 77 Hz.  In the next step, samples of of fluid, containing 1% IL and different concentrations of glucose were examined (concentrations of 0%, 0.1%, 0.2%, and 0.25%). Figure 8 shows the variation in spectral response at those levels of glucose concentration. As before, the bars around each measured value indicate the STD of the performed measurement. 4.DiscussionIn Fig. 6, the STDs of the water measurement compared to the solution are 0.05 and 0.1 pix, respectively. These values are considered low due to the fact the STD values are of the mean value. In Fig. 7, the STDs of 50, 100, and solutions are 0.09, 0.77, and 2.69 pix, respectively. The STDs of 50 and are 5.2% and 11.2% of the mean value. The STD of is considerably higher (while the mean value is higher than lower concentrations); therefore, in order to enhance the effect, samples of of fluid, containing 1% IL and different concentrations of glucose were examined. The STDs of water, 50, 100, and , are 0.1, 0.5, 0.5, and 3 pix, respectively. The STD values are 1%, 4.7%, 2.3%, and 11.5% of the mean values. One can see that the maximum deviation in this case is of the mean value. Note that the deviations are caused by acoustical noise. This noise will be compensated for during the next phase of the research in the near future. In Ref. 19, a method for remote detection of glucose concentration in blood was presented. This technique is based on two effects: (1) tracking of temporal changes of reflected secondary speckles produced when the wrist was illuminated by a laser beam and (2) change in the magnetic medium that is generated by time-varied glucose concentration. Reference 19 was based on the rotation of linearly polarized light caused by applying a dc magnetic field. The approach is based on analyzing the optical cardiogram (OCG), which is the change in the 2-D position of the peak versus time. The OCG is affected by the viscosity of blood, which changes with the glucose concentration, as well as by the change of the magnetic medium that is generated by time-varied glucose concentration. Despite the good results in comparison to conventional reference measurements, there are a few disadvantages to such a method, which can be eliminated using the method presented in this paper. The specificity can be improved due to the difference of the spectral response at the excitation frequency between different materials while an external ac magnetic field is applied. The OCG amplitude can also be affected by other biomedical parameters, such as blood pressure, alcohol consumption, and dehydration level. The change of the linear rotation angle will be affected only by the Verdet constant of the examined material. Sensitivity can also be improved with the presented method due to the lock-in amplification role of the ac magnetic field. The final goal is to develop a device that will combine both the approach of Ref. 19 and the approach presented in this paper. The novelties presented in this paper are as follows: (1) measuring the frequency response of the magnetic field directly, in contrast to Ref. 19 where the field affects the OCG graph; (2) the specificity, due to the Verdet constant of glucose; and (3) lock-in amplification effect when an ac magnetic field is applied and the frequency response at the excitation is analyzed. This amplification increases the observability of the relatively small magneto-optic effect. IL was used in order to mimic the scattering properties of biological tissue of 532 nm. Furthermore, IL increases the scattering, which causes longer path lengths of detected photons. Longer path lengths increase the change of the polarized angle and, therefore, the correlation coefficient value. One can see in Fig. 8 (glucose concentration with 1% IL) higher sensitivity of the STD with respect to Fig. 7 (without IL). 5.ConclusionsThis paper presents the first steps toward developing a module for detection of glucose concentration using the Faraday effect with an ac magnetic field. Developing a practical sensor will involve a number of technological challenges. The main challenge is to add a mechanical and acoustic cancelation mechanism since acoustic and mechanical noises are currently evident during the measurements while the ac magnetic field is applied. Several methods can enhance the measurement resolution such as an acoustic cage or using a rotating magnetic field for the locking amplifier method. A more robust, generic, and automatic calibration process that will translate the optical readout into the exact value of the estimated biomedical parameter is also required. The glucose test showed the feasibility of detecting high as well as low glucose concentrations with a maximal ac magnetic field of 700 G. References
“Classification and diagnosis of diabetes mellitus and other categories of glucose intolerance,”
Diabetes, 28 1039
–1057
(1979). http://dx.doi.org/10.2337/diab.28.12.1039 DIAEAZ 0012-1797 Google Scholar
G. Danaei et al.,
“National, regional, and global trends in fasting plasma glucose and diabetes prevalence since 1980,”
Lancet, 378 31
–40
(2011). http://dx.doi.org/10.1016/S0140-6736(11)60679-X LANCAO 0140-6736 Google Scholar
A. P. Popov, A. V. Priezzhev and R. Myllyla,
“Effect of glucose concentration in a model light-scattering suspension on propagation of ultrashort laser pulses,”
Quantum Electron., 35
(11), 1075
–1078
(2005). http://dx.doi.org/10.1070/QE2005v035n11ABEH012794 QUELEZ 1063-7818 Google Scholar
M. T. Kinnunen et al.,
“Measurements of glucose content in scattering media with time of flight technique: comparison with Monte Carlo simulations,”
Proc. SPIE, 5474 181
–191
(2004). http://dx.doi.org/10.1117/12.578897 PSISDG 0277-786X Google Scholar
O. S. Zhernovaya, V. V. Tuchin and I. V. Meglinski,
“Monitoring of blood proteins glycation by refractive index and spectral measurements,”
Laser Phys. Lett., 5
(6), 460
–464
(2008). http://dx.doi.org/10.1002/lapl.200810007 1612-2011 Google Scholar
K. V. Larin et al.,
“Specificity of noninvasive blood glucose sensing using optical coherence tomography technique: a pilot study,”
Phys. Med. Biol., 48 1371
–1390
(2003). http://dx.doi.org/10.1088/0031-9155/48/10/310 PHMBA7 0031-9155 Google Scholar
A. Popov et al.,
“Glucose sensing in flowing blood and intralipid by laser pulse time-of-flight and optical coherence tomography techniques,”
IEEE J. Sel. Top. Quantum Electron., 18
(4), 1335
–1342
(2012). http://dx.doi.org/10.1109/JSTQE.2011.2175202 IJSQEN 1077-260X Google Scholar
M. Freiser,
“A survey of magnetooptic effects,”
IEEE Trans. Magn., 4 152
–161
(1968). http://dx.doi.org/10.1109/TMAG.1968.1066210 IEMGAQ 0018-9464 Google Scholar
E. Hecht, Optics, Addison-Wesley, Boston
(1998). Google Scholar
J. W. Goodman, Laser Speckle and Related Phenomena, Springer, Berlin, Heidelberg
(1975). Google Scholar
Z. Zalevsky et al.,
“Simultaneous remote extraction of multiple speech sources and heart beats from secondary speckles pattern,”
Opt. Express, 17 21566
–21580
(2009). http://dx.doi.org/10.1364/OE.17.021566 OPEXFF 1094-4087 Google Scholar
N. Ozana et al.,
“Demonstration of a remote optical measurement configuration that correlates with breathing, heart rate, pulse pressure, blood coagulation, and blood oxygenation,”
Proc. IEEE, 103 248
–262
(2015). http://dx.doi.org/10.1109/JPROC.2014.2385793 IEEPAD 0018-9219 Google Scholar
Y. Beiderman et al.,
“Remote estimation of blood pulse pressure via temporal tracking of reflected secondary speckles pattern,”
J. Biomed. Opt., 15 061707
(2010). http://dx.doi.org/10.1117/1.3505008 JBOPFO 1083-3668 Google Scholar
Y. Beiderman et al.,
“Recognition and identification of obscured objects,”
Opt. Commun., 283 4274
–4282
(2010). http://dx.doi.org/10.1016/j.optcom.2010.06.059 OPCOB8 0030-4018 Google Scholar
Y. Bishitz et al.,
“Noncontact optical sensor for bone fracture diagnostics,”
Biomed. Opt. Express, 6 651
–657
(2015). http://dx.doi.org/10.1364/BOE.6.000651 BOEICL 2156-7085 Google Scholar
Z. Zalevsky et al.,
“Remote and continuous monitoring of intraocular pressure using novel photonic principle,”
Invest. Ophthalmol. Vis. Sci., 53 1972
(2012). IOVSDA 0146-0404 Google Scholar
A. Shenhav et al.,
“Optical sensor for remote estimation of alcohol concentration in blood stream,”
Opt. Commun., 289 149
–157
(2013). http://dx.doi.org/10.1016/j.optcom.2012.09.079 OPCOB8 0030-4018 Google Scholar
A. Anand et al.,
“Speckle-based optical sensor for low field Faraday rotation measurement,”
IEEE Sens. J., 13 723
–727
(2013). http://dx.doi.org/10.1109/JSEN.2012.2227310 ISJEAZ 1530-437X Google Scholar
N. Ozana et al.,
“Improved noncontact optical sensor for detection of glucose concentration and indication of dehydration level,”
Biomed. Opt. Express, 5 1926
–1940
(2014). http://dx.doi.org/10.1364/BOE.5.001926 BOEICL 2156-7085 Google Scholar
E. W. Washburn, International Critical Tables of Numerical Data, Physics, Chemistry and Technology, Norwich, New York(2003). Google Scholar
|