
|
|
1.IntroductionWhen light propagates through a diffusive medium, it experiences absorption and scattering. If the scattering coefficient is considerably larger than the absorption coefficient, the medium can be regarded as diffusive, and light propagation obeys a diffusion process.1 However, diffusion is meaningful only beyond transport mean free path (TMFP). For media that are considerably shorter than the TMFP, the media are almost ballistic.2 Hence, this length scale (TMFP) is extremely important in an optical imaging system and in practice determines the upper limit beyond which no ballistic imaging of the media can be reconstructed. Penetration depths of imaging technologies, which are based on ballistic imaging, such as optical coherence tomography,3–5 are limited by this length scale. For biological tissues (of almost any kind—skin, brain, liver, and so on) that are thicker than 2 mm, the ballistic component of the light [in the visible or near-infrared (IR) regimes] is negligible.6,7 In order to investigate a thick medium, most optical imaging methods are using diffusion-based techniques, such as photon density waves and inverse-scattering solutions of the diffusion equation.8–10 Since the TMFP,11,12 which is the reciprocal of the reduced scattering coefficient, is the diffusion length scale, it was assumed that the length of the transition from the ballistic regime to the diffusive one should also be equal approximately to this length scale. However, experiments and simulations show disagreement regarding this point.13–18 The transition length scale varies from one experiment (or simulation) to the next.15–18 Recent experiments reveal that the transition length depends not only on the scattering coefficient but on the collecting angle as well. Moreover, it was shown both experimentally and theoretically that the transition occurs within a much shorter distance, which is approximately the reciprocal of the scattering coefficient (instead of the reduced scattering coefficient ).19,20 It should be stressed that the determination and classification of the transition point are not merely an academic issue. In their pioneering works, Yoo and Alfano21 have been able to differentiate between the ballistic and diffusive photons with streak camera, and with an ultrafast optical shutter, the same group created a ballistic image of a 3.5-mm thick human tissue.22 This technology was developed in different directions,15,23–33 and recently, it was demonstrated that by applying the conclusions of Refs. 19 and 20 to this technology, a ballistic image can be reconstructed even when the thickness of the medium is increased substantially.34 The mathematical model that was utilized in Ref. 19 was based on a superposition of the Beer–Lambert term, which describes the ballistic domain, and the diffusion equation solution, which describes the diffusive regime. Since, unlike the ballistic light, the diffusive one is scattered in every direction, then the latter term is multiplied by the collecting angle of the detector. As was later demonstrated experimentally,19,20 despite its simplicity, this model anticipated the transition from the ballistic regime to the diffusive one with high accuracy. This result is quite unexpected due to the following reasons: (1) the optimized model works with great accuracy even when the absorption coefficient is relatively large and (2) the model is based only on two terms (ballistic and diffusive) and ignores other types of transport, such as quasiballistic ones.35,36 The simplicity of this model is very appealing since the generic solution requires solving the radiative transfer equation,17,37,38 which is too complicated for an analytical solution. The equation can be solved numerically with a Monte Carlo (MC) simulation; however, it is time-consuming. Even faster techniques, such as the discrete ordinates and the adding–doubling methods are still computationally intensive and are, therefore, used primarily for layered, or quasi-one-dimensional (1-D), media (see, e.g., Refs. 39 and 40). Moreover, the simple analytical solution, namely Ref. 19, teaches about the main parameters that affect the transition point, which, as was shown in Ref. 34, has a practical implication in ballistic imaging, namely, imaging an object hidden in 1 cm of chicken breast. It is the object of this paper to investigate the validity of this model for different absorption values by investigating the transition from the ballistic regime to the diffusive one with much higher accuracy. To achieve the high accuracy, an MC simulation41–51 was utilized in an MATLAB computational platform. This simulation allows, except for comparison to experiment, a very flexible method to investigate the transition with the required accuracy. It should be emphasized that since the MATLAB program was written in a parallel form, the simulation time was reduced by more than two orders of magnitude. The results reveal that the model does agree with the simulations and is valid for higher absorption coefficient with a simple power-law prefactor. 2.System and its ModelThe model of the experiment is shown in Fig. 1. Since this paper is not an experimental research and the original experiment is described in details in Refs. 19 and 20, only the main points will be listed below. The light source was a laser with a wavelength 840 nm, the medium was an intralipid solution with a scattering coefficient of approximately , and varying values of absorption coefficients , 2.4, 4.8, and , which were constructed by varying the India ink concentration in the solution (as can be seen from the experimental results in the ballistic regime, the additional ink has a negligible effect on the scattering coefficient). The light source was placed near the sample, so the beam remained parallel at the entrance to the medium. Two pupils were placed on both sides of the medium to keep the beam at the same width of the detector. The pupils’ diameter was smaller than the width of the sample to keep the quasi-1-D approximation valid. In the experiment, the setup was oriented vertically (and not horizontally as in Fig. 1), so the width of the sample () can be varied by changing the solution level in the glass (see Ref. 20 for details). Fig. 1System schematic. is the slab thickness and is the distance between the slab and the detector.  Clearly, if the medium’s width is short enough, then most scattered photons would be blocked by the barrier and mainly ballistic photons would be detected. However, if the medium is wider than the transition length, the number of ballistic photons is reduced dramatically, and as a consequence, most of the detected particles experience scattering. 3.Theoretical ModelThe original model, which was developed in Ref. 19, is based on the premises that the detected radiation consists of only two terms: ballistic and diffusive. The ballistic term is governed by the Beer–Lambert’s law,14–18,37 i.e., the intensity decreases exponentially where is the incident intensity, , and are the scattering and absorption coefficients of the medium, respectively.The diffusion term is a degenerated 1-D solution of the three-dimensional diffusion equation8 (see Ref. 52 for a solution of the diffusion equation for a slab geometry). Since the light source is continuous, the stationary diffusion equation for the photon density can be utilized53 where , is the reduced scattering coefficient and is the mean cosine of a single scattering angle.17When the beam’s cross section is larger than the medium’s thickness, there is degeneracy in the transversal coordinate and the beam decays approximately exponentially in the propagation direction (). Since in the diffusion approximation the medium is isotropic, the local density is proportional to the local intensity, i.e., However, while the ballistic photons, which have survived the medium, suffer no additional losses, the diffusive ones are scattered in all directions and only a fraction eventually reach the detector. This process is shown in Fig. 2. Equation (3) is a good approximation of the diffusion equation at the end of the medium [inside the medium an additional exponentially increasing term should be introduced, i.e., ; however, since this term is multiplied by an exponentially small coefficient, i.e., , eventually, at the end of the medium, i.e., at , they both have the same exponentially decaying dependence on (for elaboration, see, e.g., Ref. 54)]. The effects of the boundary can be neglected in the model, since the attenuation due to the boundary’s reflectivity is below the experimental accuracy. If the collecting angle of the detector is , then the diffusive term should be multiplied by the factor , which in our system can be approximated by , where is the rectangular cross section of the detector (the fact that the prefactor is proportional to is consistent with the result of Ref. 55). Hence, since the model consists of both the ballistic and diffusive terms, it can be approximated by This model was shown to predict the experimental results,19,20,34 however, it was shown that there is a discrepancy of a factor of 2 to 4 in the prefactor of the diffusive term.4.Monte Carlo SimulationThe simulation algorithm was similar to Ref. 18, and its main features are presented here for completeness purposes. It should be stressed, however, that within the terminology of Refs. 5657.–58, the simulation included contributions from all types of particles, i.e., all orders of scattering. There is no distinction between multiply scattered and low-order scattered photons. To keep the Beer–Lambert’s law, the probability density of the distances between scatterings () is Similarly, in each scattering, the photon direction is determined by two angles: and .The probability density of the cosine of the elevation angle obeys the Henyey–Greenstein38,59 phase function and the probability density of the azimuthal angle obeys These three parameters can be generated randomly by generating three uniformly distributed random variables: , , and by and In Fig. 3, this process is illustrated for four consecutive scattering (in this figure, it is assumed that only the elevation angle varies between scattering).Eventually, each trajectory that hits the detector surface is multiplied by , where is the number of scattering events, to account for the absorption. By multiplying the arriving photons by their absorption attenuation, the number of simulating photons can be reduced substantially, since each particle in the simulation simulates a group of particles. It was found that 20 million such groups of particles are sufficient to simulate with good accuracy (higher than the experimental one) a range of 10 orders of magnitude (eight of which were measured). 5.Comparison Between Experiments, Simulations, and the Mathematical ModelIn Fig. 4, the MC simulation was compared to the experimental results of Ref. 19 and to the theoretical model [Eq. (4)]. Fig. 4Comparison of the MATLAB (blue circle), experiment (red crosses), and theoretical results (magenta dashed line). The scattering coefficient of the experiment, simulations, and the theoretical model is and the absorption coefficient is . The anisotropic coefficient is 0.9. The beam, the barrier, and the detector size are and the distance from the slab to the detector is 30 cm. The -axis is the slab thickness and the -axis is the relative intensity decay in logarithmic scale.  In Fig. 4, there is a good agreement between the simulation and the experimental results. However, there is a disagreement with the theoretical model. The exponential decay agrees with the theoretical model both in the ballistic regime and the diffusive one; however, there is a disagreement on the transition point, and as a consequence, there is a downward shift in the diffusive part of the plot. This discrepancy was well known in Ref. 20 but its source was unknown. In Sec. 6, we will quantify this discrepancy. 6.Introducing a Correction Prefactor to the Diffusive TermSince the discrepancy occurs at the transition, it can be corrected by an additional prefactor () on the diffusive term (since there is no change in the slope of the graph). To quantify this term, an MC simulation was carried on the same geometrical system (, , and ) but with different scattering and absorption coefficients. In every scenario (specific and ), the simulation intensity data were used to calculate the prefactor that fits the following equation: The results for three different and 13 different are presented in Table 1. In the simulation, we focused on parameters, which characterize the propagation of visible and near-IR light in biological tissues.Table 1The a prefactor for different scenarios.
In Fig. 5, the data are plotted on a single graph. The data can be fitted to a power-law where and . In particular, in Fig. 5, we show that the power-law where is an excellent approximation to the simulation data.Fig. 5The prefactor versus the absorption coefficient in a log–log plot, the scattering coefficient of the blue squares is , of the green diamonds is , and of the red circles is . The solid line stands for Eq. (12).  These results suggest an interesting conclusion that the analytical expression can be utilized even when the validity of the diffusion approximation is questionable. The prefactor allows using the model for absorption coefficient (at least) as large as . Therefore, Eq. (3) can be refined to The source of the power-law (and its exact power value ) is not clear and seems to require an extended research. Moreover, it seems reasonable that the value of should be dependent, e.g., it may be that the prefactor should have been . Alternatively, it may depend on the scattering anisotropy (see, e.g., Ref. 60), but we do not have enough data to validate that.Figures 6 and 7 present the effect of the additional prefactor . In Fig. 6, the prefactor is absent (or equal to 1), and the discrepancy is evident. On the other hand, in Fig. 7, the prefactor is present, i.e., the data are compared with Eq. (13), and the agreement is excellent. Fig. 6Simulation and theoretical results for a scattering coefficient of . The absorption coefficient of the blue circles (simulation) and blue line (theoretical) is , of the red X’s (simulation) and the red line (theoretical) is , of the green triangles (simulation) and the green line (theoretical) is , and of the pink squares (simulation) and the pink line (theoretical) is . The anisotropic coefficient is 0.9. The beam, the barrier, and the detector size are and the distance from the slab to the detector is 30 cm.  In Figs. 8 and 9, the relative error is plotted versus the sample’s width with and without the prefactor. The relative error is defined , where and are the intensities of the simulation and the model [Eq. (13)], respectively. Despite the great improvement of the prefactor, there is still some error at the transition area, which may indicate the need for a third transport term (see, e.g., Ref. 61). This discrepancy is relatively large when there is a sharp transition between the ballistic and the diffusive regimes, i.e., when the absorption is low. However, for many applications, the model’s accuracy is surprisingly good. Fig. 8The relative error between the simulation data and the model without the prefactor for the coefficients of Fig. 6.  Fig. 9The relative error between the simulation data and the model with the prefactor for the coefficients of Fig. 7. 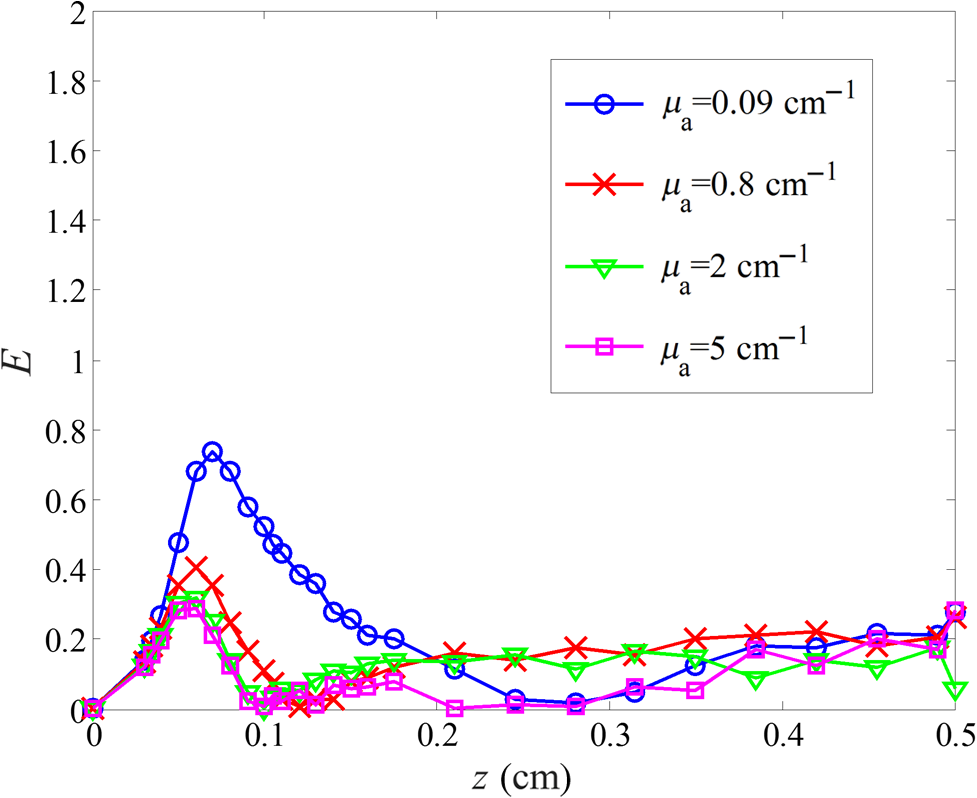 7.SummaryAn MC simulation was conducted to investigate the model presented in Refs. 19 and 20. The main purpose was to validate the premises of Ref. 19 that the transition from the ballistic to the diffusive regimes can be described with high accuracy by only two mathematical terms: ballistic and diffusive, namely . The simulation, as well as the experimental results, indicates that this is indeed a good model. Moreover, it was found that this model is valid even for relatively large absorption coefficients in which the validity of the diffusive approximation is dubious. To fix the model for larger absorption coefficients, a power-law prefactor should be added to the second term, namely , where . This prefactor teaches that the original model is valid provided the scattering coefficient is 20,000 times larger than the absorption coefficient. It should be stressed that the conclusions of the research are limited to the regime of the simulation, namely, to the propagation of visible and near-IR light in biological tissues. A more generic claim requires an extension of the research. AcknowledgmentsThe authors are in debt to Ziv Glasser for many useful discussions and experimental data. ReferencesL. V. Wang and H. Wu, Biomedical Optics: Principles and Imaging, John Wiley & Sons, Inc., New York
(2007). Google Scholar
C. L. Smithpeter et al.,
“Penetration depth limits of in vivo confocal reflectance imaging,”
Appl. Opt., 37
(13), 2749
–2754
(1998). http://dx.doi.org/10.1364/AO.37.002749 APOPAI 0003-6935 Google Scholar
A. F. Fercher et al.,
“Optical coherence tomography—principles and applications,”
Rep. Prog. Phys., 66 239
–303
(2003). http://dx.doi.org/10.1088/0034-4885/66/2/204 RPPHAG 0034-4885 Google Scholar
U. Morgner et al.,
“Spectroscopic optical coherence tomography,”
Opt. Lett., 25 111
–113
(2000). http://dx.doi.org/10.1364/OL.25.000111 OPLEDP 0146-9592 Google Scholar
W. Drexler et al.,
“In vivo ultrahigh-resolution optical coherence tomography,”
Opt. Lett., 24 1221
–1223
(1999). http://dx.doi.org/10.1364/OL.24.001221 OPLEDP 0146-9592 Google Scholar
P. K. Gupta,
“Tissue optics,”
76
(1999) http://www.iisc.ernet.in/currsci/may25/contents1.htm May ). 1999). Google Scholar
A. N. Bashkatov, E. A. Genina and V. V. Tuchin,
“Optical properties of skin, subcutaneous, and muscle tissues: a review,”
J. Innovative Opt. Health Sci., 4 9
–38
(2011). http://dx.doi.org/10.1142/S1793545811001319 Google Scholar
A. Yodh and B. Chance,
“Spectroscopy and imaging with diffusing light,”
Phys. Today, 48
(3), 34
–40
(1995). http://dx.doi.org/10.1063/1.881445 PHTOAD 0031-9228 Google Scholar
H. Jiang et al.,
“Optical image reconstruction using frequency-domain data: simulations and experiments,”
J. Opt. Soc. Am. A, 13 253
–266
(1996). http://dx.doi.org/10.1364/JOSAA.13.000253 JOAOD6 0740-3232 Google Scholar
T. O. McBride et al.,
“Initial studies of in vivo absorption and scattering heterogeneity in near-infrared tomographic breast imaging,”
Opt. Lett., 26 822
–824
(2001). http://dx.doi.org/10.1364/OL.26.000822 OPLEDP 0146-9592 Google Scholar
H. C. van de Hulst, Light Scattering by Small Particles, John Wiley & Sons Inc., New York
(1957). Google Scholar
K. Busch, C. M. Soukoulis and E. N. Economou,
“Transport and scattering mean free paths of classical waves,”
Phys. Rev. B, 50 93
–98
(1994). http://dx.doi.org/10.1103/PhysRevB.50.93 Google Scholar
D. A. Weitz et al.,
“Nondiffusive Brownian motion studied by diffusing-wave spectroscopy,”
Phys. Rev. Lett., 63 1747
–1750
(1989). http://dx.doi.org/10.1103/PhysRevLett.63.1747 PRLTAO 0031-9007 Google Scholar
I. Freund, M. Kaveh and M. Rosenbluh,
“Dynamic multiple scattering: ballistic photons and the breakdown of the photon-diffusion approximation,”
Phys. Rev. Lett., 60 1130
–1133
(1988). http://dx.doi.org/10.1103/PhysRevLett.60.1130 PRLTAO 0031-9007 Google Scholar
K. M. Yoo, F. Liu and R. R. Alfano,
“When does diffusion approximation fail to describe photon transport in random media?,”
Phys. Rev. Lett., 64 2647
–2650
(1990). http://dx.doi.org/10.1103/PhysRevLett.64.2647 PRLTAO 0031-9007 Google Scholar
R. H. J. Kop et al.,
“Observation of anomalous transport of strongly multiple scattered light in thin disordered slabs,”
Phys. Rev. Lett., 79 4369
–4372
(1997). http://dx.doi.org/10.1103/PhysRevLett.79.4369 PRLTAO 0031-9007 Google Scholar
R. Elaloufi, R. Carminati and J.-J. Greffet,
“Diffusive-to-ballistic transition in dynamic light transmission through thin scattering slabs: a radiative transfer approach,”
J. Opt. Soc. Am. A, 21 1430
(2004). http://dx.doi.org/10.1364/JOSAA.21.001430 JOAOD6 0740-3232 Google Scholar
Z. Q. Zhang et al.,
“Wave transport in random media: the ballistic to diffusive transition,”
Phys. Rev. E, 60 4843
–4850
(1999). http://dx.doi.org/10.1103/PhysRevE.60.4843 Google Scholar
A. Yaroshevsky et al.,
“Transition from the ballistic to the diffusive regime in a turbid medium,”
Opt. Lett., 36 1395
–1397
(2011). http://dx.doi.org/10.1364/OL.36.001395 OPLEDP 0146-9592 Google Scholar
Z. Glasser et al.,
“Effect of measurement on the ballistic-diffusive transition in turbid media,”
J. Biomed. Opt., 18
(10), 106006
(2013). http://dx.doi.org/10.1117/1.JBO.18.10.106006 JBOPFO 1083-3668 Google Scholar
K. M. Yoo and R. R. Alfano,
“Time-resolved coherent and incoherent components of forward light scattering in random media,”
Opt. Lett., 15 320
–322
(1990). http://dx.doi.org/10.1364/OL.15.000320 OPLEDP 0146-9592 Google Scholar
L. Wang et al.,
“Ballistic 2D imaging through scattering walls using an ultrafast optical Kerr gate,”
Science, 253 769
–771
(1991). http://dx.doi.org/10.1126/science.253.5021.769 SCIEAS 0036-8075 Google Scholar
B. B. Das, F. Liu and R. R. Alfano,
“Time-resolved fluorescence and photon migration studies in biomedical and model random media,”
Rep. Prog. Phys., 60 227
–292
(1997). http://dx.doi.org/10.1088/0034-4885/60/2/002 RPPHAG 0034-4885 Google Scholar
E. N. Leith et al.,
“Realization of time gating by use of spatial filtering,”
Appl. Opt., 38 1370
–1376
(1999). http://dx.doi.org/10.1364/AO.38.001370 APOPAI 0003-6935 Google Scholar
A. Kuditcher et al.,
“Ultrafast cross-correlated harmonic imaging through scattering media,”
Appl. Opt., 40 45
–51
(2001). http://dx.doi.org/10.1364/AO.40.000045 APOPAI 0003-6935 Google Scholar
J. C. Hebden,
“Evaluating the spatial resolution performance of a time-resolved optical imaging system,”
Med. Phys., 19 1081
–1087
(1992). http://dx.doi.org/10.1118/1.596826 MPHYA6 0094-2405 Google Scholar
Q. Z. Wang et al.,
“Fourier spatial filter acts as a temporal gate for light propagation through a turbid medium,”
Opt. Lett., 20 1498
–1500
(1995). http://dx.doi.org/10.1364/OL.20.001498 OPLEDP 0146-9592 Google Scholar
S. G. Demos and R. R. Alfano,
“Temporal gating in highly scattering media by the degree of optical polarization,”
Opt. Lett., 21 161
–163
(1996). http://dx.doi.org/10.1364/OL.21.000161 OPLEDP 0146-9592 Google Scholar
S. G. Demos and R. R. Alfano,
“Optical polarization imaging,”
Appl. Opt., 36 150
–155
(1997). http://dx.doi.org/10.1364/AO.36.000150 APOPAI 0003-6935 Google Scholar
B. B. Das, K. M. Yoo and R. R. Alfano,
“Ultrafast time-gated imaging in thick tissues: a step toward optical mammography,”
Opt. Lett., 18 1092
–1094
(1993). http://dx.doi.org/10.1364/OL.18.001092 OPLEDP 0146-9592 Google Scholar
K. M. Yoo, B. B. Das and R. R. Alfano,
“Imaging of a translucent object hidden in a highly scattering medium from the early portion of the diffuse component of a transmitted ultrafast laser pulse,”
Opt. Lett., 17 958
–960
(1992). http://dx.doi.org/10.1364/OL.17.000958 OPLEDP 0146-9592 Google Scholar
M. Kempe et al.,
“Ballistic and diffuse light detection in confocal and heterodyne imaging systems,”
J. Opt. Soc. Am. A, 14 216
–223
(1997). http://dx.doi.org/10.1364/JOSAA.14.000216 JOAOD6 0740-3232 Google Scholar
R. R. Alfano et al.,
“Light propagation in highly scattering turbid media: concepts, techniques, and biomedical applications,”
Photonics, Scientific Foundations, Technology and Applications, IV 367 John Wiley & Sons, Inc., Hoboken, New Jersey
(2015). Google Scholar
B. Brezner et al.,
“Ballistic imaging of biological media with collimated illumination and focal plane detection,”
J. Biomed. Opt., 20
(7), 076006
(2015). http://dx.doi.org/10.1117/1.JBO.20.7.076006 JBOPFO 1083-3668 Google Scholar
I. Delfino, M. Lepore and P. L. Indovina,
“Experimental tests of different solutions to the diffusion equation for optical characterization of scattering media by time-resolved transmittance,”
Appl. Opt., 38 4228
–4236
(1999). http://dx.doi.org/10.1364/AO.38.004228 APOPAI 0003-6935 Google Scholar
R. R. Alfano, S. G. Demos and S. K. Gayen,
“Advances in optical imaging of biomedical media,”
Ann. N. Y. Acad. Sci., 820 248
–271
(1997). http://dx.doi.org/10.1111/nyas.1997.820.issue-1 ANYAA9 0077-8923 Google Scholar
M. C. W. van Rossum and T. M. Nieuwenhuizen,
“Multiple scattering of classical waves: microscopy, mesoscopy, and diffusion,”
Rev. Mod. Phys., 71 313
–372
(1999). http://dx.doi.org/10.1103/RevModPhys.71.313 RMPHAT 0034-6861 Google Scholar
E. Akkermans and G. Montambaux, Mesoscopic Physics of Electrons and Photons, Cambridge University Press, Cambridge, United Kingdom
(2007). Google Scholar
Q. Liu and F. Weng,
“Advanced doubling-adding method for radiative transfer in planetary atmospheres,”
J. Atmos. Sci., 63 3459
–3465
(2006). http://dx.doi.org/10.1175/JAS3808.1 Google Scholar
K. Stamnes et al.,
“Numerically stable algorithm for discrete-ordinate-method radiative transfer in multiple scattering and emitting layered media,”
Appl. Opt., 27 2502
–2509
(1998). http://dx.doi.org/10.1364/AO.27.002502 APOPAI 0003-6935 Google Scholar
D. W. O. Rogers,
“Fifty years of Monte Carlo simulations for medical physics,”
Phys. Med. Biol., 51 R287
(2006). http://dx.doi.org/10.1088/0031-9155/51/13/R17 PHMBA7 0031-9155 Google Scholar
N. Metropolis and S. Ulam,
“The Monte Carlo method,”
J. Am. Stat. Assoc., 44 335
–341
(1949). http://dx.doi.org/10.1080/01621459.1949.10483310 Google Scholar
R. A. Forester, T. N. K. Godfrey,
“MCNP—a general Monte Carlo code for neutron and photon transport,”
Methods and Applications in Neutronics, Photonics and Statistical Physics, 33
–47 Springer-Verlag, New York
(1983). Google Scholar
B. C. Wilson and G. Adam,
“A Monte Carlo model for the absorption and flux distributions of light in tissue,”
Med. Phys., 10 824
–830
(1983). http://dx.doi.org/10.1118/1.595361 MPHYA6 0094-2405 Google Scholar
H. Kahn and T. E. Harris,
“Estimation of particle transmission by random sampling,”
Monte Carlo Method, 12 27
–30 U.S. Government Printing Office, Washington, D.C.
(1951). Google Scholar
A. N. Witt,
“Multiple scattering in reflection nebulae I. A Monte Carlo approach,”
Astrophys. J., S35 1
–6
(1977). http://dx.doi.org/10.1086/190463 ASJOAB 0004-637X Google Scholar
L. L. Carter and E. D. Cashwell,
“Particle-transport simulation with the Monte Carlo method,”
(1975). Google Scholar
S. L. Jacques, C. A. Alter and S. A. Prahl,
“Angular dependence of HeNe laser light scattering by human dermis,”
Lasers Life Sci., 1 309
–333
(1987). Google Scholar
S. A. Prahl,
“Light transport in tissue,”
Austin
(1988). Google Scholar
H. C. van de Hulst, Multiple Light Scattering, 1 Academic Press, New York
(1980). Google Scholar
R. G. Giovanelli,
“Reflection by semi-infinite diffusers,”
Opt. Acta, 2 153
–162
(1955). http://dx.doi.org/10.1080/713821040 OPACAT 0030-3909 Google Scholar
D. Contini, F. Martelli and G. Zaccanti,
“Photon migration through a turbid slab described by a model based on diffusion approximation. I. Theory,”
Appl. Opt., 36 4587
–4599
(1997). http://dx.doi.org/10.1364/AO.36.004587 APOPAI 0003-6935 Google Scholar
R. H. J. Kop et al.,
“Observation of anomalous transport of strongly multiple scattered light in thin disordered slabs,”
Phys. Rev. Lett., 79 4369
–4372
(1997). http://dx.doi.org/10.1103/PhysRevLett.79.4369 PRLTAO 0031-9007 Google Scholar
A. Ishimaru, Electromagnetic Wave Propagation, Radiation, and Scattering, Prentice Hall, New Jersey
(1991). Google Scholar
G. Zaccanti and P. Bruscaglioni,
“Derivation from the Lambert–Beer law in the transmittance of a light beam through diffusing media: experimental results,”
J. Mod. Opt., 35 229
–242
(1988). http://dx.doi.org/10.1080/09500348814550281 JMOPEW 0950-0340 Google Scholar
G. Yao and L. V. Wang,
“Monte Carlo simulation of an optical coherence tomography signal in homogeneous turbid media,”
Phys. Med. Biol., 44
(9), 2307
–2320
(1999). http://dx.doi.org/10.1088/0031-9155/44/9/316 PHMBA7 0031-9155 Google Scholar
R. K. K. Wang,
“Signal degradation by coherence tomography multiple scattering in optical of dense tissue: a Monte Carlo study towards optical clearing of biotissues,”
Phys. Med. Biol., 47 2281
–2299
(2002). http://dx.doi.org/10.1088/0031-9155/47/13/307 PHMBA7 0031-9155 Google Scholar
M. Y. Kirillin, I. V. Meglinski and A. V. Priezzhev,
“Effect of photons of different scattering orders on the formation of a signal in optical low coherence tomography of highly scattering media,”
Quantum Electron., 36
(3), 247
–252
(2006). http://dx.doi.org/10.1070/QE2006v036n03ABEH013130 QUELEZ 1063-7818 Google Scholar
L. G. Henyey and J. L. Greenstein,
“Diffuse radiation in the galaxy,”
Astrophys. J., 93 70
–83
(1941). http://dx.doi.org/10.1086/144246 ASJOAB 0004-637X Google Scholar
K. K. Bizheva, A. M. Siegel and D. A. Boas,
“Path-length-resolved dynamic light scattering in highly scattering random media: the transition to diffusing wave spectroscopy,”
Phys. Rev. E, 58 7664
–7667
(1998). http://dx.doi.org/10.1103/PhysRevE.58.7664 PLEEE8 1539-3755 Google Scholar
J. S. You, C. K. Hayakawa and V. Venugopalan,
“Frequency domain photon migration in the δ-P1 approximation: analysis of ballistic, transport, and diffuse regimes,”
Phys. Rev. E, 72 021903
(2005). http://dx.doi.org/10.1103/PhysRevE.72.021903 Google Scholar
|


